
Apis Flagship Fund commentary for the third quarter ended September 2021.
Q3 2021 hedge fund letters, conferences and more
Dear Partners,
Our Flagship Fund was down 1.3% net in Q3 2021. During the past quarter, our longs detracted 4.5% (gross), while our shorts contributed 3.6% (gross). At the end of September, the Fund was approximately 51% net long with the portfolio 87% long and 36% short.
Performance Overview (Gross Returns)
Strong relative performance in September brought overall performance in-line with global indices for the quarter. Long performance was hindered by relative underperformance in smaller capitalization stocks and some underperformance in value relative to growth. Offsetting weakness on the long side, short performance was excellent, aided by the aforementioned small-cap trends and several highly speculative names that have begun to receive scrutiny.
Asia was awash with robust performance in Japan, counteracting weakness in the rest of the region. Elsewhere, upside in North America was driven by strong short performance. Still, again this was more than offset in Europe where a couple stock-specific issues and weak markets generally hit our longs there. Shorts were positive across all sectors, especially Consumer names while longs struggled, particularly in the Consumer and Financial sectors.
Three of the top 4 long contributors came from Asia with Hansol Chemical adding almost 1% in the quarter, in addition to some Japanese names – BayCurrent Consulting and West Holdings – adding about 75 bps each. BayCurrent has experienced 20%+ growth for several years, with recent years accelerating as companies spend on so-called DX or “digital transformation” projects. Supported in many cases by tax incentives, companies are investing in sorely needed I.T. and BayCurrent provides specialized consulting in this area. Detractors in the quarter include Kambi (noted in our August letter), where we took our medicine. Another name dragging on performance was Cornerstone Building, a U.S. name that has meaningful share in several building products. While sales are not the issue and pricing power is high, Q2 profits proved disappointing as cost inflation could not be passed along to consumers fast enough. Generally, over the last 30 years, we’ve seen price improvements in cyclical areas such as housing provide a boost to margins. However, today’s cost inflation seems more complex than previous cycles, and managers are struggling to raise prices fast enough to keep pace.
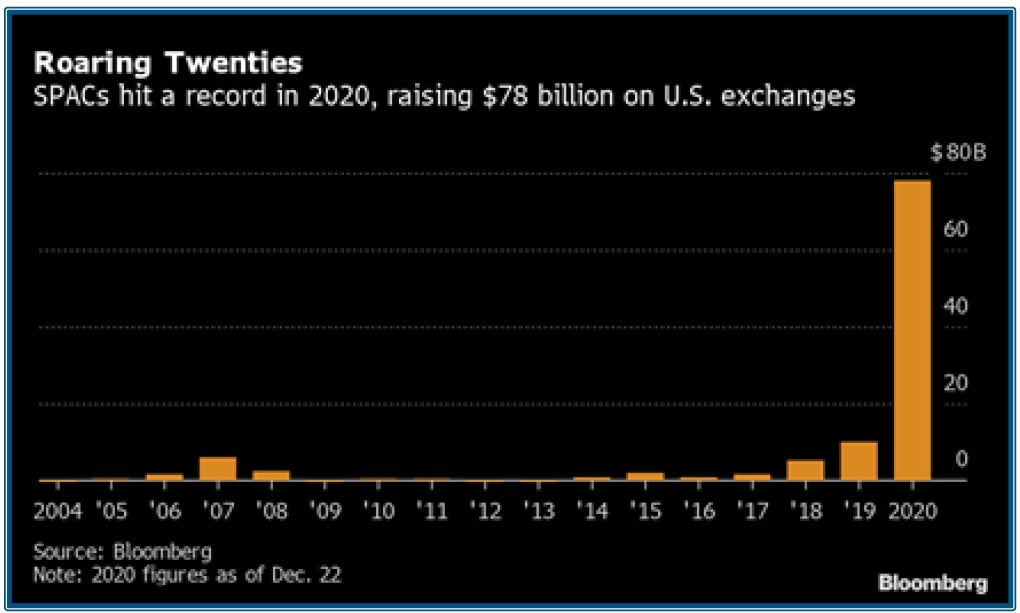
Short alpha was excellent, with our average short declining more than 10% in the quarter and many stocks falling 30% or more. One fertile area for shorting (no surprise) has been the hundreds of special purpose acquisition companies (SPACs). History suggests most of these companies will do very poorly. Given the unprecedented size and scope of this cycle, we firmly believe this era too will be remarkably bad. We highlight below a few names where the disconnect between value and reality is exceptional.
Portfolio Outlook And Positioning
Over the quarter, we have reduced net in the Fund roughly 10%, gradually taking exposure down through the quarter. This reflects both what’s working (shorts more than longs) and a recognition that there are macro issues percolating that argue for more caution.
Commodity/energy prices are booming (see discussion below), supply chains are a mess, unemployment versus job openings data is difficult to understand, political tensions and dysfunction continue to rise, along with debt/deficits – future economists and social scientists will have some fascinating work to do explaining this period in our history!
One simple economic axiom we subscribe to is, “you can’t have inflation without wage inflation.” Previous cyclical upticks in pricing proved fleeting as wages weren’t growing, but this cycle looks different as wage inflation appears everywhere. Quantitative easing is hard to justify, given high inflation and low unemployment but the U.S. Federal Reserve has excused this by saying inflation is “transitory” (would you expect them to admit otherwise?). We’re growing more skeptical as the burden of proof is shifting and can’t help but feel a Jimmy Carter sense of déjà vu. Tapering may be a catalyst, but eventually a Paul Volker-type will be needed to sort this mess out. As always, we remain pragmatic and know to stay in our “stock-picking” lane. Inflation beneficiaries are incredibly cheap and will see some incremental investment while overall gross and net exposures remain on the more modest side of our long-term ranges.
Commodity/Energy Supply Constraints and Price Inflation
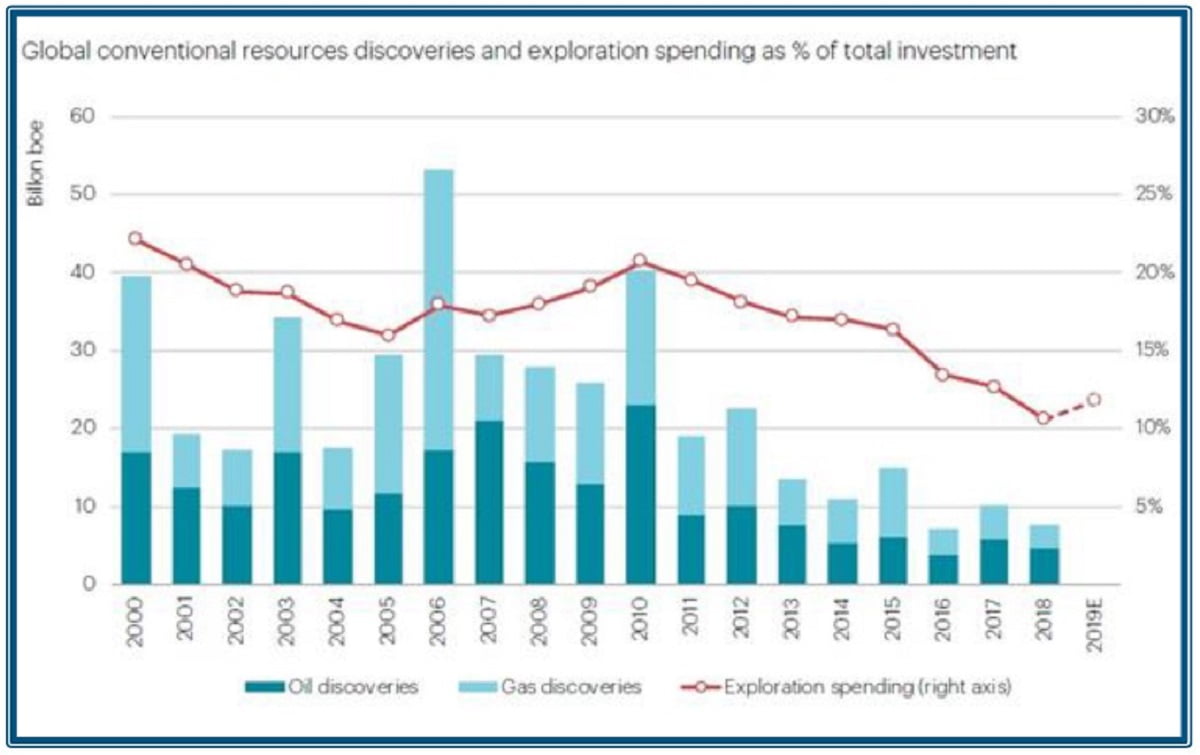
The current commodity spike started a decade ago after prices collapsed following a raging China-led bull market. Everything from copper to coal was in sudden oversupply after significant overinvestment in the early 2000’s. In the decade following 2010, investors sold off their holdings and turned towards far more interesting opportunities, particularly in technology whose index rose 4x while energy was flat. Companies in the commodity markets were starved of capital and, punished with falling stock prices, they shifted their focus to cash flow with religious fervor. Capital for exploration plummeted, exemplified by copper, where 223 discoveries were made between 1990 and 2015, but only one since 2015. Examples like this abound across all the major and minor commodities. But for a few episodes of intermittent shortages, general commodity supply was sufficient pre-2020, and no one noticed the fading reserves as the decade progressed. Then came COVID-19 and the subsequent economic stimulus and recovery. The limited maintenance investment that was made turned to virtually nothing as prices for commodities went from bad to- in the case of oil- negative in 2020. Piling on to this was an intense focus on decarbonization & ESG, which meant that commodities were essentially uninvestable for vast swaths of the investment community. For example, Norway’s $1.4 trillion sovereign wealth fund, ironically built on the back of oil riches from the North Sea, declared it would sell its stock holdings in traditional energy. It is one of just many that have made similar policy changes. At the company level, bankruptcies were already happening pre-COVID, but the negative oil price was the final straw for many more. Drilling activity went from bad to non-existent in the U.S. as companies tried to minimize their cash burn. Similar stories can be told in the coal, gas and metals markets, fertilizers, food crops, and so on.
None of this was a particular shock as warnings of shortages have been made for years. Those who tried to warn were met with a shrug and directed to look at the market price for the said commodity, which inevitably was plumbing new lows. Then came the economic recovery in late 2020, and suddenly the commodities needed were no longer available. Today, we see record-high prices, in many cases above the levels reached during the height of China’s import binge a decade+ ago. The potential implications are very, very big. Critically, there are broad macro and geopolitical issues if this price spike sustains or worsens. Look no further than the level of inflation or E.U.-Russia relations. Speculative stocks with long-duration cash flows are already struggling as investors contemplate higher discount rates and slower growth. The critical question is: how long does this last?
A few points are worth making –
- This is global. Consider a supposedly local market like electric power. Prices are spiking by hundreds of percent in China, Japan, Korea, the U.K., the U.S., etc. Coal and natural gas shortages are being reported in India, Brazil, Europe, China, and many other countries. Calls for government intervention abound and will likely further retard these markets. Iron ore from Australia and Brazil cannot meet Chinese demand – remember the mine dam collapse in Brazil; who would want one of these in their country? The global nature of this shortage is evidence that runs counter to the argument that this is simply the result of a governmental policy error.
- This is happening across all kinds of commodities – we don’t have a shortage in just one thing. The causes vary but range from the closure of nuclear & coal in Europe & Japan, the reckless embrace of renewables, to a new government in Chile that has discouraged copper investment, and near-total closure of access to debt and equity financing. With EV adoption the average home will need a 25-50% increase in electric power which will result in copper shortages (and plenty of other commodities) for the next decade. This breadth of shortage historically only happened during decade-long episodes of price volatility and reordering of investment leadership.
- This leads us to the final observation – the market is acting like this episode is temporary. Commodity price spikes and crashes happen all the time, and company valuations knowingly incorporate this by appearing cheap when prices are exuberant and expensive when commodity prices crash. This is the market’s way of looking past temporary swings to something more balanced in the future. What is potentially unique about this cycle is the degree to which the market is “looking past this” and the possibility that this lasts a while. On the first point, look no further than the free cash flow yields, which in energy, for example, start at 20% and go up from there. In most cases, this figure is simply based on prices that could be achieved using the futures curve (e.g., companies could lock this return in for years, right now). In coal, there are companies on 50-100% cash flow yields, where the market is indicating to us that this shortage will resolve in months. As for the duration, as always, it’s complicated. While things like shipping congestion, weather disruptions, post-COVID restocking of inventories, etc., are probably transitory, there are other more permanent factors. These include management’s focus on cash flow, ESG hurdles such as permitting, decarbonization, the loss of access to financing, and the transition to renewables. These long-term hurdles are not likely to change. In a recent conversation with a sell-side analyst, we heard story after story of trillion-dollar investment managers, former clients of this analyst, who have formally abandoned energy. With Tesla accounting for 1.7% of the S&P and the entire energy sector, including companies like Exxon and Chevron, at just 2.6%, it could take a while to normalize the imbalance.
Investment Highlights – Imdex Limited (ASX:IMD) (Australia – $780mm market cap)
One investment that plays upon the commodity price phenomena is IMDEX, which offers products for the mineral drilling value chain. We came across this company through our work on the actual contract drilling companies like Major Drilling and Boart Longyear, which we’ve been familiar with for years. IMDEX provides consumables, tools, and technology to these contract drilling companies, as well as directly to the large miners. It is a “picks and shovels” play on increased metals exploration & development spend, with its products present on 70% of mineral drilling projects globally. These include drilling fluids, drilling and rig alignment technologies, downhole sensors, geological data interpretation software, and in-field sampling and analysis tools. 80% of its revenue is related to exploration spend versus only 20% related to mining production.
As we mentioned earlier, exploration spend for many commodities has plummeted in recent years and is just now starting to tick back up to make up for years of underinvestment, in addition to structural growth in certain EV-related metals like cobalt, copper, and lithium. In fact, a recent report from Morgan Stanley shows that mining capex is expected to grow by 26% this year, the strongest growth since 2012. This is bolstered by junior miner equity raisings that are tracking 50-100% above pre-COVID levels, per a Jefferies analysis.
IMDEX is well placed not only to benefit from increased mining exploration spend, but it also has some company-specific factors that will drive growth beyond just the cyclical upswing in its end markets. Its revenue from tool rentals and software has increased as a percent of total revenues, which bodes well for margins. Tool rental and software revenue rose to 57% of the total in the fiscal year ended this June, up from 44% four years ago. In turn, gross margins have risen by over 400 basis points, and EBIT margins have increased by almost 700 basis points over the same period. There is still plenty of room to grow the software portion of the business, as only approximately 60% of the top 100 clients are using the cloud-connected platform currently. As more customers use the cloud platform, they will upgrade to rent cloud-connected tools, which provides a revenue (and margin) uplift to IMDEX. The company has also been complementing its organic research & development efforts with selective M&A to expand its offerings. For example, it recently acquired a geological data modeling and 3D visualization software provider.
We believe the few analysts that cover IMDEX are underestimating its growth potential. Revenue growth is forecasted at approximately 20% this fiscal year, which looks conservative. The company already reported 41% revenue growth in the first quarter, and activity in specific geographies remains hindered by COVID-19 related restrictions. Growth is forecasted to slow to high single digits next year, which seems too low given the metals supply and demand dynamics noted earlier in our letter, as well as the fact that even after 20-25% growth in 2021, exploration spend will remain nearly 50% below the prior peak seen in 2012. The company has a strong, net cash balance sheet which will enable it to continue to invest in new product development and M&A. We think the current valuation is reasonable at roughly 20x our forecasted FY 6/22 EPS, which is in-line with many capital-intensive heavy mining equipment providers, despite IMDEX having roughly double the margins. If we look at where the stock traded around the prior peak in its end markets in 2011/2012, we see potential for 70-80% upside.
“The Great SPAC-ulation”
As noted earlier, we feature a sampling of SPACs currently held on the short side. This opportunity has presented itself after a spectacular bubble formed in 2020, as illustrated in the chart below:
SPAC #1
This SPAC focuses on auto insurance charged by the mile. As consumers, we certainly see the virtue in this approach. The reality, however, is that the market for this insurance is quite narrow and, more concerning, this SPAC’s competitors are far better financed and distributed. That has been reflected in the significant losses (simply put, their premiums don’t cover their losses) and meaningful reduction in company-guided financial targets. After running from $10 to $20 in Q4 2020 and Q1 2021, the threat of endless losses and capital raises has brought the shares down to just $3. The euphoria that levitated these shares late last year is now replaced by the fear that this may not be an ongoing business.
SPAC #2
This $3bn market cap company offers a platform that integrates with mobile games, allowing players to compete for real money. The way it works is that players deposit cash into an account and then bet against each other in the various games that are integrated with the platform. The company typically keeps 15-20% of the total bet, which it shares with game developers, while the winning player receives the rest. In theory, this is an attractive proposition for mobile game developers as it offers an alternative means of monetization beyond the traditional methods such as advertising and in-app purchases. However, a deeper look at the company’s financials reveals a business model with questionable unit economics. At a high level, the company effectively spends $1.15 (and growing) in marketing costs for every $1 it generates in revenue. Nearly half of these marketing costs are in the form of “engagement marketing” which is a fancy way of saying free bonus cash. Furthermore, the company recognizes a portion of this bonus cash as revenue when players eventually bet with it, in effect paying themselves. These expenses as a percentage of revenue have only continued to grow in the business’s brief history as a publicly traded company. While the current cash position should enable the company to keep the treadmill going for several years, we believe this is clearly an unsustainable business model.
SPAC #3
This $1.7bn market cap company was originally attempting to build a subscription-based “transportation as a service” using a fleet of stripped-down electric vehicles. But the Founder and CEO quit four months after the SPAC deal closed, followed quickly by the entire management team (CFO, Head of Strategy, Chief Legal Officer, Head of Development, etc.). The SEC opened an investigation the following month and, if this wasn’t enough, the new CEO immediately pivoted strategies from a capital-light, outsourced manufacturing model to a capital-intensive one, bringing manufacturing in-house. They significantly ramped up the expected cash burn and pulled all guidance, which had just been issued a few months prior. There are more than enough red flags to assume this SPAC won’t survive long.
SPAC #4
This $1.2bn market cap company is a manufacturer of “Smart Glass” which is an electrified window that can adjust tint to darken or lighten. The theory is that it can reduce building electricity costs (the company claims 10% savings), but the reality is that those savings require 10x the upfront investment. Despite $2bn sunk costs and 15 years of R&D, gross margins remain negative(!) 150%, and cash continues to bleed out at a $200-300 million/year clip, leaving them about 18 months of runway. The SPAC itself removed a problem for Softbank, which had been stuck for years, adding to its ownership in several “down rounds” where V.C. investors add capital at lower and lower valuations. If that’s not enough, the company has delayed filing financial reports and is in violation of exchange rules as the auditing committee investigates disputed warranty accruals. We think this company is unviable and will eventually be worthless.
SPAC #5
This $3.4bn market cap company bills themselves as a next-generation Medicare Advantage insurer by leveraging their machine learning platform to improve care and reduce costs, driving profitability and what they have coined their “virtuous growth cycle.” The reality is that this growth comes at the literal cost of the Medical Care Ratio (MCR), the percent of revenue they payout for enrollee care, which ballooned to 107.5% and 111% in the first two quarters of 2021, respectively. Behind the tarnished façade of a company losing more money by virtue of their growth (maybe that’s what they meant?) is a backdrop of alleged related-party transactions to boost sales, failure to disclose a U.S. Department of Justice investigation into inappropriate marketing practices, and an algorithm that seems more geared to find upcoding opportunities (to get a larger payout from CMS per patient) than optimizing patient care. Instead of a business on the path to profitability with a noble ethos, we expect this company to continue to lose money at a rate of $500-$700mm a year well into the future, requiring additional raises and increasingly diluting value to shareholders.
As always, we encourage your questions and comments, so please do not hesitate to call our team here at Apis or Will Dombrowski at +1.203.409.6301.
Sincerely,
Daniel Barker
Portfolio Manager & Managing Member
Eric Almeraz
Director of Research & Managing Member


