
The boffins at CashNetUSA have embarked on an in-depth look at the growth in the American economy over the past half-century and presented their findings in a fascinating new set of charts. One of the main changes in the economy over this period has been the change in emphasis from manufacturing to service. Manufacturing accounted for over a quarter of the workforce in 1967, but by 2017 accounted for just 8.5% of workers. Service sector employment grew by roughly the same amount as manufacturing employment shrank in that period. This is a big reason that state economies have been more volatile than the national economy. Manufacturing cities in the Rust Belt such as those in the state of Michigan have nosedived, while the Sun Belt cities have seen their economy and their population soar.
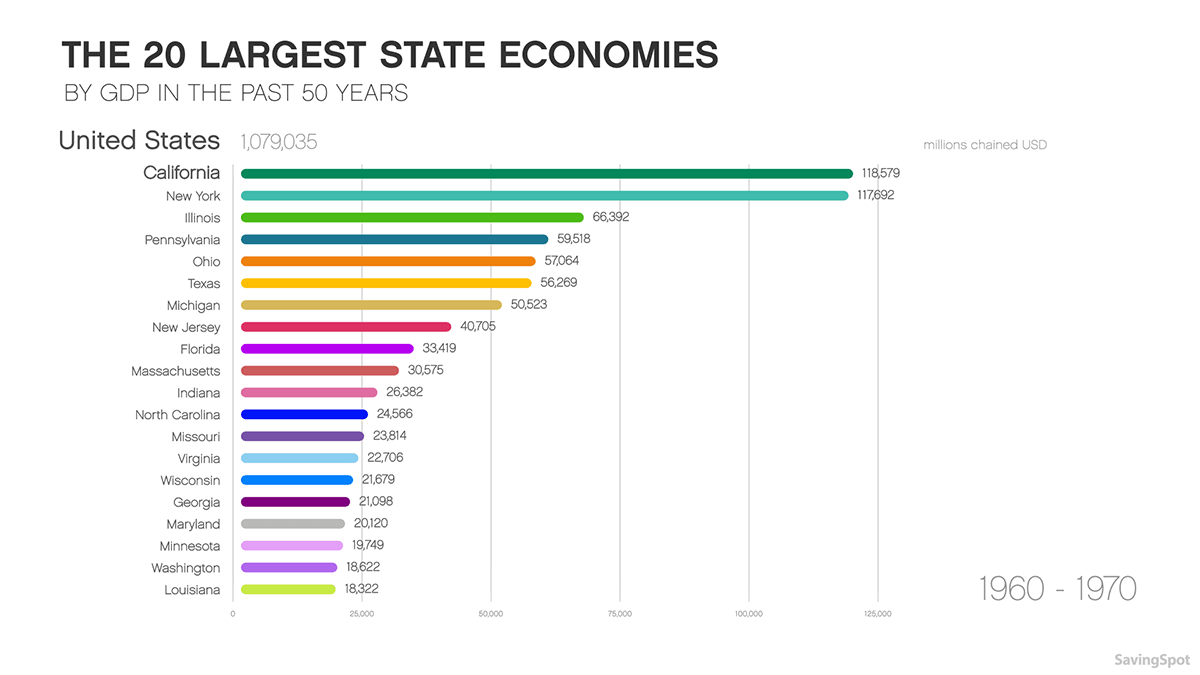
The economy has more than quadrupled in size since the Summer of Love, from $4.6 trillion in 1967 to $18.6 trillion today. Growth has been steady on a nationwide level, but state to state it has been more dynamic. Using inflation-adjusted GDP figures from the U.S. Bureau of Economic Analysis (BEA), the researchers have compared 20 of the largest state economies over the years 1967 to 2017.
[REITs]Q2 hedge fund letters, conference, scoops etc
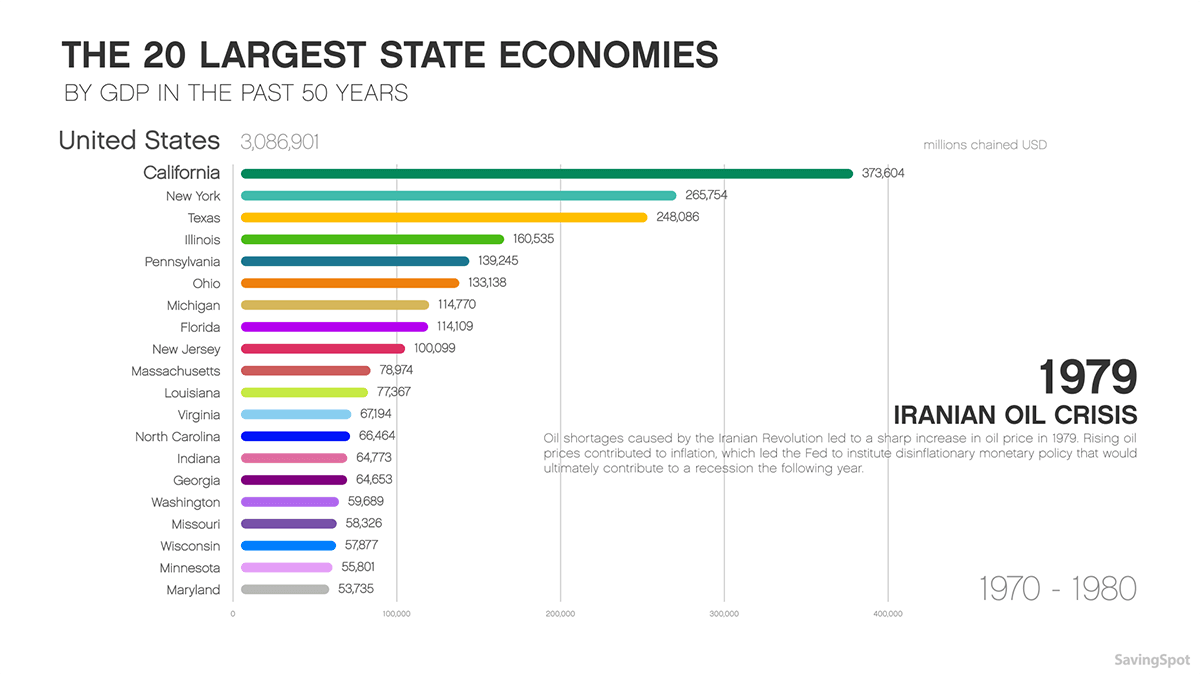
Post-war economic expansion and rising federal expenditure up to the late 1960s led to better conditions for most Americans, with GDP rising by 55.5% in the decade up to 1969. But inflation at the end of the ‘60s punctured the post-war bubble ahead of a decade of increasing competition from Asian countries with growing industrial sectors.
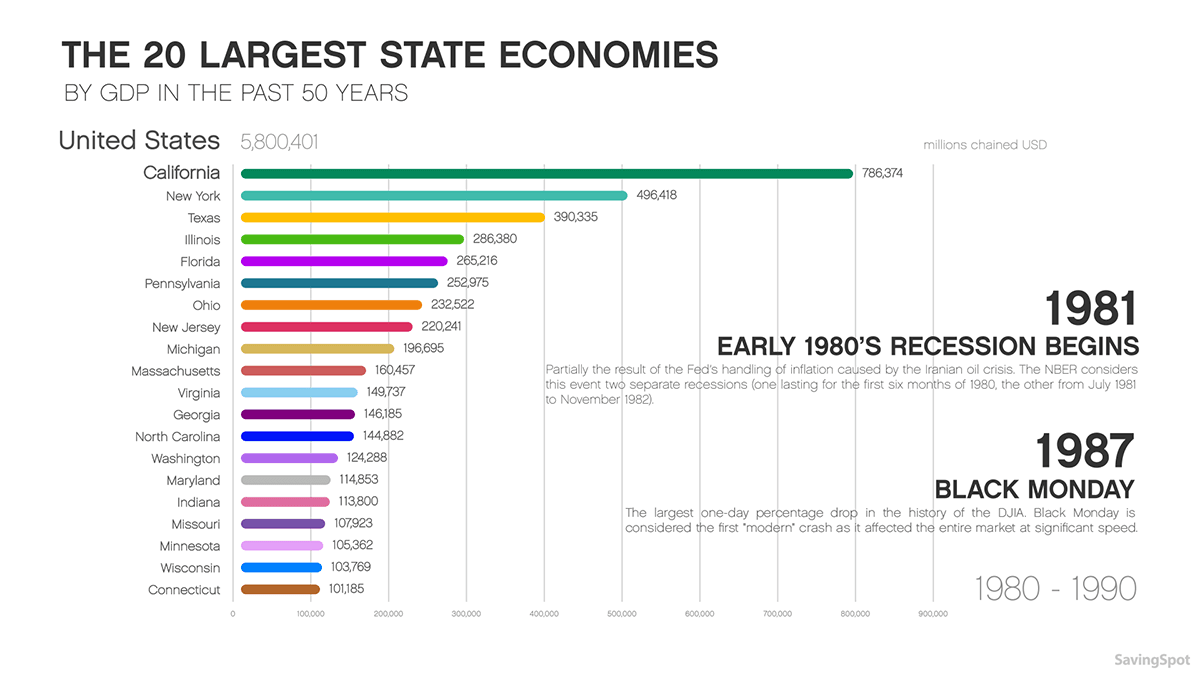
High oil prices and cheap imports made the 1970s a tough period for Rust Belt states and the decade ended with another recession. Strong economic growth as the 1980s progressed came hand-in-hand with rising population growth in states such as Florida, California, and Georgia, where the rust belt’s economic refugees fled for a lower cost of living and new opportunities. The stock market crash in October 1987 (Black Monday) was a major blip – the most significant one-day percentage drop in the Dow Jones Industrial Average to date.
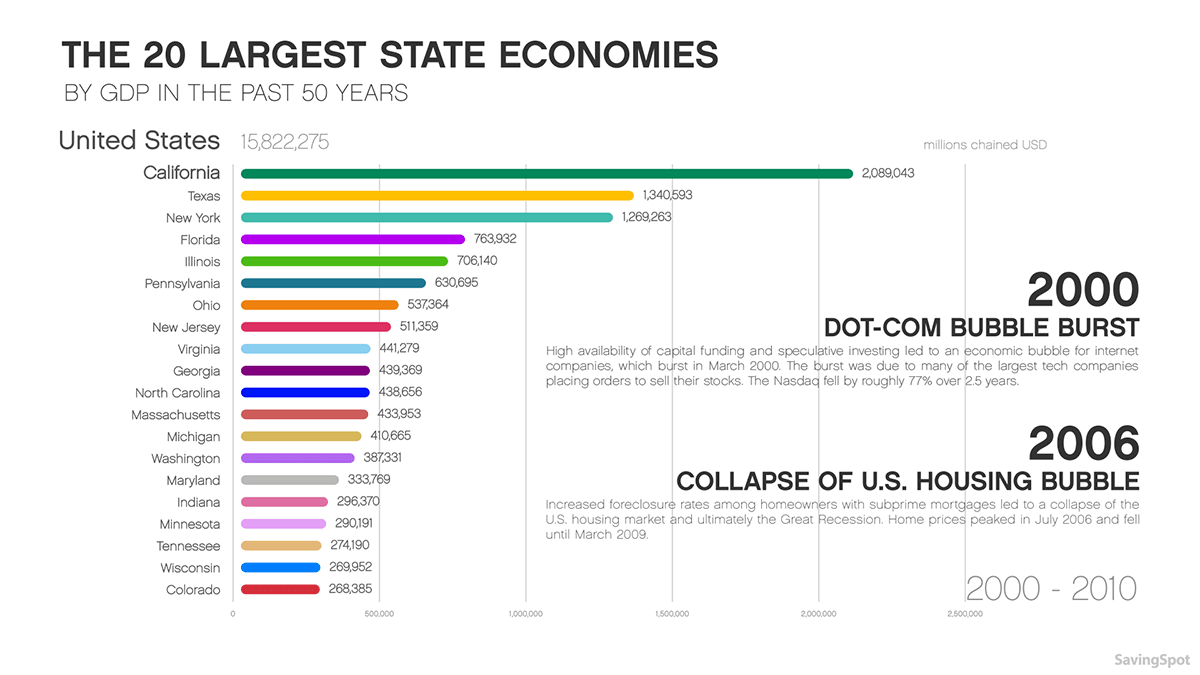
Another recession at the start of the 1990s can be blamed to some extent on the Gulf War. But the recovery was lengthy and fruitful, lasting until March 2001 when recession hit again with the burst of the dotcom bubble. Later that year, the 9/11 attacks further hindered US economic growth as the Gulf War had a decade earlier.
Then came the recession of 2007-2009, thanks to the ‘catastrophic failures’ of arrogant and selfish bankers and traders. Continuing population growth in the Sun Belt cushioned the blow in those parts of the country, with Texas overtaking New York to become America’s second largest state economy.
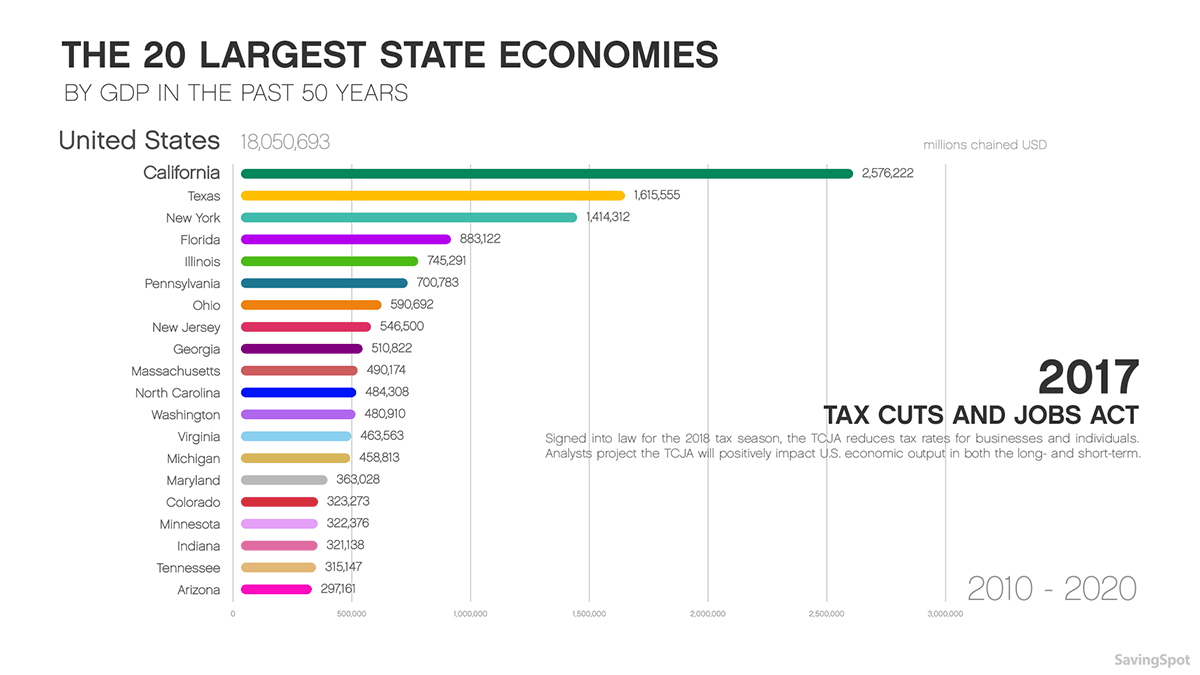
That bust would come to define much of the politics of the latest decade. Some states have recovered their employment levels much more slowly than others, with New York and Illinois experiencing unspectacular growth in GDP. Donald Trump’s dramatic measures to boost the economy may superficially improve conditions, but at the cost of healthcare for everyday Americans and neglect of the environment – leading to long-term economic liabilities and more precarious day-to-day conditions for all but the wealthiest of Americans.


