A summary of the new Covid cases and its impacts over the month of October by Greg Presseau Of Perennial Capital.
Q3 2020 hedge fund letters, conferences and more
October 30 Update: US Covid cases have inflected up
Since last week’s update, we have seen:
- Germany and France have declared lockdowns through November
- US Covid cases have inflected up, fitting our projections
- NY Covid cases (our early indicator for Padd 1 fuel demand) has started to pick up but it’s not clear if there’s a strong ‘inflection’
It is clear that Covid cases in the EU have been climbing. However, business activity, as measured by Tomtom, showed few to no declines YoY in traffic congestion through last week in the UK/France/Germany. This week, however, we are seeing declines in London and Paris. This contrasts with Portugal/Italy/Greece/Spain which saw congestion down about 15-20% prior to the acceleration in cases. To explore why this might be, we looked at which economies in the EU have the highest exposure to tourism as a percent of GDP:
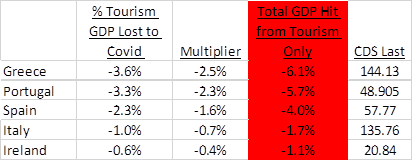
Source: Bloomberg, Eurostat, “Estimating the Multiplier Effects of Tourism Expenditures on a Local Economy through a Regional Input-Output Model”, Horvath & Frechtling
Notice that we have big dents to GDP in Greece/Portugal/Spain when taking tourism and the multiplier effect into account. Surprisingly, these country’s CDS are still at rock bottom prices just as we see a second wave, and presumably even less tourism.
As a result of the lockdowns and weak economic performance, it is our bias that the euro should continue to struggle, particularly against the Asian currencies, as lockdowns should entail more monetary/fiscal stimulus and further erosion to the economy.
Looking at the US, our projections from last week remain intact:
Source: Bloomberg, CP Capital
US cases are inflecting higher and there are regional areas where the ICU’s are being stressed. However, so far the healthcare system appears equipped to handle the inflection in cases.
So far, the US hospitalization rate is 5.47% (covidtracking.com). To explore whether there are any relationships to age/health we looked at select countries as per below:

Source: ECDC, Bloomberg
For most countries, the hospitalization rate is close to obesity rate*the % of the population over 65 (Norway, Romania, US). However, there seem to be a few outliers that most likely have to do with healthcare systems. E.G. Japan’s healthcare system is top 10 in the world and therefore hospitalization rates may be high. Interestingly, Finland has a high obesity rate and older population yet hospitalizations remain low for the time being.
In any event, using the 5.5% hospitalization rate, we see the NY healthcare system getting stressed by late November. The only glimmer of hope is that NY cases are increasing linearly and we therefore are holding off on making any further, aggressive adjustments to Padd 1 fuel demand.
NY cases should ‘inflect’ higher this weekend/mid next week:
Source: Bloomberg, CP Capital
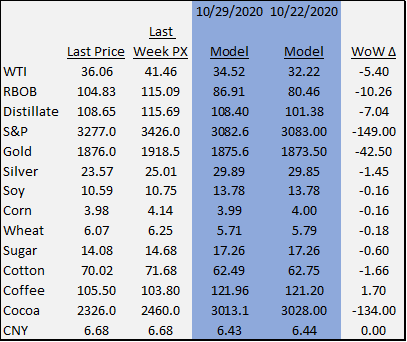
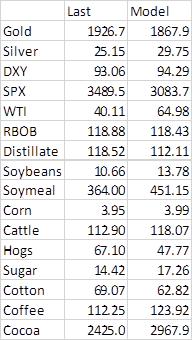
Our price models are largely unchanged this week and markets moved toward our projections in 9 of 13 markets below. We still see further downside to the S&P but most other commodities are at or near our price model targets:
Update October 22: European covid cases grow exponentially
Updating this further:
- In the last week we continue to see European covid cases grow exponentially
- Ireland has imposed a 6 week hard shutdown while other nations are still showing some restraint, choosing targeted lockdowns
- The US cases are in line with our forecast. However, we are still focusing on NY state which is targeting micro-clusters. Nonetheless, at this time we still believe hospital bed utilization will dictate policy
- The next ten days are crucial for our forward forecasts for fuel demand in PADD 1 and economic performance in the Northeast
European cases continue to grow, up over 100% in the last 7 weeks (but still just 1.1% of population…):
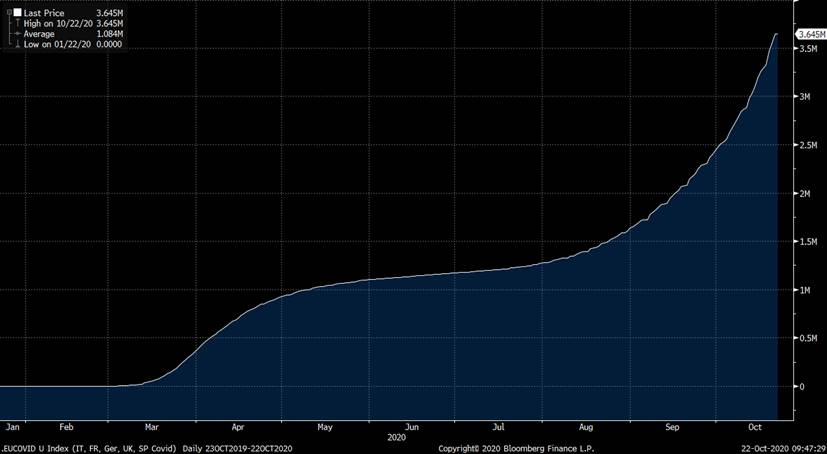
Source: Bloomberg
It is unlikely that we see cases slow w/out quarantines. The question is whether the EU needs quarantines as we are projecting that the healthcare system doesn’t get stressed until there are 25mm cases a day. In other words, the system has more than adequate capacity to handle a severe outbreak system-wide (however there could be regional stresses which would require targeted quarantines-e.g. Ireland).
Looking at the US, we see that cases are falling inline w/ our projections:
Source: Bloomberg, CP Capital
Perhaps expectedly, most of the new cases are in ‘red’ states. Below is a chart of cases by ‘red’ and ‘blue’ states as a percent of population:
Source: Bloomberg, CP Capital
Notice the ‘red’ states have had the highest growth in cases.
The main question for us is how NY responds as we have an inflection in cases over the next 10 days. If cases start to pick up in NY, then we believe NY hospital bed utilization will reach 10%. In March of this year NY went to a hard lockdown when hospital bed utilization reached 10%. (It should be noted that Wisconsin courts just restored restrictions on bars and restaurants as hospital bed use reached 85%, well above the 10% threshold seen in NY.)
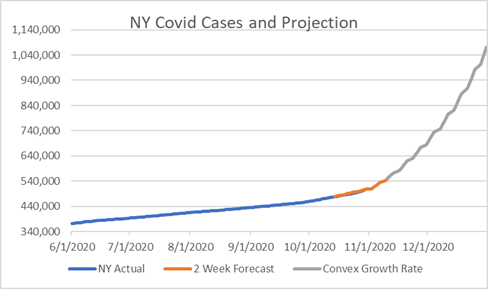
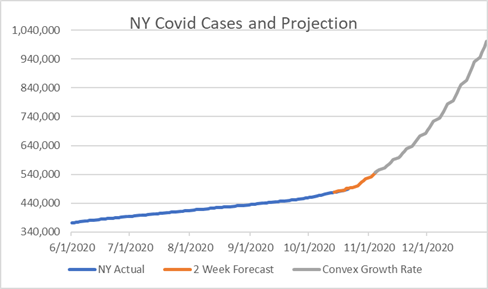
Below are our projections for Covid cases in NY state. Notice that we have the slope picking up over the next ten days:
Source: Bloomberg, CP Capital
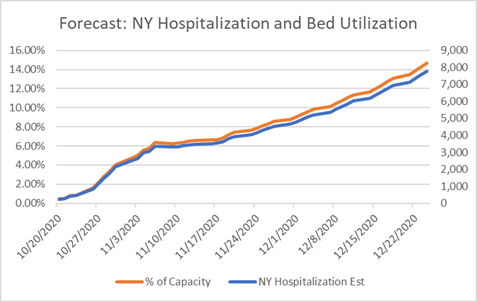
If we see the slope pick up over the next ten days, the probability for hospitalizations to reach 10% of capacity by the second half of November will go up. As we gain confidence in this projection we will have a better idea on forward fuel demand for Padd 1 and economic performance in the Northeast. Below are our current estimates for hospital bed utilization:

Source: CP Capital
Notice that we have hospital bed utilization at 10% by the end of Nov/early Dec. This will be a moving target as data comes in over the next ten days.
Our price projections are mainly unchanged:
Update October 13: Red vs Blue
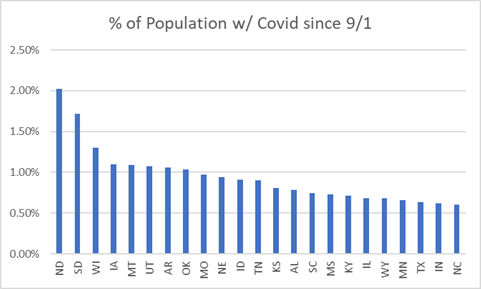
Looking closer at the increasing rate of US Covid cases we are seeing that it is recognizably a red (more rural) vs. blue (more urban) outbreak. First, looking at the aggregate number of cases from 9/1 to 10/12 as a percentage of population we see:
Source: Bloomberg
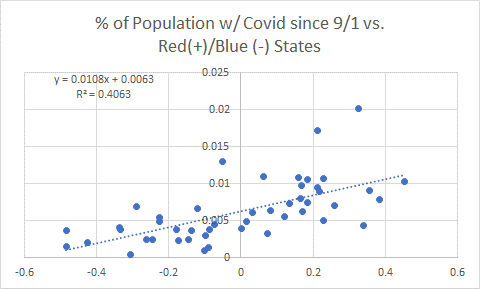
Next, we can look at the 2016 election as an indicator for red or blue states by taking the percent of red votes in 2016 minus the percent of blue votes. For example, in 2016, 30% of Alabama voted for Clinton vs. 69% for Trump so AL would have a score of 39% (69%-30%=39%). Plotting this red/blue score on the x-axis vs. percent of population with COVID since 9/1 we see the following:
Source: Bloomberg, Wikipedia
It appears that red states have been more inclined to keep businesses open (read points of contact) vs. blue states. Indeed, NJ, a blue state, just opened up indoor youth sports yesterday. This is about 2-3 months behind other states.
As red states see outbreaks reach 2% of population, there has been little change to policy and the latest guidance out of North Dakota, the leading Covid state, was to wear a mask but there were no shutdowns/broad measures.
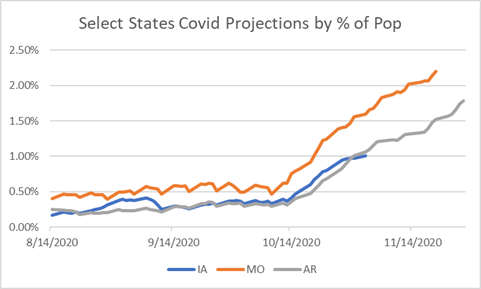
Using ND as a model for IA, MO and AR for forward Covid projections, we see that those states are two weeks, four weeks and six weeks behind ND, respectively, regarding temperatures. Recall that temperatures are our common denominator with respect to transmission rates. Offsetting ND Covid growth rates by the respective weeks for each state we see that IA, MO and AR should see an increasing amount of new Covid cases in the coming weeks:
Source: Bloomberg, CP Capital
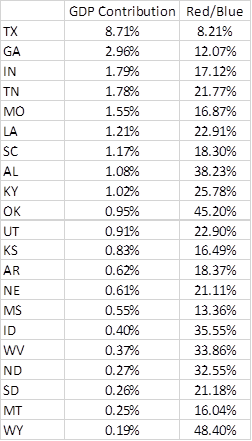
Given that the Northeast has seemingly contained the second wave so far (see note below), our focus to calculate whether or not we see broad lockdowns will be on the strong red states which contributed 27.5% to GDP in 2019 . As of right now it is early days but over the next few days we will be monitoring the below states for any indication that the slope of cases is increasing. Below are the states we will be monitoring and its GDP contribution and net percent that voted republican:
Note on the Northeast:
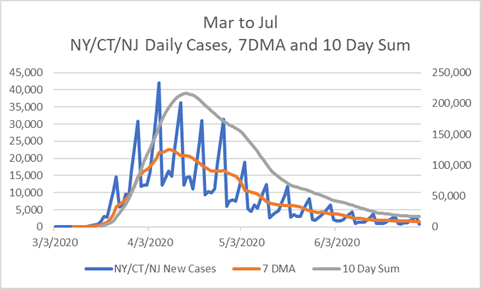
Our focus hitherto was on a breakout in the northeast. However, so far it appears that the northeast, is doing a better job at containing the virus through mask wearing but also at the expense of the social economy. Notice that we are forecasting a much lower 10 day sum of cases vs. the April peak:
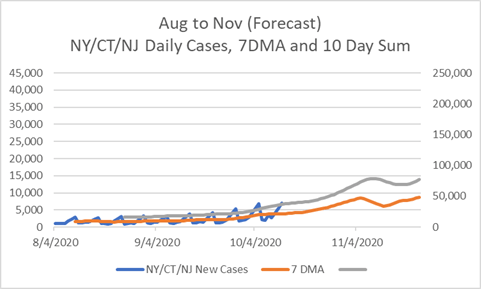
Source: Bloomberg, CP Capital
- The second wave of the coronavirus is upon us in the EU and it looks likely that the US will follow in two weeks or so
- Due to better treatment, it is very likely that the US and the EU will not hit hospital bed capacity
- Food service and accommodation will likely continue to detract from economic performance which should require more government assistance
- This stimulus should erode the Euro and USD while the Japanese yen and Chinese Yuan should outperform which should be supportive for commodities
As the northern hemisphere (~90% of earth’s population) turns cooler, we are starting to see the number of new covid cases slope up. Looking at the US and the EU, we see that both regions have the same amount of new cases/day but the EU has a much steeper slope:
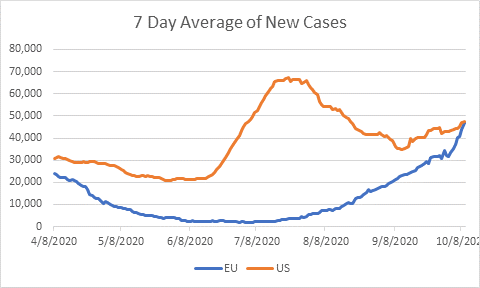
Source: Bloomberg
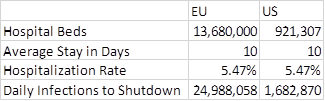
To test whether these governments shutdown, we need to figure out how many hospital beds each region has. According to EuroStat there are 400 hospital beds per 10,000 people in EU or 13.68m beds vs. the US at 921K according to AHA.org. If we know hospital capacity, average hospital stay and the hospitalization rate, we can calculate what daily infection rate will cause officials to do mass quarantines/shutdowns.
Assuming the average hospitalization stay is 10 days (down from 17 when the pandemic first hit) and that the average hospitalization rate is 5.47% (Covidtracking.com), then we would need to see about 25mm new cases in the EU and 1.68mm in the US. In other words, it seems highly unlikely that we hit the hospital capacity threshold due to Covid as treatment has shortened the duration of a hospital stay:
Source: CDC, EuroStat, Covidtracking.com
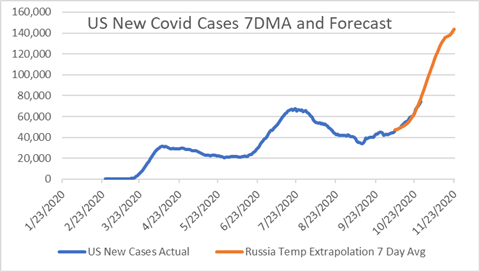
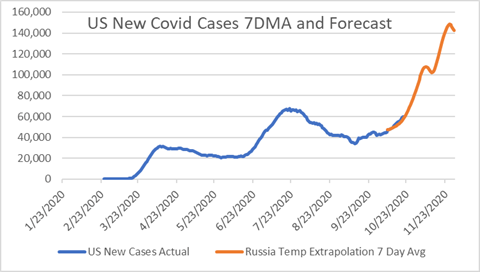
According to our estimate using Russian temperatures and infections rates, we are forecasting US infection rates to reach 80k/day by the end of November:
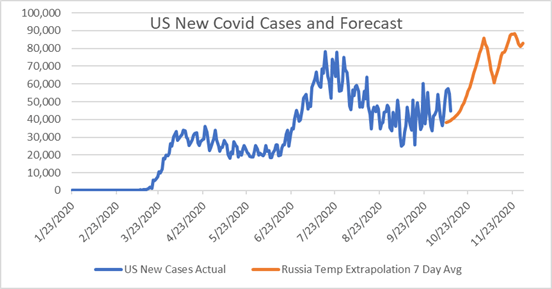
Source: Bloomberg, CP Capital
What the above suggests is that we will most likely (94.5% probability-90k cases/1.68m) not hit hospital bed capacity which would ensure a lockdown in the EU and US. If we see the US and EU remain ‘open’, we should still see consumption hit. Food service/accommodations have detracted, on average, 3.6% from GDP this year in the US. This looks likely to continue and this shortfall in the economic contribution will likely require another round of stimulus to the tune of $350B. This M2 creation should continue to erode the value of the USD vs other currencies, in particular the Chinese yuan and the Japanese yen as these two countries have contained the virus with less than 1k new cases/day.
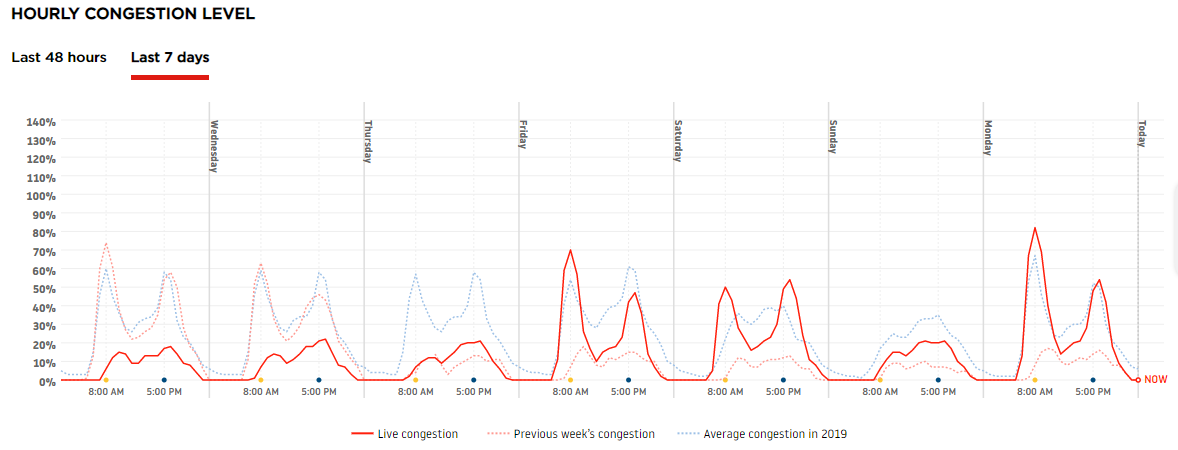
It appears that the Chinese economy continues to operate at levels similar to 2019, as Tomtom data suggests in Shanghai and Beijing (note: China returned from Golden Week on Friday):
Shanghai Congestion:
Beijing Congestion:
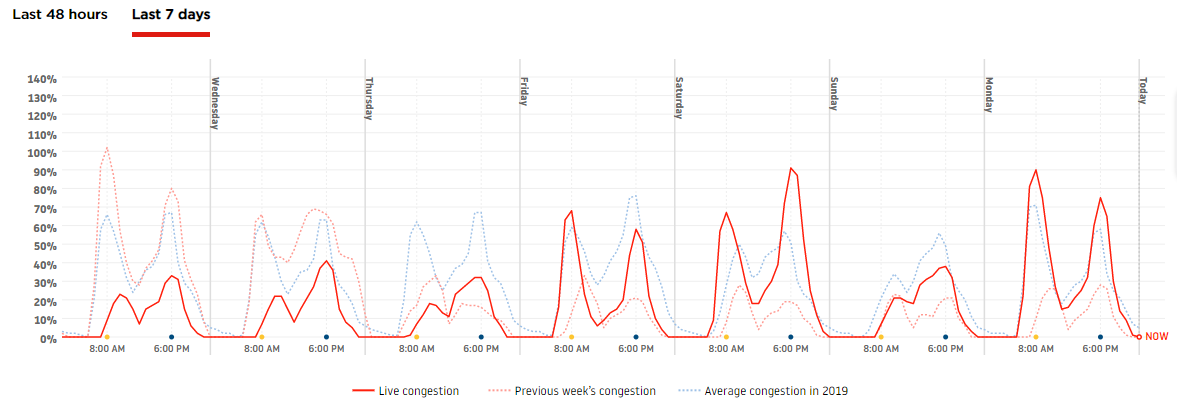
Source: Tomtom.com
Assuming that the Chinese economy continues to perform flat to 2019 and more stimulus is not needed as a result, we are forecasting the CNY to hit 6.4 vs. the USD in 2021 which should provide support for commodities:
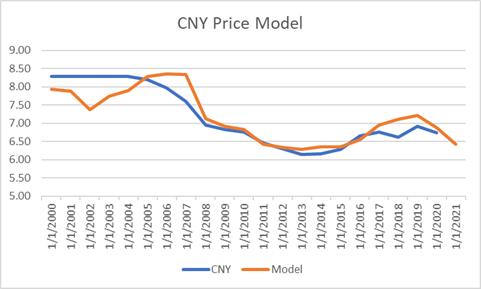
Source: CP Capital
Price model output for Q4-we are expecting unemployment in the US to go up in Q4:
Update October 5: Increase In cases in the EU and Russia
We are starting to see early indications of increased confirmed COVID cases in the EU and Russia and this begs the question, will we see a meaningful increase in the US? The answer, if temperatures are any indication, is ‘yes’. Looking at Russian cases we see:
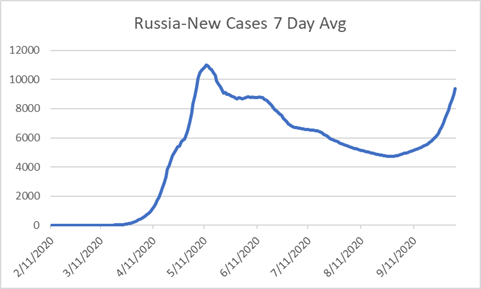
Source: Bloomberg
We are seeing the slope increase for new cases as temperatures cool. Recall that we use the rule of thumb that as high temps fall below 65d F/18d C, the virus stays active longer. The average high temperature in Moscow over the last two weeks was 19d C. Below is the 5 year seasonal and 2020 high temperature in Celsius for Moscow:
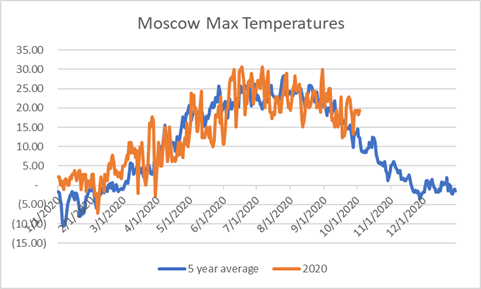
Source: Bloomberg
Looking at the 14 day, five year average high NY temperatures, we see that high temperatures hit our 18d Celsius threshold by October 23. Using this input, and offsetting the Russian slope of cases, we can come up with a rough guideline on US cases:
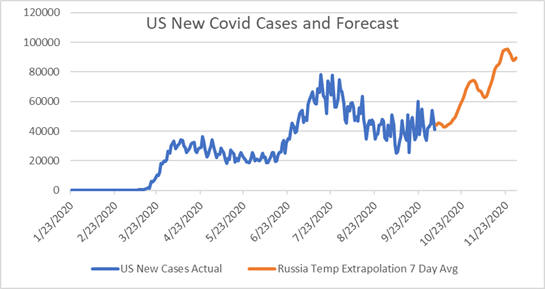
Source: CDC, Bloomberg, CP Capital
From 10-5 to 11-30 we see new cases total just shy of 4 million or just over 1% of the US population. It should be noted that we see 1.6M new cases by Nov 2nd using this approach. This is a very crude model but I’m confident the slope will go up as states continue to re-open (positive coefficient) and temps cool (negative coefficient).
So, if we agree that cases will go up, what are the odds that we see businesses slow again? If actions by the EU/Russia are any measure, the odds are high as those governments are already announcing closures that will hopefully inhibit transmission. The problem is that leisure/hospitality is already struggling after a dismal vacation season and who knows if that industry can withstand another lockdown.
We continue to stress that the trading environment will be difficult as we have the election, a better idea on a vaccine and a crescendo in cases/slowdown in the economy all of which will affect our macro indicators. We continue to limit our potential exposure and will continuously monitor the above drivers/probabilities to add/lower risk.