Lyrical International commentary for the year ended December 31, 2021 highlighting their holdings in TFI And Element.
Q4 2021 hedge fund letters, conferences and more
2021 International Value Review
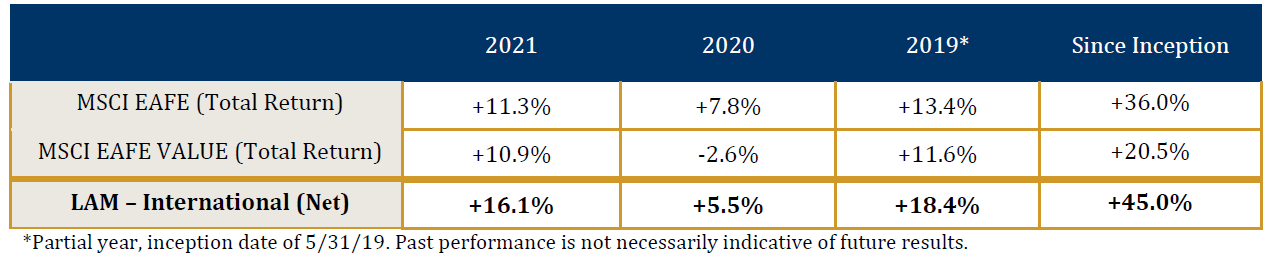
Upon examination, 2021 was a great year for Lyrical International. Our strategy has now outperformed the EAFE Value in each calendar year since inception, and at the end of May will reach its three-year performance mark.
For 2021 we returned 16.1%, compared to the ~11% for the MSCI EAFE and EAFE Value. On a constant currency basis, our return would have been ~22%, as foreign exchange rates had a -600bps impact.
The rebound in value stocks that began around the market bottom during the COVID panic in March 2020 continued into 2021. Cheap stocks—those with low P/E ratios—were one of the best performing groups of the year.
As the economy reopens, COVID is still wreaking economic havoc, but now in the form of inflation. Demand has come back strong after being impacted by lockdowns, but supply chains and labor forces are still recovering. With demand outstripping supply, shortages and upward price pressures are prevalent. While inflation has been bad for the broad market in the past, it has nonetheless been good for value stocks, a pattern we hope to see continue with any current bout of inflation.
We head into 2022 well positioned. Our portfolio enters 2022 with a lower valuation than it started 2021 due to earnings growth and stock replacements. Moreover, COVID gave us deeper confidence in the fundamental strength of our businesses, whose earnings fell less than the market in 2020 and then grew faster in 2021. With a long-term earnings growth profile better than the EAFE, our portfolio trades at nearly a 30% discount as of year-end, and our estimated upside to fair value is higher than normal at about 75%. While the strategy has performed well since inception, considering the portfolio’s attractiveness we believe the best is still yet to come.
Return Of The Value Factor
In 2021, the value factor once again returned to its historical norm, meaning a strong correlation between returns and valuation metrics. When we mention “value stocks” we are referring to the stocks with the lowest five-year forward P/E ratios in our universe of the top 1,500 international stocks.
In the table below, we show the 2021 returns of our fund along with our universe of the top 1,500 ex-US stocks sorted by valuation quintile. We also show the return of the indices and the Morningstar Foreign Large Value peer group. The cheapest stocks with the lowest P/Es had the highest returns, and the priciest stocks underperformed significantly.
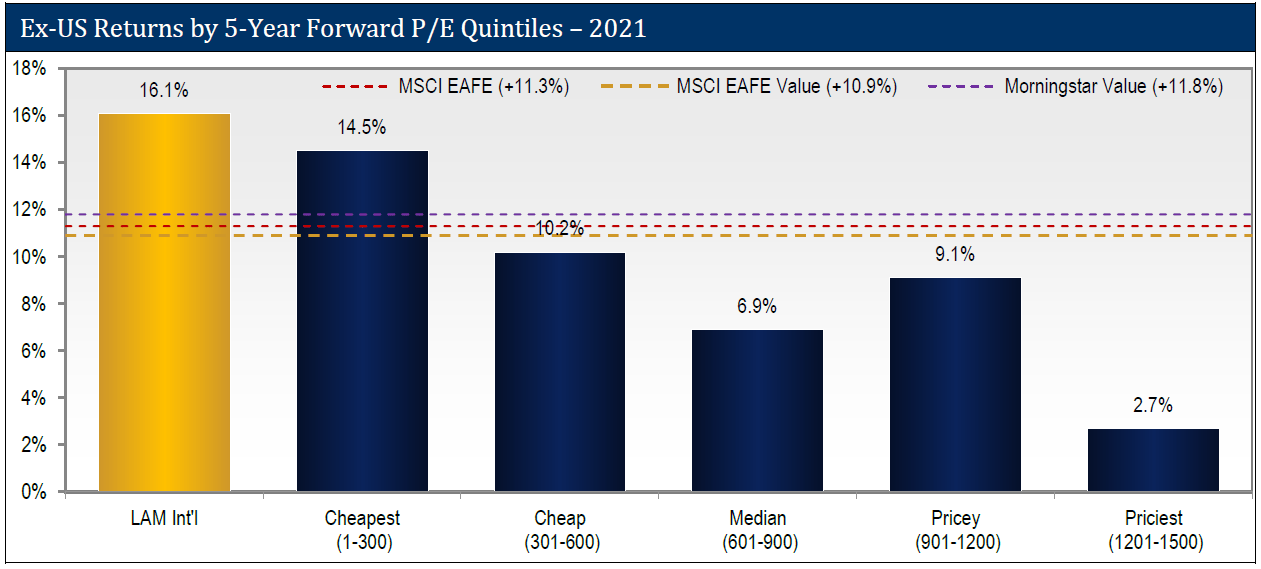
Growth stocks have been in favor for so long, investors might think there was something wrong with the market in 2021, with the priciest stocks realizing the worst returns. To us, there is nothing unusual about this trend, as the outperformance of expensive stocks is historically rare, only having occurred in periods like 2018-2020 and the tech bubble of 1998-1999. For most of history, the norm has been higher returns for lower P/Es and lower returns for higher P/Es.
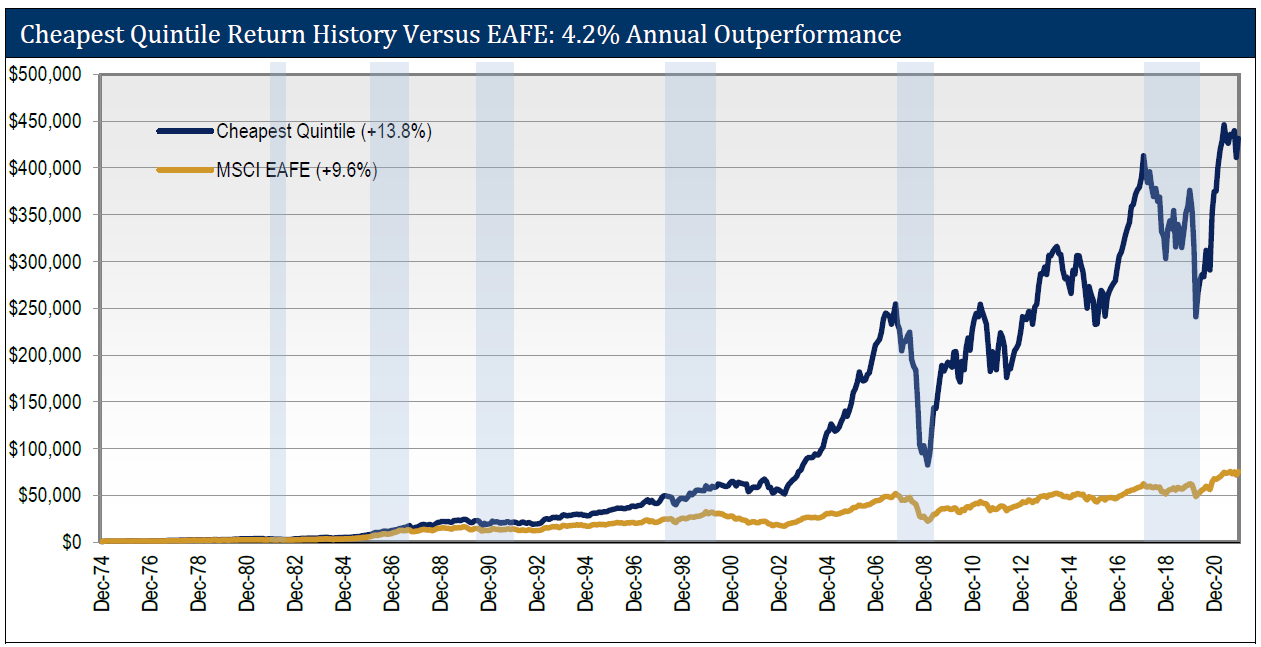
We believe this is just the beginning of value’s outperformance. Looking back over the past 47 years in ex-U.S. stocks, we find that the cheapest quintile outperformed by more than 400bps per year and about 80% of the time as shown below. Our hunting ground has gone through several rough patches—six periods since 1975 shaded in the chart below—but each of those periods presented a compelling opportunity to buy value. We’re about one and a half years into the current upcycle, and history suggests there are many more years to go.
Return Of Inflation
Until 2021, it had been more than 25 years since we last saw a period of high inflation. The European Central Bank’s (ECB) main task is to maintain price stability, defined as a 2% inflation rate. The ECB’s key measure of inflation, the Harmonized Index of Consumer Prices (HICP) has now been running above 2% since May 2021, most recently reaching 5% in December.
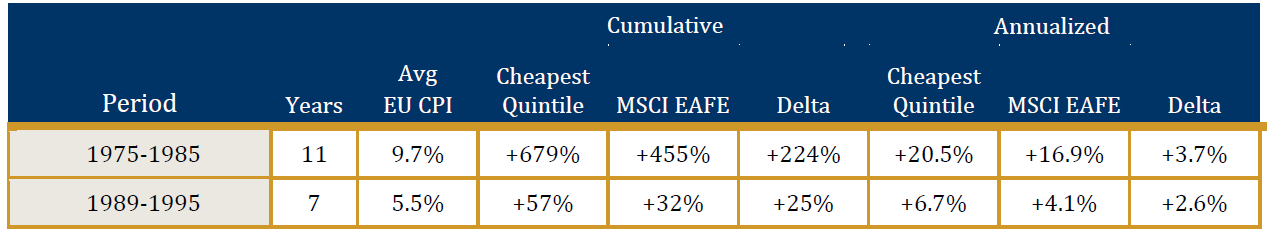
Since it has been such a long time since inflation was a factor, we examined historical data to analyze the performance of value stocks during periods of inflation. Since 1975, there have been two distinct periods of elevated inflation in Europe. As shown in the table below, in each of those periods, value stocks (defined as the cheapest quintile) outperformed the EAFE, including 11 years of 3.7% alpha for value stocks during the “Great Inflation” period of the 70’s and 80’s when CPI was stuck near 10%.
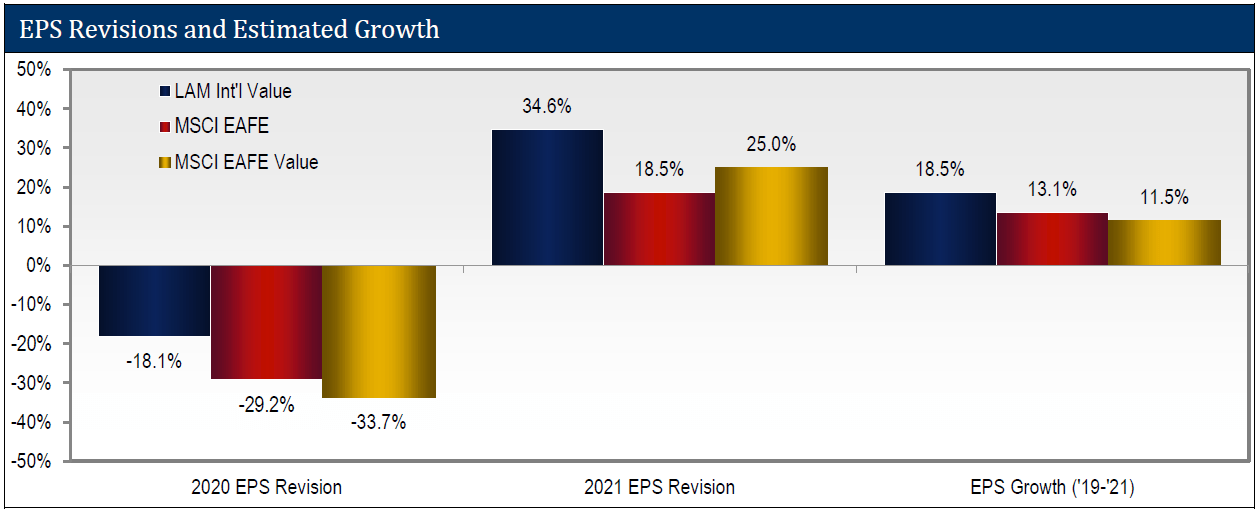
While value stocks in general have a history of outperformance in inflationary times, it is the quality of our companies that gives us confidence in this environment. We have seen the impact of eight months of inflation so far and, on average, our companies have been able to mitigate or benefit from the inflationary effects. Since May 2021, our portfolio’s consensus 2021 and 2022 EPS estimates have been revised up 20% and 11.6% compared to 7.6% and 2.4% for the EAFE. Let’s take a closer look at how our companies have managed this environment.
In an inflationary period, it is important for a business to have pricing power. Without pricing power, rising costs will squeeze the margins of a business that cannot pass along those costs to customers. The companies we are invested in possess several forms of pricing power. Some can increase prices because they provide critical products that represent a small portion of total cost for their customers. We own SK Kaken, which controls more than 50% of the architectural paint market in Japan. The quality of paint determines the strength and permanence of the coat, but the paint itself only represents about 15% of the cost of a project. As such, contractors choose paint based on brand and technical capability rather than price. SK Kaken has grown its earnings at a 9% rate since 2000 and trades for only a 13x forward P/E, before giving the company credit for the 103% of its market cap that it holds in net cash. Yes, it trades for less than net cash!
Other companies we own derive pricing power from dominant local positions. Air Water is a top Asian provider of industrial gas distribution, delivering and managing dangerous gases for their customers. When Air Water signs a new customer, they co-locate onsite with 15 to 20-year contracts with full raw material cost pass-throughs and take-or-pay clauses that guarantee a minimum level of revenue each month. Air Liquide and Linde operate the same business in Europe and the U.S. with similar growth rates and yet trade for more than 24x earnings compared with Air Water at only 9x. This bottom-up perspective along with the historical data lead us to believe inflation should be a positive factor for us.
Follow The Fundamentals
Having managed our portfolio through the COVID crisis, we now have strong evidence that our portfolio is less economically sensitive than the market with better full-cycle growth, despite a much cheaper valuation. The cheapest stocks in the market from which we pick our investments tend to be cyclical and slower growing. We saw this during the COVID crisis, when the EAFE Value’s earnings fell 29% in 2020 before rebounding 57% in 2021 for a combined growth of 11%. The EAFE did better, down 23% and then recovering 47% (+13%). We outperformed both and by a wide margin. Our portfolio earnings fell only 18% in 2020 before rebounding 45% in the recovery for a total of about 18%. That’s seven percentage points faster growth than the value index and five percentage points better than the EAFE.
Let’s look beyond the aggregate data to examine two examples of companies managed well through this tumultuous period.
Highlighted Holding: TFI
Our first example is TFI International Inc (NYSE:TFII), one of our best fundamental performers over the last two years. TFI grew earnings 6.5% in 2020 followed by 47.5% growth in 2021, resulting in aggregate growth of 57%. When we bought TFI in August 2019, the company was valued like a commodity transportation business with a forward P/E of only 9x. We instead saw a specialty transportation and logistics business with a long history of generating high-teens returns on capital, led by a cash-obsessed owner-operator.
The majority of TFI’s trucking business provides specialty transport for items like volatile chemicals. This business comes with high barriers to entry from scale, relationships, and expertise. In 2020, TFI benefited from the leadership of CEO Alain Bedard, who owns about 5% of the shares. While sales fell 11% during COVID, Alain moved quickly to cut costs, resulting in 300bps of margin expansion and overall EBITDA growth of 7% in the year. The company used downtime during the downturn to make positive structural changes to the business that are difficult to complete in a normal operating environment. As Alain put it, “No one wants to miss a storm.”
In 2021, we saw the company again be opportunistic as TFI acquired an underperforming less-than-truckload business from UPS for $800 million, just 0.2x revenue. This business had been operating at breakeven under UPS, but TFI thinks this is the result of mismanagement rather than structural issues. By acquiring this asset so cheaply, TFI managed to nearly double its sales, while barely increasing leverage. This deal couldn’t have been timed any better; TFI made this acquisition in January of 2021, just before the transportation market tightened, leading to unusually good pricing. These firm pricing conditions give us even more confidence TFI will hit its margin target of 10% for the acquired assets, and indeed they are already well ahead of plan. We expect this deal to be 50% accretive to EPS by 2023. Even with the stock outperforming the EAFE by about 260% since our purchase, we see 25% upside to intrinsic value from the current price.
Highlighted Holding: Element
Not every stock in our portfolio has exceled over the past two years. One company that has struggled is Element. It was one of our worst fundamental performers in 2020-2021, with a 15% earnings decline. Element Fleet Management Corp (TSE:EFN), like TFI, is in the logistics industry and is the leading commercial vehicle fleet management business in North America. It handles all aspects of managing a vehicle fleet, so customers can focus on its core competencies. The company provides a critical service to a fragmented customer base, with no more than 3.5% exposure to any one specific industry. In total, Element serves over 5,500 clients, including Amazon, in over 700 industries, such as telecom services, electric utilities, pest control, and pharmaceutical delivery. Element’s outsourced services are sticky, recurring, and easy to understand. The nature of the company’s relationships with clients translates into high switching costs and very low turnover and a 98% retention rate. 60% of Element’s industry is still insourced despite the clear benefits of leasing from a scale player like Element. We see long-term secular growth for a durable business that generates a mid-teens ROE.
Part of why we like Element is its low cyclicality, and in this area the company shined in 2020 with earnings falling only 1.2%. The company has very low credit risk – both from residual value exposure and customer default risk. In North America, it takes no residual value risk on the assets it manages, including those on its balance sheet. Any asset gains or losses are contractually passed through to the client, creating a predictable and stable earnings stream. With respect to customer default risk, even in the company’s worst years, during the Global Financial Crisis, Element realized just 10 bps of annual credit losses (as a percent of finance receivables).
Element held up well in the crisis, but then lagged in the recovery with earnings falling another 3.5% in 2021. In the near-term, Element is a victim of challenging auto supply chains. Demand for the company’s services is higher than it’s ever been, but the company simply can’t buy enough vehicles to fulfill its record backlog. We see this as a temporary setback. As the supply chain loosens, we expect the company to work through its backlog and for free cash flow to improve by close to 40% over the next two years. We see more than 50% upside to intrinsic value, with the stock trading below 6x its five-year-forward earnings power.
Long-Term Thinking Is Our Edge
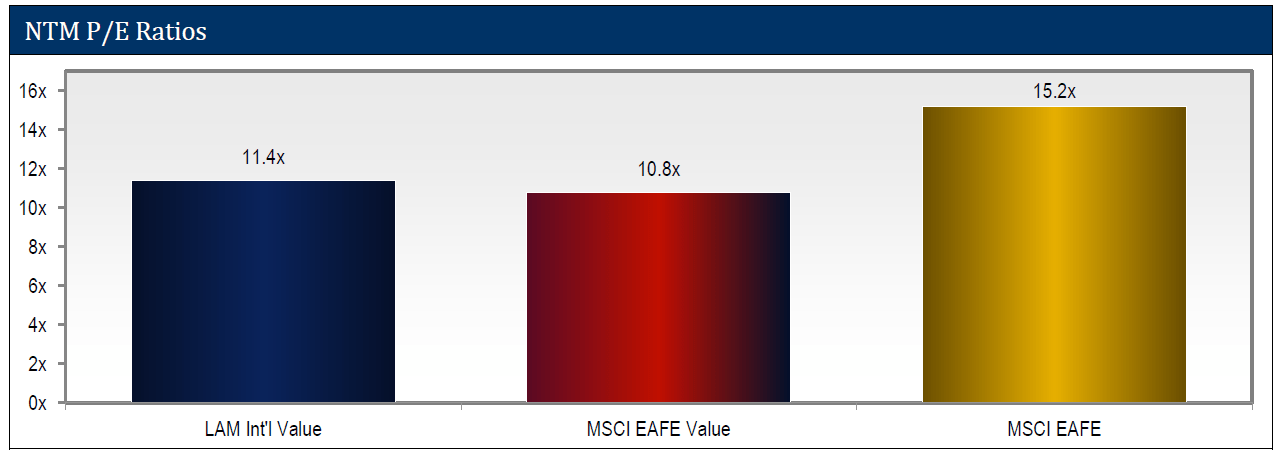
We believe our biggest advantage is our long-term time horizon, which is reflected in how we value companies. We measure long-term earnings, seeking to buy the cheapest stocks based not on their one-year earnings but on their five-year forward earnings. We seek to maximize long-term value and because of that our near-term multiples might not always be as cheap as the indices. As shown below, while our portfolio trades at a big discount to the MSCI EAFE, it trades at a slight premium to the MSCI EAFE Value Index (based on 12-month forward P/E).
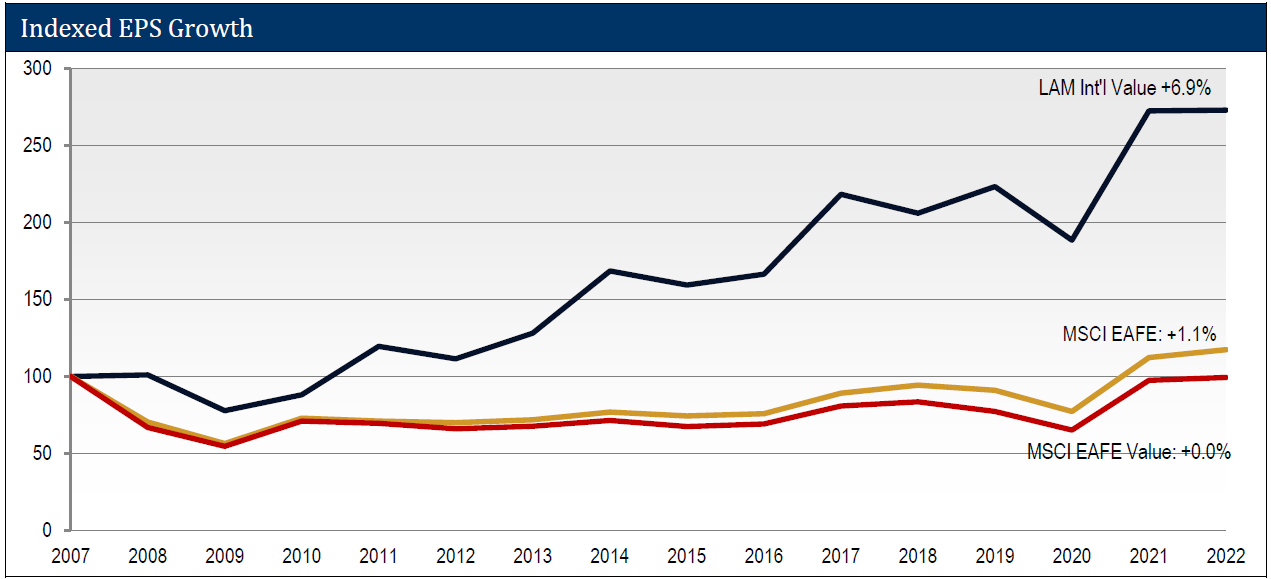
But forward P/E is only part of the story. Many low P/E stocks have flat or declining earnings. This is especially true in international markets where large banks and cyclical business make up a large chunk of the cheapest quintile. Businesses with low P/Es, but with flat or declining earnings are not cheap; they are expensive. This is why we are highly selective within the cheapest quintile of stocks, seeking to only buy simple-to-understand, high-quality, and growing businesses. The result is that our portfolio has had superior earnings growth, compared to both the MSCI EAFE Index and the MSCI EAFE Value Index. As you can see below, the companies in our portfolio have generated 6.9% EPS growth, annualized, going back to 2007 (including two economic recessions). That is significantly above the 1.1% for the MSCI EAFE Index and 0.0% for the MSCI EAFE Value Index.
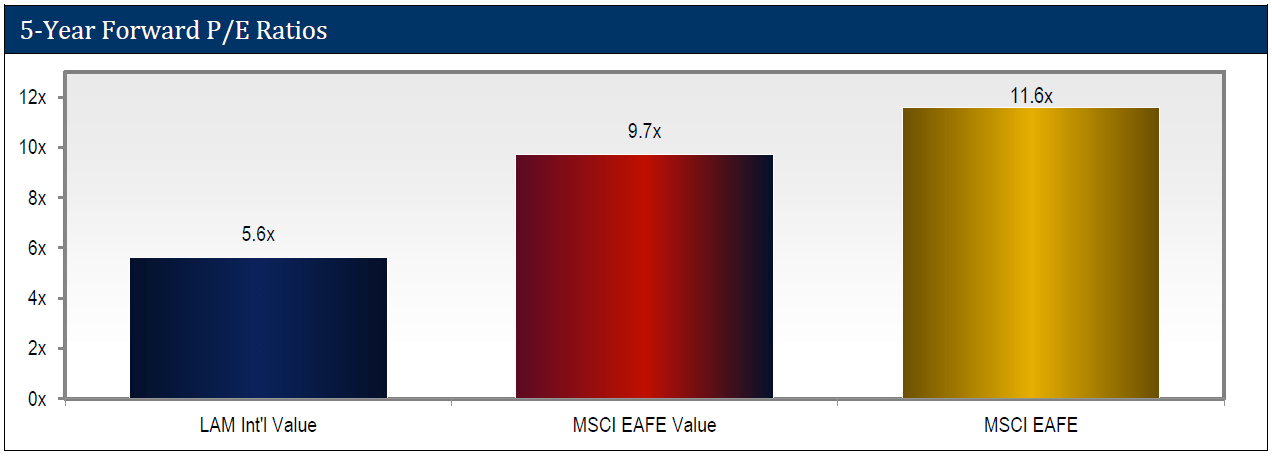
Because of that growth, on a long-term basis our portfolio is even cheaper. As shown below, our portfolio trades at only 5.6x our estimate of five-year forward earnings, a ~50% discount to the slow-growth EAFE Value. We believe it’s this uncommon combination of value and growth that drives strong and sustainable returns to our clients, well above what near-term value factors can achieve.
Conclusion
We had a good year, beating both the EAFE and EAFE Value Indices by around 500bps, and we continue to think we are still in the early stages of a value upcycle. Historically, value upcycles have lasted six years on average and the past three upcycles have each been between seven to nine years long. The current cycle started in June 2020, so we think there is plenty of runway ahead.
We have now outperformed the MSCI EAFE by 900bps and the MSCI EAFE Value by 2,450 bps since inception, and in May we will have a full three-year track record. We feel good about that performance, but we think the best is yet to come. We have yet to see such a good combination of value and growth in the portfolio, and the upside in our portfolio—more than 75% by our estimates—is near the highest we’ve seen.
The COVID shutdown and recovery gave us strong evidence of our ability to select good, resilient businesses within the cheapest quintile. The stocks we own were more resilient in the shutdown and showed better strength in the reopening: outgrowing the EAFE earnings over 2020-2021 by five percentage points despite trading at a significant discount.
As bottom-up stock pickers, we will continue to focus on the micro and select companies that perform well in any macro situation. That said, if we’re entering a period of sustained inflation, we won’t protest. History suggests value is the place to be in such an environment, and we feel strongly the fundamentals of our businesses will hold up if pricing continues to surge.
Looking forward, we anticipate strong returns both absolute and relative. Our portfolio trades for about half of the MSCI EAFE on a longer-term basis, and we see one of the highest levels of upside since our launch.
We thank you for your confidence, and, as always, we welcome your inquiries.
John Mullins & Dan Kaskawits
Co-Portfolio Managers
Lyrical Asset Management


