
Stanphyl Capital commentary for the month ended January 31, 2022.
Q4 2021 hedge fund letters, conferences and more
Friends and Fellow Investors:
For January 2022 and year to date the fund was up approximately 11.1% net of all fees and expenses. By way of comparison, the S&P 500 was down 5.2% while the Russell 2000 was down 9.6%. Since inception on June 1, 2011 the fund is up 90.4% net while the S&P 500 is up 315.4% and the Russell 2000 is up 176.0%. Since inception the fund has compounded at 6.2% net annually vs 14.3% for the S&P 500 and 10.0% for the Russell 2000. (The S&P and Russell performances are based on their “Total Returns” indices which include reinvested dividends. The fund’s performance results are approximate; investors will receive exact figures from the outside administrator within a week or two. Please note that individual partners’ returns will vary in accordance with their high-water marks.)
The current bear market rally notwithstanding, the biggest asset bubble in HISTORY was blown with the Fed printing $120 billion/month and short-term rates at zero, and anyone who thought that bubble wouldn’t implode with the imminence of NO printing and rates at 2%+ was living in fantasyland. (In all fairness though, I thought “fantasyland” would end a lot sooner!) Thus, our short positions in ARKK and Tesla worked well for us this month, despite my closing out the ARKK short a bit too early (in the mid-to-high $70s, before it continued into the mid-$60s and then rebounded back to the $70s). However, we were short ARKK since the $140s last year so we certainly caught most of the breakdown of that collection of bubble-stocks. We remain short Tesla and, as usual, later in this letter we explain why.
I also sold much of our gold this month, paring it back to a smaller core position. The Fed’s new hawkishness is spooking both stocks and gold and may continue doing so until the pain of asset price declines hits Powell’s “put” (wherever that is), at which point he’ll stop raising rates regardless of where inflation is, and gold will fly again.
Although later this year it’s possible that the combination of a slowing economy and a high “base effect” will bring CPI down to the 4% range from its current 7%, that figure would still be massively inconsistent with the Fed’s currently anticipated policy, which is why we still own that “core” gold position. Even at today’s absurdly low rates the interest on the nearly $30 trillion in federal debt costs around $400 billion a year. Does anyone seriously think this Fed has the stomach to face the political firestorm of Congress having to slash Medicare, the defense budget, etc. in order to pay the higher interest cost created by significantly raising those rates to a level commensurate with 4% inflation? Powell doesn’t have the guts for that, nor does anyone else in Washington; thus this Fed will be behind the inflation curve for at least a decade, and when the market is closer to realizing that I’ll re-up our gold position.
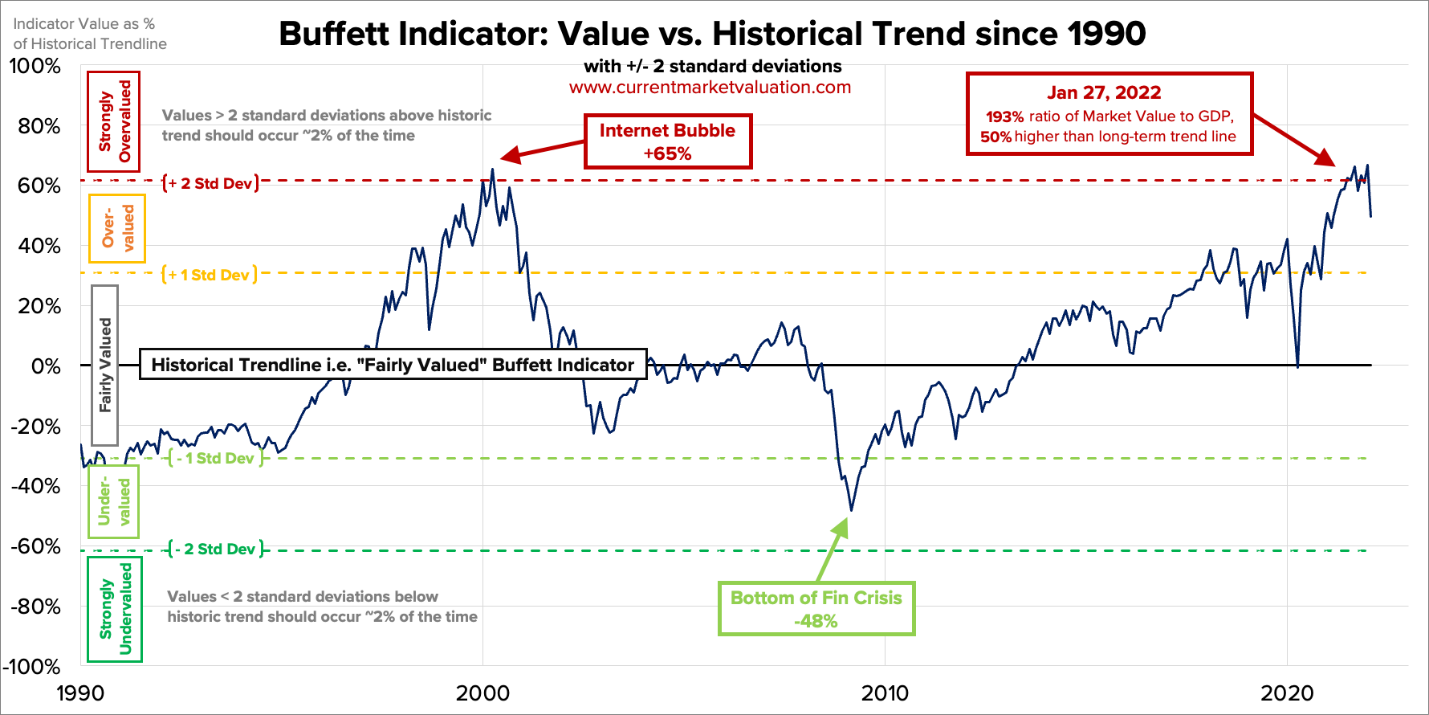
The Buffett Indicator
Meanwhile, although (as noted earlier) stocks may be a bit short-term oversold, I believe they’re entering a bear market thanks to the aforementioned combination of PE ratio-crushing inflation and Fed tightening. From CurrentMarketValuation.com we can see that despite January’s correction and even before the month-end bounce, the U.S. stock market’s valuation as a percentage of GDP (the so-called “Buffett Indicator”) was astoundingly high, and thus valuations have a long way to go before reaching “normalcy”:
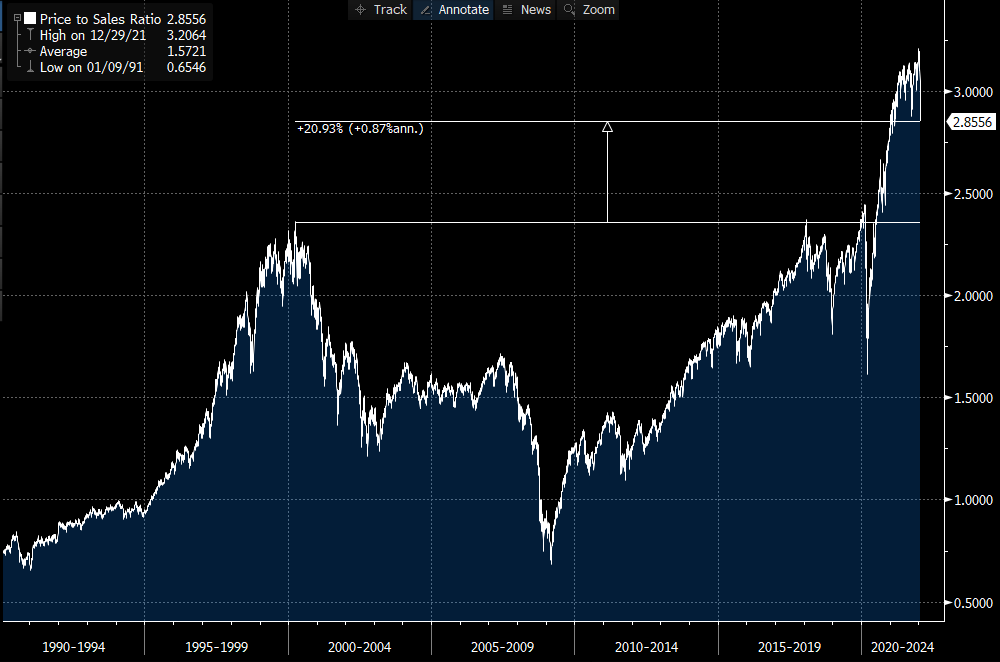
And courtesy of Callum Thomas we can see that the same applies to the S&P 500’s price-to-sales ratio which, following today’s bounce, is even higher than this:
When stocks get meaningfully cheaper I’ll be an enthusiastic buyer; meanwhile the fund has the least amount of equity exposure (long or short) it’s had in years.
Portfolio Update
Here then is some additional commentary on some of our positions; please note that we may add to or reduce these positions at any time…
NuScale Power
We continue to hold a long position in NuScale Power, which is going public in the first half of this year by merging into a SPAC with the (temporary) ticker SV. I believe that the world will soon acknowledge that the only practical way to decarbonize is via nuclear power, and NuScale designs small modular reactors (SMRs) using passive safety that have the only design (so far) approved by the Nuclear Regulatory Commission. This is a capex light company (it provides only engineering services), and although the first reactors in the pipeline won’t come online until the end of this decade, the cash flow begins much sooner as the company is paid as construction progresses. At a pro-forma enterprise value of just $2 billion with great strategic holders and (according to management) enough cash on hand to become cash flow positive, I believe this is an interesting speculation in a very “sexy” story, with the added advantage that before the merger vote the price should have a floor of around $10 as that’s where holders are permitted to redeem their shares, thereby making this trade rather asymmetrical for at least the next couple of months. In fact, if the stock doesn’t move up before the vote I’ll likely redeem a chunk of the position and keep a lesser, core amount. Here’s the company presentation.
Volkswagen
We continue to own a long position in Volkswagen AG (OTCMKTS:VWAPY) (via its VWAPY ADR, which represent “preference shares” that are identical to “ordinary” shares except they lack voting rights and thus sell at a discount). Volkswagen controls a massive number of terrific brands whose EVs (several of which are more technologically advanced than any Tesla) combine to outsell Tesla in Europe and by late 2023 should match Tesla’s EV sales in China. This is from January’s corporate press release:
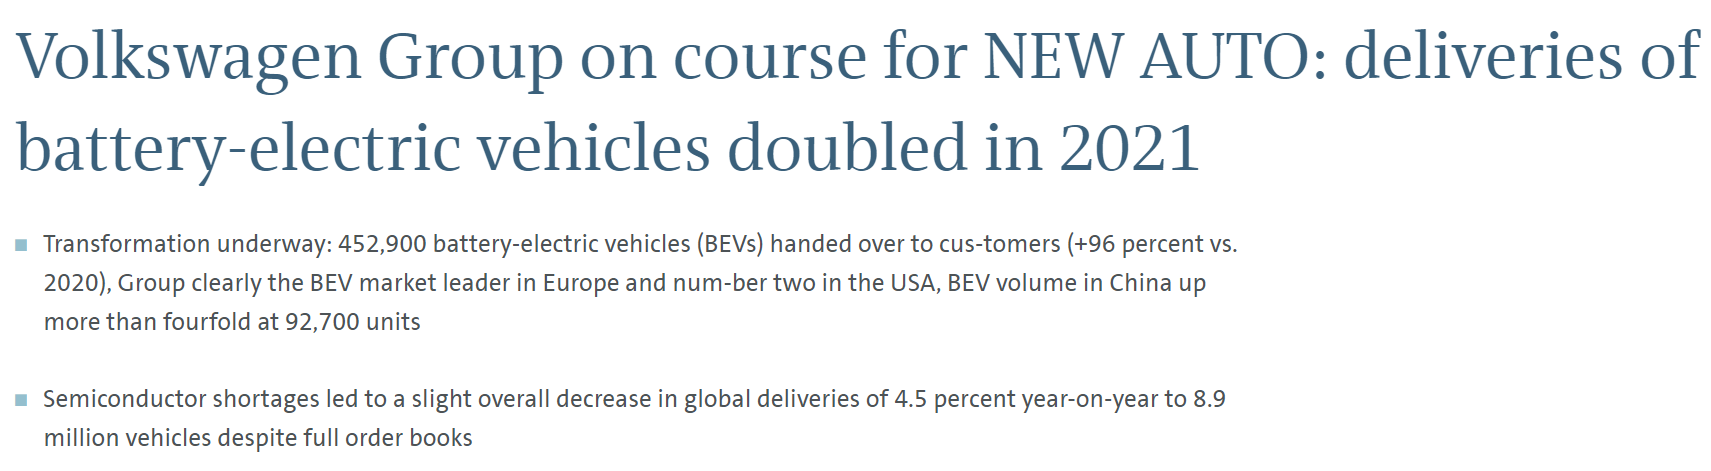
In total (without chip shortages) VW sells nearly 10 million vehicles a year vs. around 1.2 million a year for Tesla Inc (NASDAQ:TSLA). Yet Tesla’s diluted market cap is over 8x VW’s, meaning that an investor pays around 70x as much for each Tesla sold as for each VW sold! And VW sells for less than 6x estimated 2022 earnings!
General Motors
We continue to own a long position in General Motors (NYSE:GM), which currently sells for less than 8x 2022 earnings estimates. GM is doing all the right things in electric cars, autonomous driving (via its Cruise ownership) and software, yet it’s extremely cheap because, as with other established automakers, investors have (for now) forsaken it in favor of “electric car pure-plays,” a sector which has thus become the largest valuation bubble in history. You can read an outline of GM’s future plans (given at an investor day in early October) in this press release. And regarding “autonomy,” keep in mind that unlike Tesla, which sells a LiDAR-less fraud to rubes, Cruise is already running a fleet of fully autonomous cars in San Francisco; you can see many videos of this on its YouTube channel.
I thus consider these positions (GM and VW) to be both “freestanding value stock buys” and “relative value paired trades” against our Tesla short.
Thanks,
Mark Spiegel


