October 22, 2020 Weekly COVID-19 Lab Testing Insights from hc1- Positive Test Rates Increase while Testing Volume Declines

Q3 2020 hedge fund letters, conferences and more
The CV19 Lab Testing Dashboard™ powered by hc1 provides local lab testing insights that include state, county, and sub-county views of Local Risk Index, COVID-19 testing rates and results, and key demographic filters for those tested (age, gender). Data used in the dashboard comes from more than 20,000 lab ordering locations from a coalition of laboratories performing up to 40% of the nation’s laboratory testing.
Summary
- Viral PCR and Antibody Serology testing volumes were down this week.
- Percent positivity rates were 12% for antibody testing and ~6% for Viral PCR testing.
- hc1 Local Risk Index trends show rising risk for infection in Alabama, Arizona, Ohio, Kentucky, and Michigan.
- Wisconsin is back for a second week with two counties on the hc1 Local Risk Index Top Counties.
- To access the hc1 CV19 Lab Testing Dashboard, register for free at www.CV19Dashboard.org.
- An index of Weekly COVID-19 Lab Testing Insights can now be accessed at https://www.hc1.com/covid-19-weekly-insights/
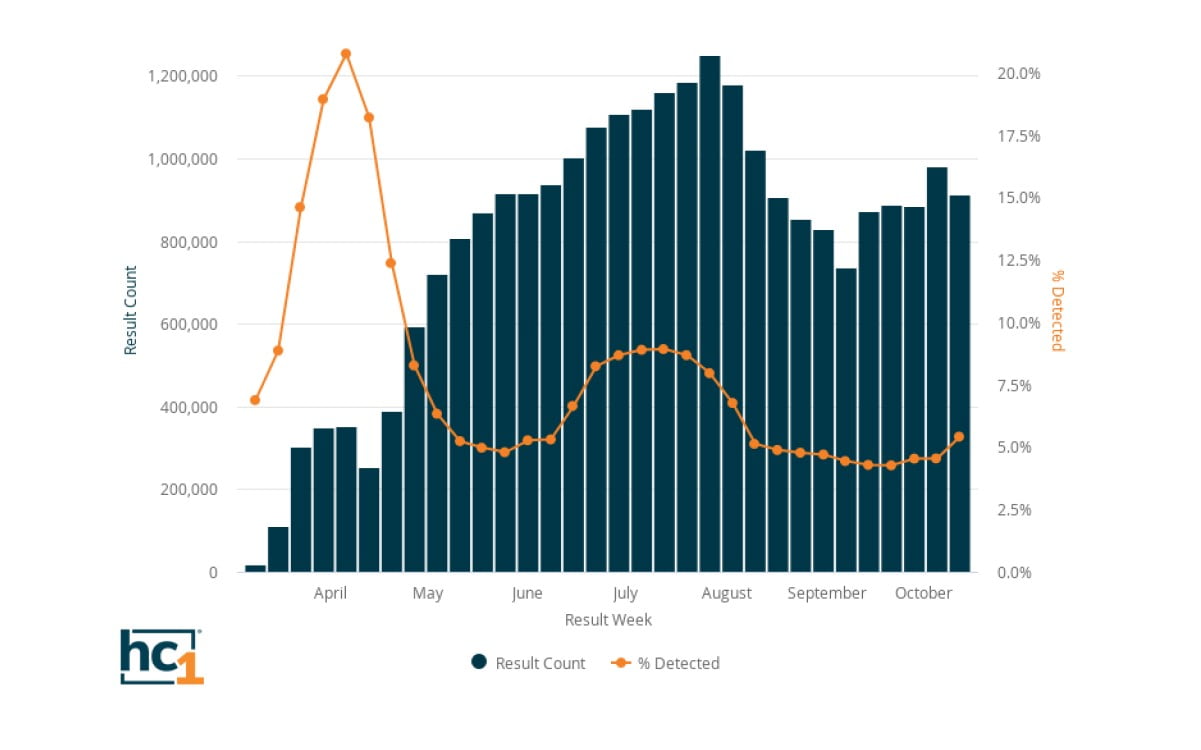
As of October 22, 2020, the national percent positivity rate for COVID-19 Viral PCR testing increased to about 6%, and testing volume decreased for the fourth consecutive week. This can be seen in the following chart showing the weekly national trend in SARS-CoV-2 Viral PCR testing volume and % detected rate among the hc1 CV19 Coalition of Laboratories, which represents approximately 40% of all CV19 testing nationwide.
Antibody Serology Testing
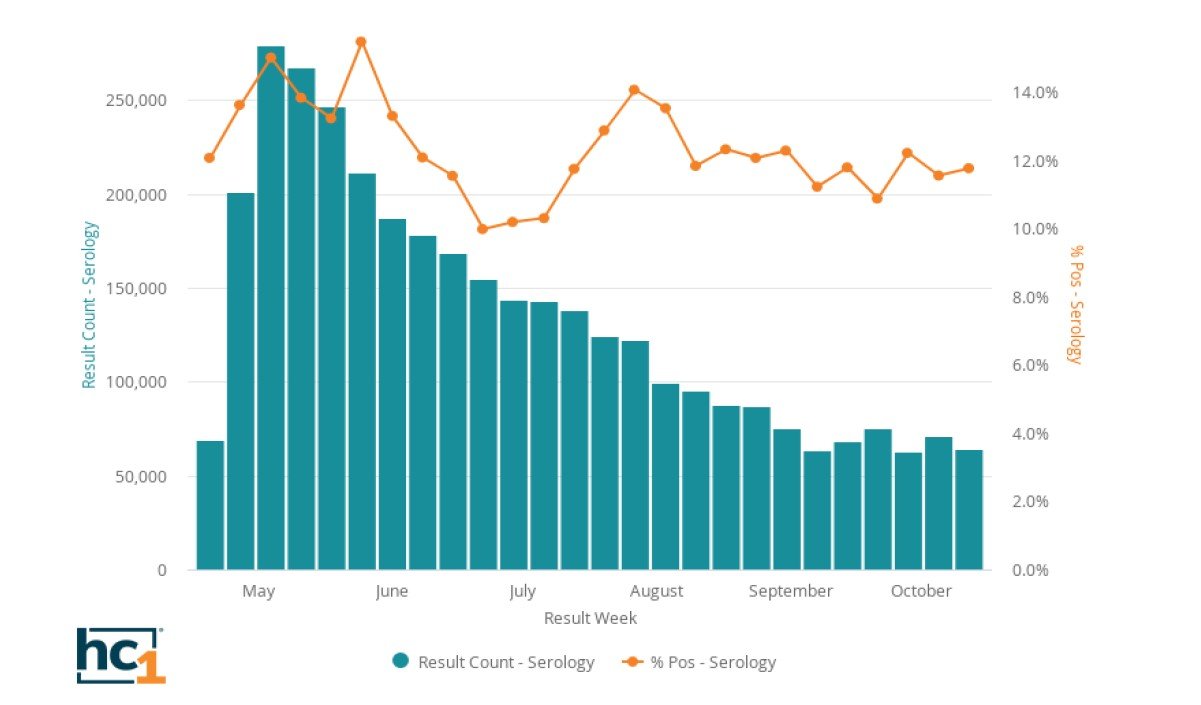
The weekly national trend in SARS-CoV-2 Antibody Serology testing volume and % detected rate, as shown in the following chart, shows testing volume dropped slightly this week. It remains low in comparison to viral testing volume. After a slight decline last week, percent positivity was back up to 12%.
hc1 Local Risk Index
The hc1 Local Risk Index trends for the week of October 19 show rising risk for infection in several states, notably Alabama, Arizona, Ohio, Kentucky, and Michigan. Back for a second week with counties on the list of Top 10 counties with the largest magnitude of change in infection rates over last week, as determined by calculating the LRI x ‘7vs7’ rate* are Illinois, Georgia, Texas, and Wisconsin. The latter has two counties in the Top 10. Rounding out the list are counties in Ohio, Tennessee, Vermont, and Oklahoma. (Dr. Peter Plantes offers deeper insights into each week’s hc1 Local Risk Index Top Counties here: https://www.hc1.com/blog/tag/covid-19/.)
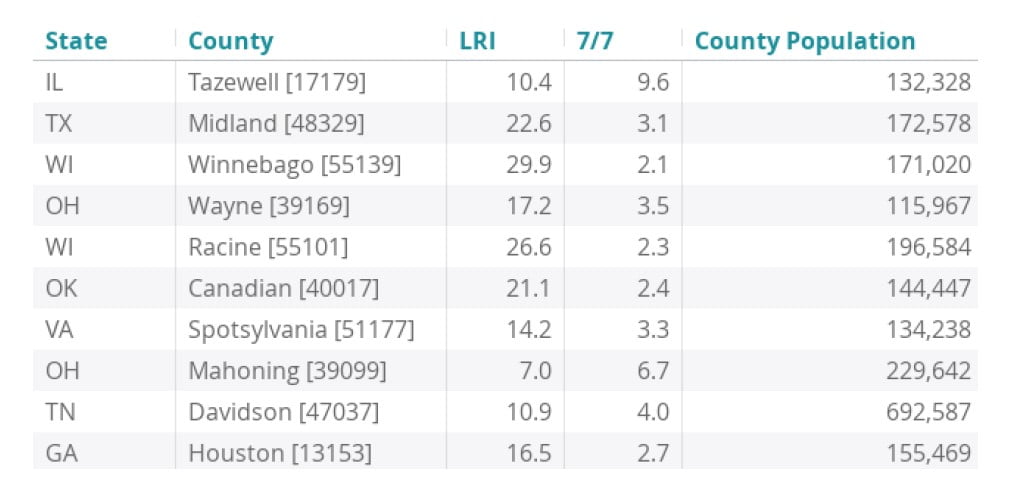
Criteria for Top Counties:
- A population greater than 100,000
- More than 100 COVID-19 viral tests performed in the past week
- An hc1 Local Risk Index™ greater than 7
- An acceleration factor of LRI equal to or greater than 1.5
For a community of 100,000, a rapid rise in the presence of positive COVID-19 viral testing is the earliest indicator that ER, hospital, ICU, ventilators, and other medical resources (clinical providers, PPE, facilities, etc.) will be heavily taxed in the next 10 to 21 days. The community that has the largest acceleration in positive tests week-over-week will see the fastest rise in the magnitude of COVID-19 cases.
* This brief video provides an explanation of how to utilize the LRI to track specific regions.