
Summary
- There is a change in Cummins Inc. (NYSE:CMI) (CMI or the Group) business direction from diesel engines to electric and hybrid powertrains. This would give CMI a different growth trajectory.
Q2 2021 hedge fund letters, conferences and more
- The powertrain market is a much bigger market than that for diesel engines or generators. This would provide CMI a longer return and growth runway.
- CMI is fundamentally strong would a good track record of revenue and earnings growth. Over the past decade, it had performed better than average compared to its peers.
- I valued CMI at USD 301 per share based on a 2-stage growth model. There is a 32 % margin of safety at its current market price.
Investment Thesis
From 2018, CMI amended the way it described its business in its Form 10k.
- 2017 – “…diesel and natural gas engines and engine-related component products…”
- 2018 – “…diesel and natural gas engines and powertrain-related components…”
- 2019 and 2020 – “…diesel, natural gas, electric and hybrid powertrains and powertrain-related components…”
I would conclude that CMI’s business direction has changed. It has not only positioned itself to cater to different energy sources ie from diesel and natural gas to electric and hybrid. But it has also broadened its product mix from engines to powertrains. Both of these set CMI on a different growth trajectory.
Over the past few years, its acquisitions were focused on strengthening its expertise in these new fields. At the same time, from 2012 CMI began acquiring the shares of the North American distributors that it did not own so that currently it owns them.
CMI is fundamentally sound with a good profit track record. It has performed well relative to its peers. These are traits that will enable it to be profitable in the new business direction.
I believe that the market price does not reflect these prospects. At the current price of around USD 228 per share (23 Sep 2021). there is a sufficient margin of safety.
Rationale
- CMI had good revenue and net income growth track record. If we excluded the 2020 pandemic year, revenue grew at a 6.6 % CAGR from 2010 to 2019 while net income grew at 7.9 % CAGR.
- It has achieved an average ROE of 23 % from 2010 to 2020. This is significantly above its cost of equity that was estimated as 8.4 %. The best return was achieved by the Components segment – this segment would be the main driver for CMI entry into the powertrain business.
- On the basis of revenue growth and ROA, CMI performed better than average when compared with its peers.
- CMI is financially sound. It has a Net Debt to Equity ratio of 0.2 as of mid-2021.
- The powertrain market is much larger than the diesel engine or generator markets. This should provide CMI with a longer growth runway.
- I estimated that CMI had a Conservative Earning Value of USD 231 per share. This was based on a single-stage growth model. A valuation based on an Optimistic scenario based on a 2-stage growth model resulted in USD 301 per share.
- While there is no margin of safety under the Conservative scenario, there is a 32 % margin of safety under the Optimistic scenario. I believe that the Optimistic scenario best represents the prospects of CMI.
Supporting Details
The details to support my rationale are presented below. I have organized them in line with the sequence of the rationale.
Top-line And Bottom-Line Growths
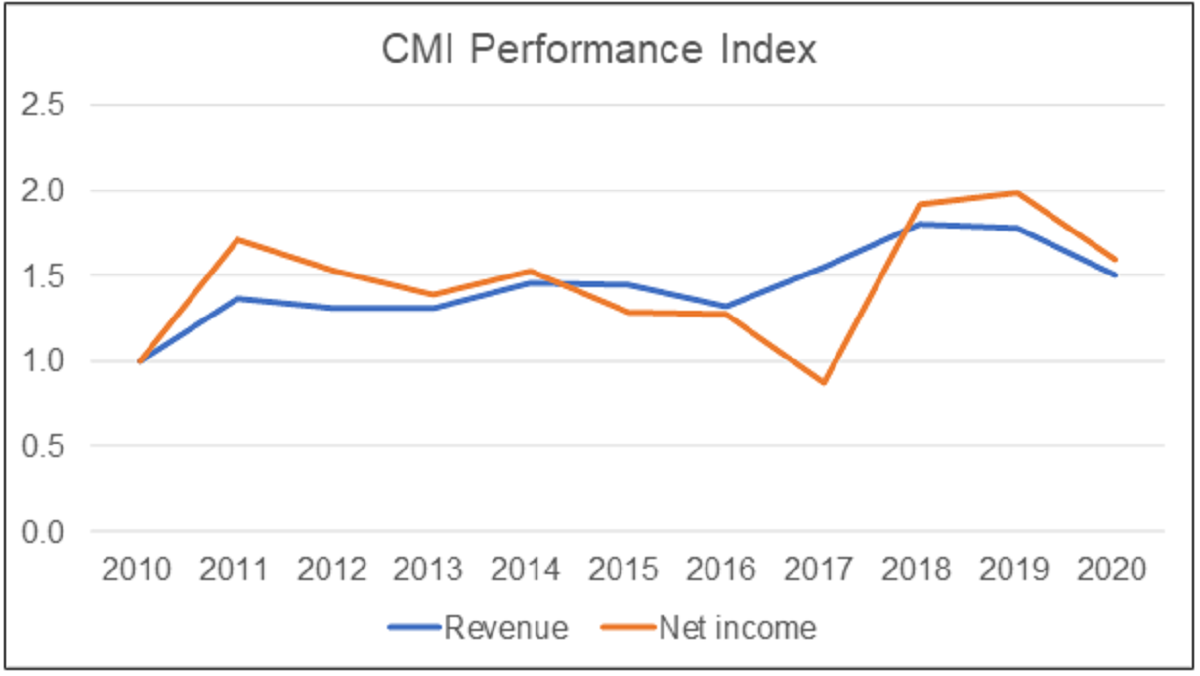
In the first half of FYE 2021, the Group achieved revenue growth of 38 % and net income growth of 53 % compared to those for the same period last year.
The half-year results are in line with the long-term trend as can be seen from the Performance Index chart. Here I plotted the values from 2010 to 2020 relative to the respective 2010 values. There were jumps in revenue (greater than 10 %) in 2011, 2014, 2017, and 2018. At the same time, there were significant changes in PAT in 2017 and 2018.
- Except for 2014, the improved revenue in 2011, 2017, and 2018 was due to an increase in demand for all the segment products. But a large part of the increase in 2014 was due to CMI acquisitions of its North American distributors.
- The drop in PAT in 2017 despite an increase in revenue was due mainly to a one-off USD 777 million tax adjustments. The rebound in PAT in 2018 was partly due to increased sales and gross profit margins and without the 2017 tax impact.
Good Returns Where It Matters
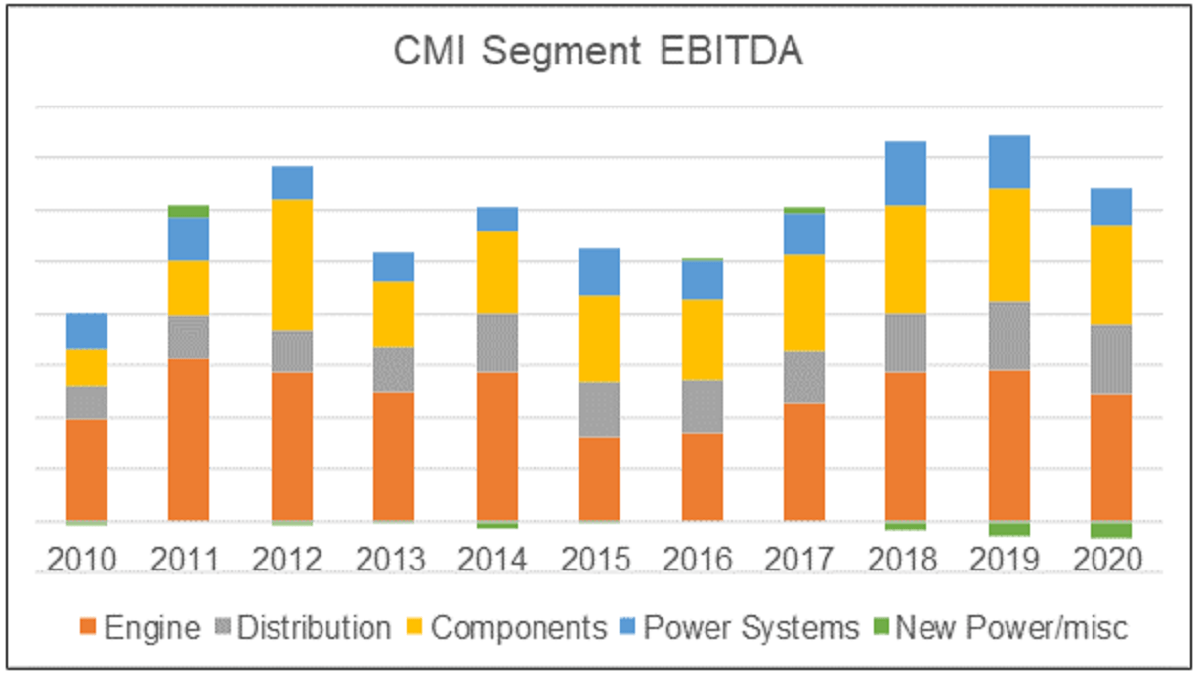
Over the period from 2010 to 2020, CMI achieved an average ROE of 23 %. An analysis of CMI EBITDA by business segments from 2010 to 2020 showed that
- The largest growth was by the Components segment with 10.4 % CAGR.
- The next best was by the Distribution segment with 10.4 % CAGR.
A powertrain is an assembly of every component that thrusts a vehicle into motion. It includes engine, transmission, driveshaft, axles, and differential. A powertrain system is one of the main components of a vehicle. It would appear that to serve the powertrain market, CMI would have to rely on its Engine and Components segments.
The Engine and Components segments were the larger contributors to the Group EBITDA over the past few years as can be seen from the chart. The strong performance by these 2 segments augurs well for CMI entry into the powertrain business.
In 2013 CMI announced that it would acquire all its partially owned US and Canadian distributors over the next 3 to 5 years. CMI actually spent about USD 428 million between 2012 and 2016 to acquire 15 distributors.
I estimated that during the pre-acquisition period the Distribution segment earned an average EBIT of USD 90 million per year. Post-acquisition (2017 to 2020), the average EBIT for North America was about USD 325 million per year. These estimates were based on the North American revenue X segment EBIT margin.
This is of course a back-of-envelope calculation. But it showed that the Group gained about USD 235 million per year from the acquisitions. The amount spend was equal to about 2 years’ payback. No doubt the post-acquisition performance is also due to organic growth. But it does point that it was a beneficial exercise.
Performed Better Than Its Peers
I also compared CMI Revenue growth and ROA with those of its peers – Borg Warner, Caterpillar, Donaldson, Eaton, Navistar, Deere, Paccar and Grainger.
The table summarized the results. I would rate CMI performance as better than average.
| Group | CAGR in Revenue from 2010 to 2020 | Average ROA from 2010 to 2020 |
| CMI | 4.1 %
Ranked No 4 among panel |
8.4 %
Ranked No 3 among the panel |
| Peer excluding CMI | Average of 2.7 %
Range from (0.2%) to 6.2 % |
Average of 6.8 %
Range from 1.4 % to 14.7 % |
Sound Capital Structure
As of the end of 4 July 2021, the Group had a Total Capital Employed (TCE) of USD 13.18 billion. Shareholder’s fund accounted for 60 % of the TCE with the balance from minority interests and debt (including leases).
About 67 % of the TCE has been deployed for the operations. About 19 % of the TCE is in cash compared to the electrical equipment industry average of 5 % (Source: Damodaran Jan 2021.
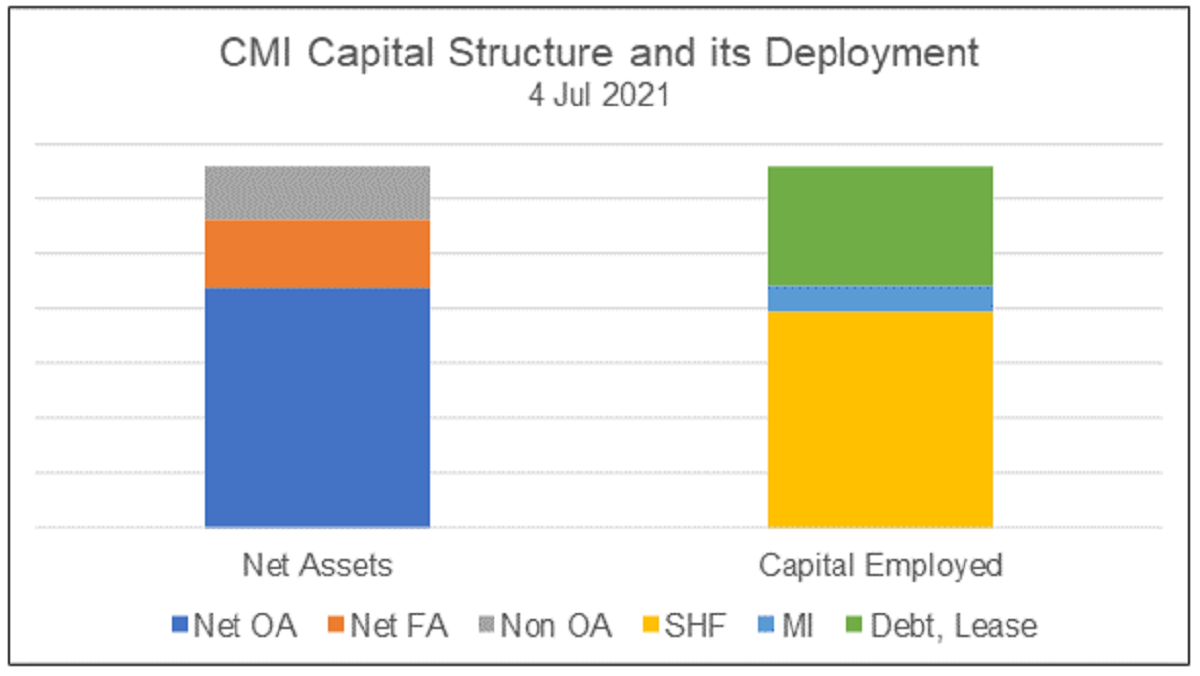
CMI had a book debt to TCE ratio of 33 % compared to the US electrical equipment industry average of 49 % (Industry source: Damodaran Jan 2021.)
But looking at the debt ratio for the Group can be misleading due to its large cash position. When you look at the net debt (debt less cash), the picture is that the Group is still very low geared. CMI Net Debt to equity was 0.1 at the end of 2020. As of mid-2021, it was 0.2
Good Prospects
The analyses point to 2 shifts in CMI business direction
- Expanding its distribution arm
- Changing its product focus away from engines and power systems to powertrains, powertrain components and new power.
This is not to suggest that the diesel engine is in any immediate danger of being disrupted. There is still room for steady growth. However, the bigger market seemed to be in powertrains as illustrated in the chart below.
| Metrics | Diesel engine (a) | Generator (b) | Powertrain (c) |
| 2019/20 Global Market size | USD 207 b | USD 20 b | USD 650 b |
| Global CAGR growth | 4.2 % | 5.7 % | 5 % |
Source
a) IMARC Group
b) Fortune Business Insights. If you are interested, I have a more detailed analysis of the generator market in my article “Is Generac Holdings a growth trap”
When it comes to the powertrain niche, the electric powertrain sector has a more aggressive growth rate. The global electric powertrain market size was valued at USD 72 billion in 2020 and is expected to grow at a CAGR of 33.5% from 2021 to 2028. Grand View Research
Sufficient Margin Of Safety
I valued CMI on the following bases.
- Earning Power Value (EPV) and the Earning Value with growth. For the Earning Value with growth, I had two scenarios – Conservative and Optimistic.
- The Conservative one was based on a single-stage Free Cash Flow to the Firm model with a 4 % growth rate. The growth rate was set to be equal to the long-term US GDP growth rate.
- For the Optimistic Earning Value with growth, I used a 2-stage Free Cash Flow to the Firm model. I assumed 10 years of a high growth rate of 7.4 %. This was CMI’s revenue growth rate from 2017 to 2019. The terminal growth rate was assumed to be 4 %.
The other key assumptions in my valuation were:
- I used the average 2017 to 2019 values as the bases. This is to exclude the impact of the Covid-19 pandemic.
- The cost of capital was derived based on the CAPM. I assumed a 1.9 % risk-free rate and the Beta was built up based on the US electrical equipment sector Beta. The values for the various parameter were taken from Damodaran Jan 2021 dataset.
The results of the valuation are tabulated as well as charted below.
| Valuation metrics | Units | Value |
| Valuation date | 23 Sep 2021 | |
| Price at valuation date: | USD per share | 228 |
| Earning Power Value (EPV) | USD per share | 131 |
| Conservative Earning with growth | USD per share | 231 |
| Optimistic Earning with growth | USD per share | 301 |
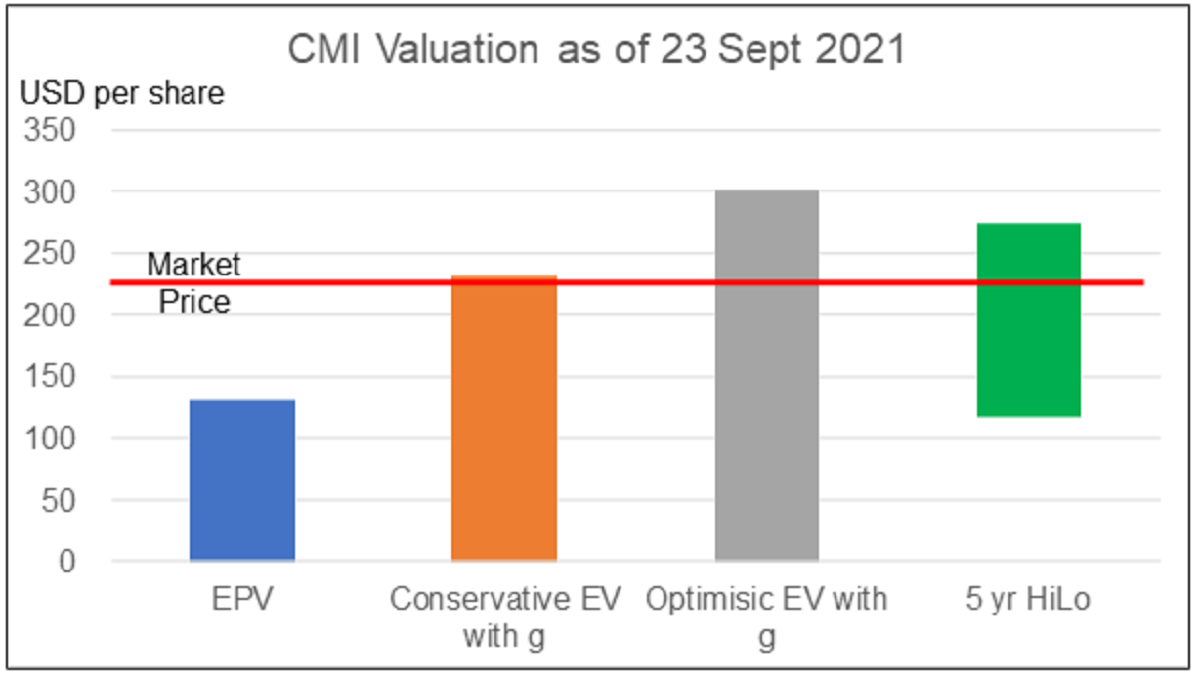
The current price is above the EPV. Thus, the margin of safety would have to come from a valuation assuming growth.
My valuation shows that:
- There is no margin of safety under the Conservative scenario.
- There is a 32 % margin of safety under the Optimistic scenario
Growth Assumptions Are Justified
The above analysis showed that CMI is a buying opportunity only if growth under the Optimistic scenario can be justified. I believe that they are:
- There should not be any concern about the 4 % terminal growth rate. Apart from being the same as the long-term US GDP growth rate, CMI had achieved this growth rate from 2010 to 2020. This is included the 2020 pandemic year. The US average business cycle is about 5 years so you can say that CMI had achieved the 4 % over 2 business cycles.
- CMI had achieved higher growth rates in the past few years. From 2016 to 2017 CMI revenue grew by 17 %. From 2017 to 2018, the revenue grew by another 16%. These are significantly larger than the 7.4 % assumed for the high growth phase.
- The growth for the high growth phase is actually single-digit growth. Normally a growth stock is one with double-digit growth during the high growth phase. I am assuming that CMI is not a growth stock.
There are of course some concerns about the growth assumptions.
I had used the historical reinvestment rates of 23.9 % in my model. This is much lower than the reinvestment rate derived from the fundamental equation of growth = return X reinvestment rate. The Free Cash Flow would be lower if I had used the fundamental reinvestment rate. This in turn will result in a lower valuation.
The global growth in diesel engines, power generators, or even auto powertrains was projected to be around 4 % to 5 % CAGR. This must mean that CMI would gain market share with a 7.4 % growth rate.
While there is potential higher growth in electric products, it would be at the expense of diesel products. I am assuming that despite the cannibalization, the Group would have overall growth.
In spite of these concerns, the 32 % margin of safety should provide some room for error.
Editor’s Note:
The article is from H.C. Eu who blogs at Investing for Value. He is a self-taught value investor and has been investing in Bursa Malaysia and SGX companies for more than 15 years. His value investment experience has been enhanced by both his Board experiences and his contacts with controlling shareholders of many Bursa Malaysia’s listed companies. These have given him a unique opportunity to be able to analyse and value companies differently from other research houses. If you enjoyed this piece, you can find similar pieces and other value investing tips in his blog.


