
For weekend reading, while commennting on the U.S. gross output, Louis Navellier offers the following commentary:
Q3 2021 hedge fund letters, conferences and more
U.S. Gross Output Reached $50 Trillion
The federal government recently debated passing two bills totaling $5 billion in new spending. The good news is that those bills were not passed, due to a rare spasm of common sense tied to the “debt ceiling” debate. The even better news was a release by the Bureau of Economic Analysis (BEA) that total output in the economy (as measured by gross output or GO) reached $50 trillion in 2021 as of June 30, 2021.
That number requires an immediate footnote: The official “GO” figure from the BEA was a record $40.6 trillion, but the BEA omits over $9.6 billion in business-to-business transactions. Dr. Mark Skousen, who helped develop this statistic, adds that back in, reaching $50.2 trillion, calling that the “adjusted gross output” (see the preface to Skousen’s Third Edition of “The Structure of Production” for more details).
GDP should total about $22 trillion this year, less than half of $50 trillion, but “GO” is a measure of ALL spending by businesses, government, and individuals. This much more comprehensive statistical measure of growth is more important because measuring just the consumer half of the economy is misleading.
Unfortunately, the mainstream press keeps repeating the myth of consumer sovereignty, like this:
“The Commerce Department said on Friday that consumer spending, which accounts for more than two-thirds of U.S. economic activity, rebounded 0.8% in August, shrugging off declining motor vehicle sales caused by a global shortage of semiconductors, which is undercutting the production of automobiles.” – Reuters, via Yahoo Finance, October 1, 2021.
When you break down the real growth rate differential between business and consumers, it becomes clear that business-to-business spending is growing faster than consumer spending. In the second quarter of 2021, B2B spending grew at an 11.3% real growth rate, two points better than consumer growth (+9.1%).
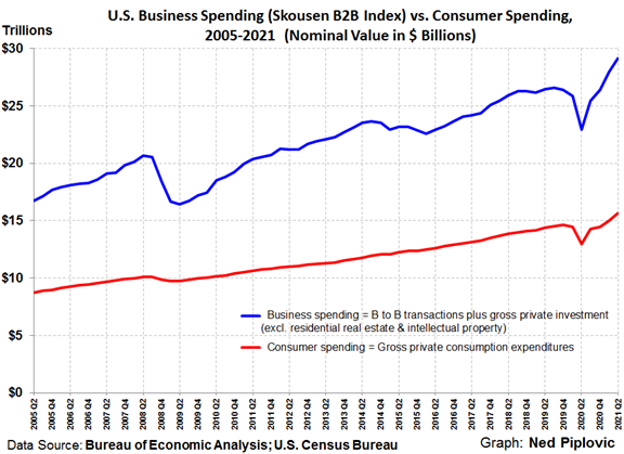
Gross output includes the supply chain, and we all know the supply chain has encountered bottlenecks. Consumers want many products that are in short supply, lying offshore in tankers, so this is building pent-up demand for a wide array of products, but since GDP is over-weighted (70%) into consumer spending, “GO” gives us a clearer picture of business production in providing those goods that are not yet sold.
Other Signs of Growth Should Also Support a Rising Market
Gross output isn’t the only sign of a growing economy in the second half of 2021. Second-quarter S&P earnings were up over 88% (year-over-year), and Argus Research sees full year 2021 GDP growth at 5.7%, so we’re in a situation in which we don’t need so much blather about, “I’m from the government and I’m here to help you,” to which the proper answer might be, “No thank you, we’re doing just fine.”
Looking beyond the political sideshows – which seldom mean much to the stock market after a day or two – the other good news is that the underlying fundamentals continue to be strong. The S&P 500’s forward revenues just hit another record high during the last two weeks in September, according to economist Ed Yardeni. As of the end of September, analysts estimated that S&P 500 operating earnings rose 27% (year over year) in the third quarter, following the 88.6% gain last quarter.
During the upcoming earnings reporting season, we can probably expect the actual results to beat these forecasts, creating some bullish “earnings surprises,” coupled with warnings about more possible supply disruptions hurting future quarters – but then something will happen to break those logjams, too.
For the full year 2021, we’re likely to see 45% earnings growth, and that likely deserves a rising market.
| 2021 Year-Over-Year Earnings Growth (Actual and Forecast, as of September 30, 2021) | |
| Quarter | Percent Gain over 2020 |
| #1: Jan-March | +48.3% (actual) |
| #2: April-June | +88.6% (actual) |
| #3: July-Sept. | +26.9% (forecast) |
| #4: Oct-Dec. | +19.9% (forecast) |
| Source: Yardeni Research (for “S&P Operating Earnings Per Share”: analysts’ consensus estimates) | |
Sometimes, too much of a good thing is never enough to brighten the bears’ sullen mood. Some bulls say we are headed into another Roaring 20s (which followed a major pandemic and a “flash crash” 100 years ago), but the bears counter that we are heading into “stagflation” (stagnation plus inflation) after a long, losing Asian war (Afghanistan=Vietnam) and the end of an impeachable Republican President (Trump = Nixon), like 50 years ago, so an army of bears see this as the 1970s (or 1929, or 1987, or 2008), while the fewer but wiser squadron of long-term bulls look to the last 100 years and say, “Stick with stocks, silly!”
Mark Hulbert recently wrote this about the record of the best market timers in the Wall Street Journal:
“Think back to October 2007. Even though the S&P 500 was about to embark on a 16-month decline of 57%, virtually none of the approximately 100 stock-market timers that my firm monitors were envisioning anything of the sort. This failure was true even for those market timers with the best long-term records coming into that month. One of the top long-term performers at the time was telling clients that a bear market was such a remote possibility that it wasn’t even on his radar screen. Another moved from being fully invested to going 25% on margin-borrowing to invest even more in stocks – the day before the exact day of the S&P 500’s bull market high. If these market professionals with good long-term records weren’t able to anticipate the beginning of one of the most serious bear markets in U. S. history, you’re kidding yourself if you think you can consistently do any better.” –Mark Hulbert, “Bull Markets Don’t Usually End with a Bang.” Wall Street Journal, October 2, 2021
At its worst, the S&P 500 is only down 5% from its pre-Labor Day peak, and it hasn’t seen a 10% drop in the last 18 months. Someday we’ll see a 10% correction and it will feel like 1987 all over again due to the long delay in coming, but it will be just a speed bump in the rear-view mirror of life, like 1987 is now.
Trust the fourth quarter and its stock market. Good things usually happen at the closing of the year.


