In his Daily Market Notes report to investors, while commenting on Tesla Inc (NASDAQ:TSLA)’s EV sales, Louis Navellier wrote:
Q1 2021 hedge fund letters, conferences and more
China continues to growth at a frantic pace, but a bit slower than some economists anticipated. China’s GDP soared at an 18.3% annual pace in the first quarter and is expected to decelerate in the second quarter, even though U.S. GDP growth is forecasted to accelerate to a 10.5% annual pace according to the Atlanta Fed.
China banned financial institutions and payment companies from providing any services related to cryptocurrencies. Additionally, China warned investors about trading in cryptocurrencies. Since cryptocurrencies have their roots in Asia and India, the Chinese ban is devastating for the future of cryptocurrencies. The reason that financial institutions and payment companies (e.g., PayPal) were facilitating cryptocurrencies is that they were collecting lucrative transaction fees. Tesla’s recent refusal to allow its vehicles to be bought via cryptocurrencies over Bitcoin mining practices is also contributing to the cryptocurrency crash this week. Longer-term, the extremely volatility associated with cryptocurrencies is good news for gold and financial markets.
Tax Reform Glitch
The fight over corporate tax reform hit a “glitch” recently when Britain rejected Treasury Secretary Janet Yellen’s call for a global minimum tax agreement of 21% to help pay for the Biden Administration’s proposed $2.3 trillion infrastructure proposal. Britain is claiming “evasion and sophistry” from the U.S. calling for a global minimum corporate tax. So when one of the U.S.’s strongest allies is rejecting Secretary Yellen’s call for a global minimum corporate tax, it is essentially dead on arrival. I continue to stick by my previous statement that Senator Joe Manchin remains the most powerful person in Washington D.C., since he represents the swing vote in the Senate.
Our international relations are getting more complicated. The Biden Administration decided on Tuesday to not sanction the company building Russia’s Nord Stream 2 natural gas pipeline to Germany. Specifically, the Biden Administration decided to side with Germany after the Trump Administration criticized Germany for undermining NATO’s credibility by directly seeking natural gas from Russia. The U.S. State Department said “The Biden Administration has been clear that the Nord Stream 2 pipeline is a Russian geopolitical project that threatens European energy security and that of Ukraine and eastern flank NATO Allies and partners. We continue to examine entities involved in potentially sanctionable activity and have made it clear that companies risk sanctions if they are involved in Nord Stream 2.” The State Department spokesman added “We will continue to underscore U.S. strong, bipartisan opposition to this Russian malign influence project.”
The Commerce Department reported on Tuesday that housing starts in the U.S. declined 9.5% in April to an annual pace of 1.569 million, down from a revised annual pace of 1.733 million in March. It is possible that higher copper, lumber and steel prices may be starting to impede housing starts and put upward pressure on median home prices. Furthermore, an acute labor shortage may also be impacting housing starts. Compared to a year ago, building permits have risen 60.9% and have helped to create much of the “demand push” inflation that is now impacting the housing market.
Tesla’s EV Sales
Speaking of “demand push” inflation, the prices of cobalt, copper and lithium have all soared this year, so the price of electric vehicles (EVs) may rise in the upcoming months. In April, Tesla sold 25,846 EVs in China compared to 35,478 in March, so its sales declined 27.1%. Even worse, in the top 10 European countries, Tesla fell out of the top 10 in EV sales in April that was led by Volkswagen, followed by Renault, Peugeot, Hyundai, Kia, Smart, Audi, Skoda, Opel and BMW.
[Navellier & Associates owns Tesla (NASDAQ:TSLA) through one managed account held by the firm.]So far this year, through April, Volkswagen has the most EV sales in the top 10 European countries with 36,351, followed by Tesla with 19,649. Since VW Group also includes Audi and Porsche, its EV sales in the top 10 European countries this year is now beating Tesla by well over 2 to 1. In Tesla’s defense, they typically pull a “rabbit out of the hat” with a lot of sales via corporate sales and leases in the last month of each quarter. However, there is no doubt that EV competition is heating up. In the meantime, Tesla’s U.S. sales remain strong, but China and Europe are the fastest growing EV markets due to government incentives.
History on S&P’s Side
We’re just four months into the year, and while the S&P 500 is hanging on to double-digit gains YTD, it’s actually not all that uncommon to see double-digit percentage gains in the first four months of the year. Throughout the S&P’s history, nearly one in four years have seen a YTD gain of more than 10% through the end of April.
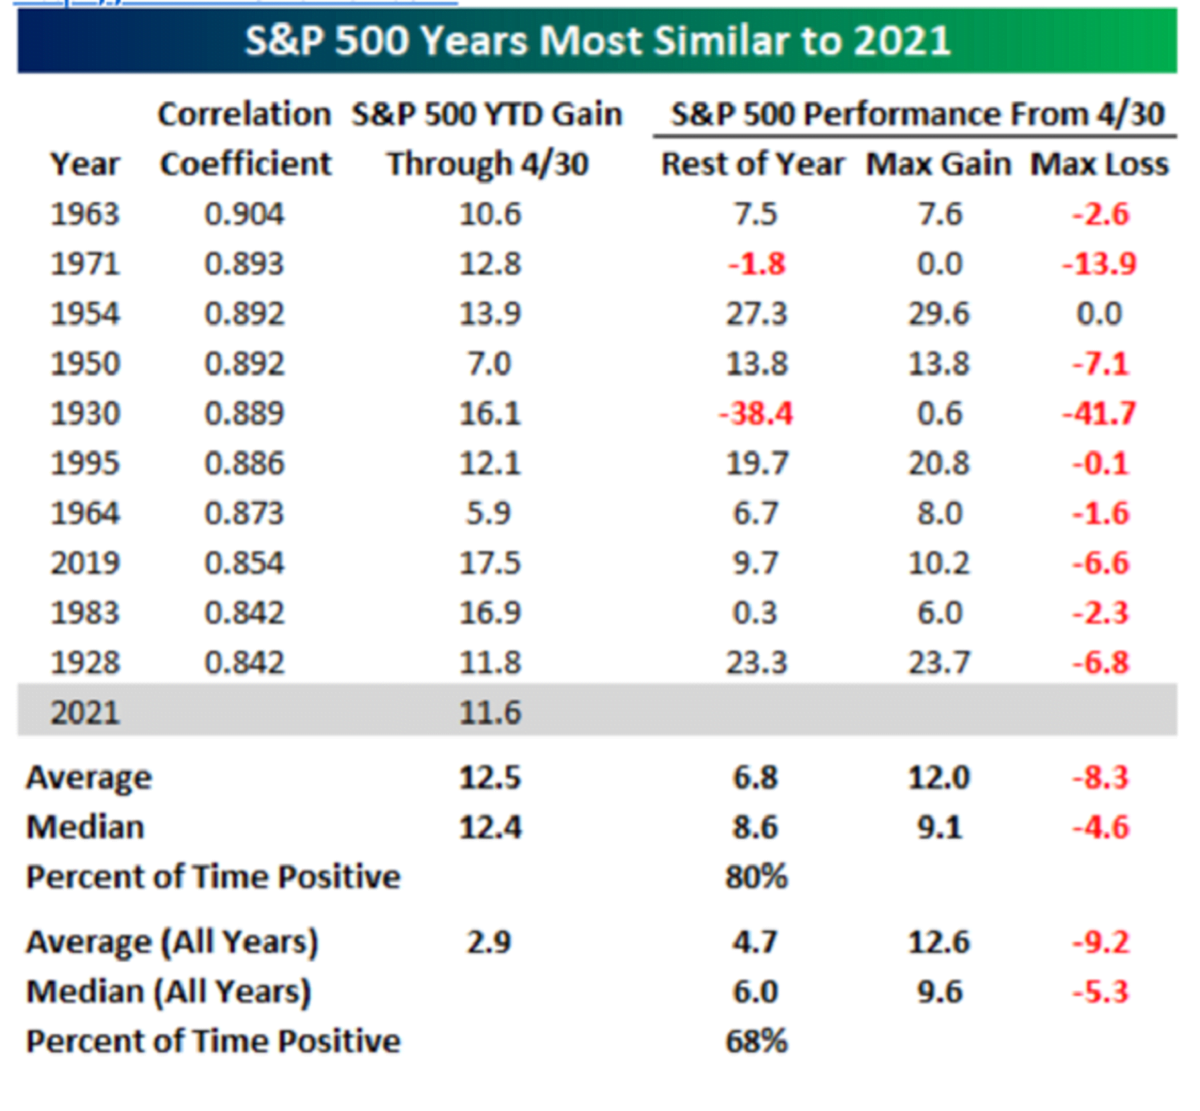
We always like to compare the current environment to look for similar periods in the past, and one analysis we find helpful is to look at prior years where the equity market’s trading pattern was the most like the current year. The table below lists the years since 1928 that had the highest correlation coefficient between their closing prices through the end of April to the S&P 500’s daily closing prices in 2021. For each year, we also include how the S&P 500 performed on a YTD basis through 4/30 and then how it performed for the remainder of the year, including the maximum gain and loss for each of those years.
Of the years shown, each one has a correlation coefficient of at least 0.84 with the most positively correlated year (1963) having a correlation coefficient above +0.90. As the charts below show, those kinds of readings represent remarkably similar patterns, and in all but two of the ten years, the S&P 500’s YTD gain was above 10%.
Looking ahead to the remainder of year, in eight of the ten years shown, the S&P 500 was positive for the remainder of the year, and including the two down years, the average rest of year gain was 6.8% (median: 8.6%) with positive returns 80% of the time. In terms of the average, median, and percentage of positive returns, these are all greater than the average for all years since 1929.
In terms of the S&P 500’s average maximum gains and losses from the close on 4/30, both were pretty close to inline with the average and median for all years.