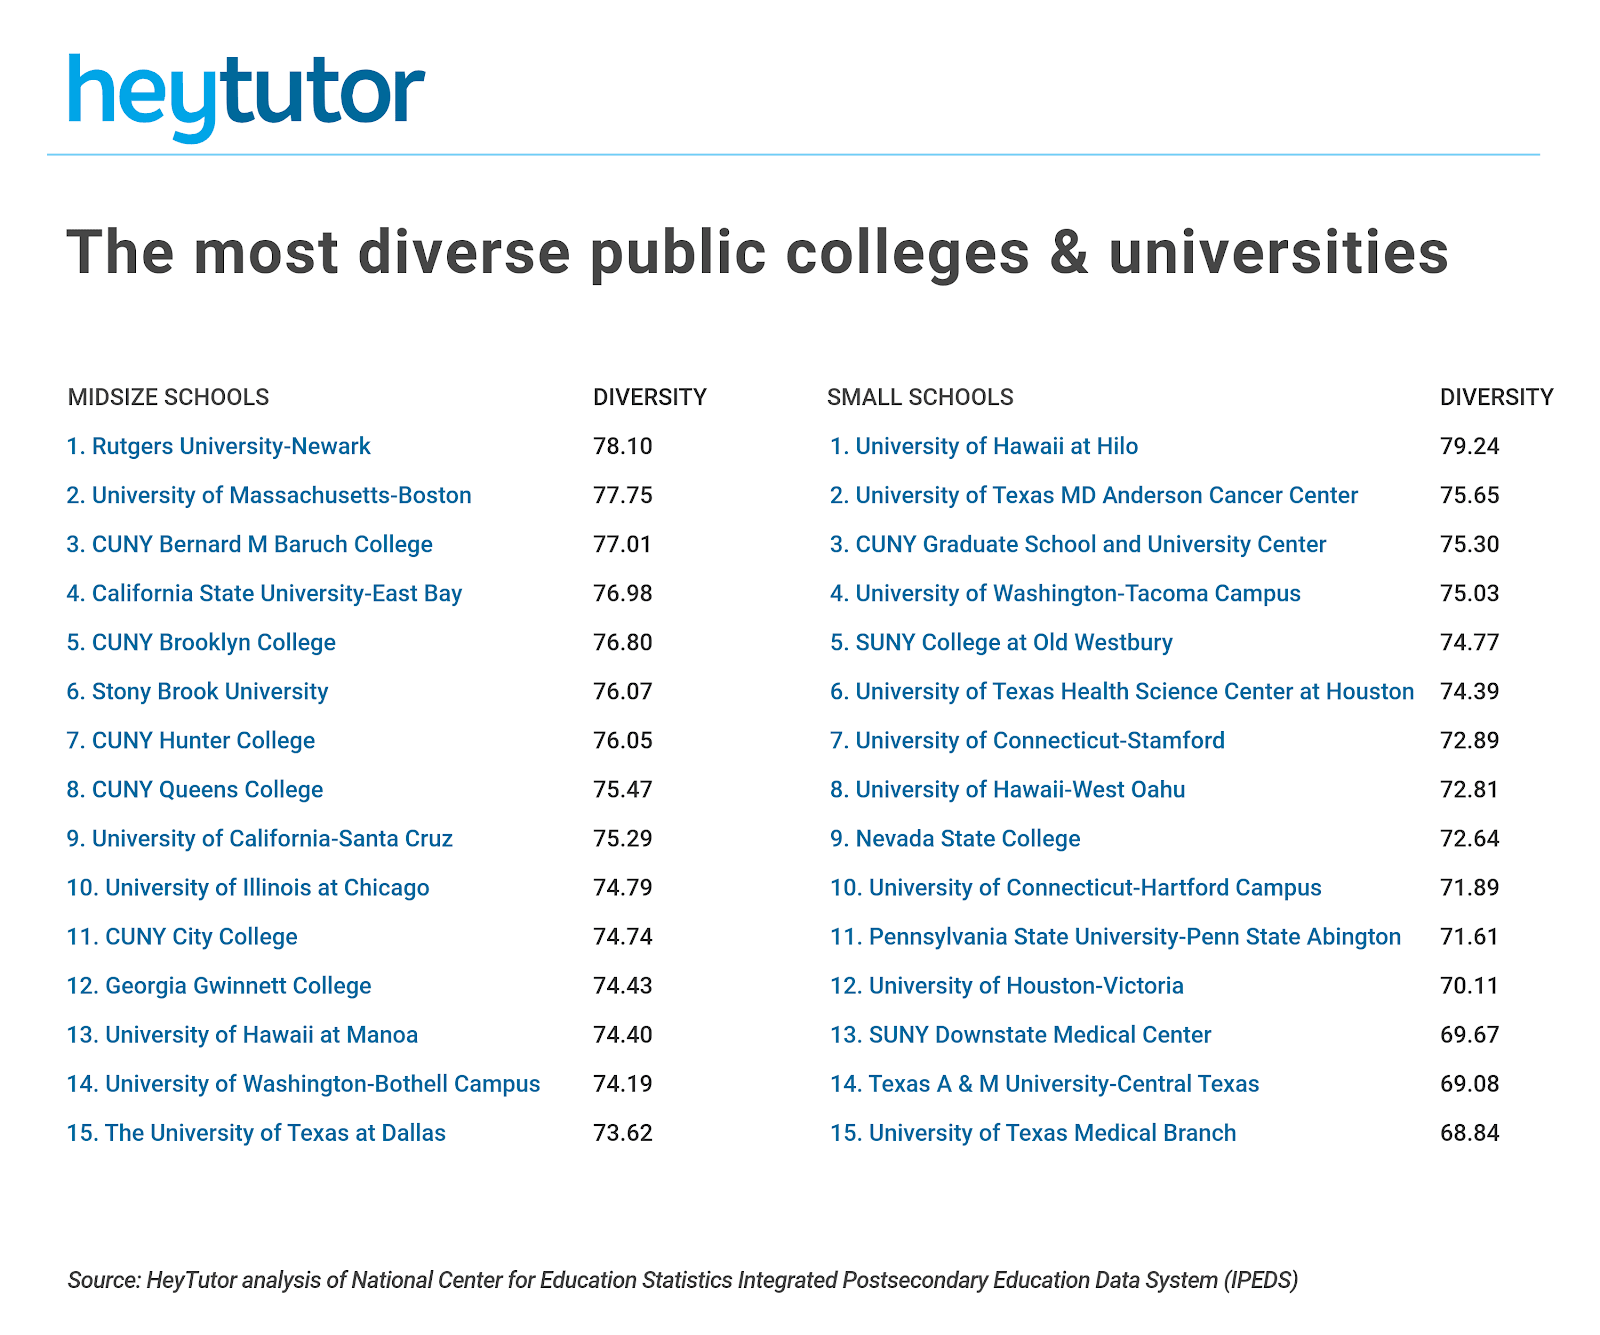
HeyTutor just released a new report comparing the most diverse public universities in the United States.
Just as America has become more diverse, so has its system of higher education. Since the late 1970s, the percentage of minority students at four-year, degree-granting colleges and universities has nearly tripled.
Q2 hedge fund letters, conference, scoops etc
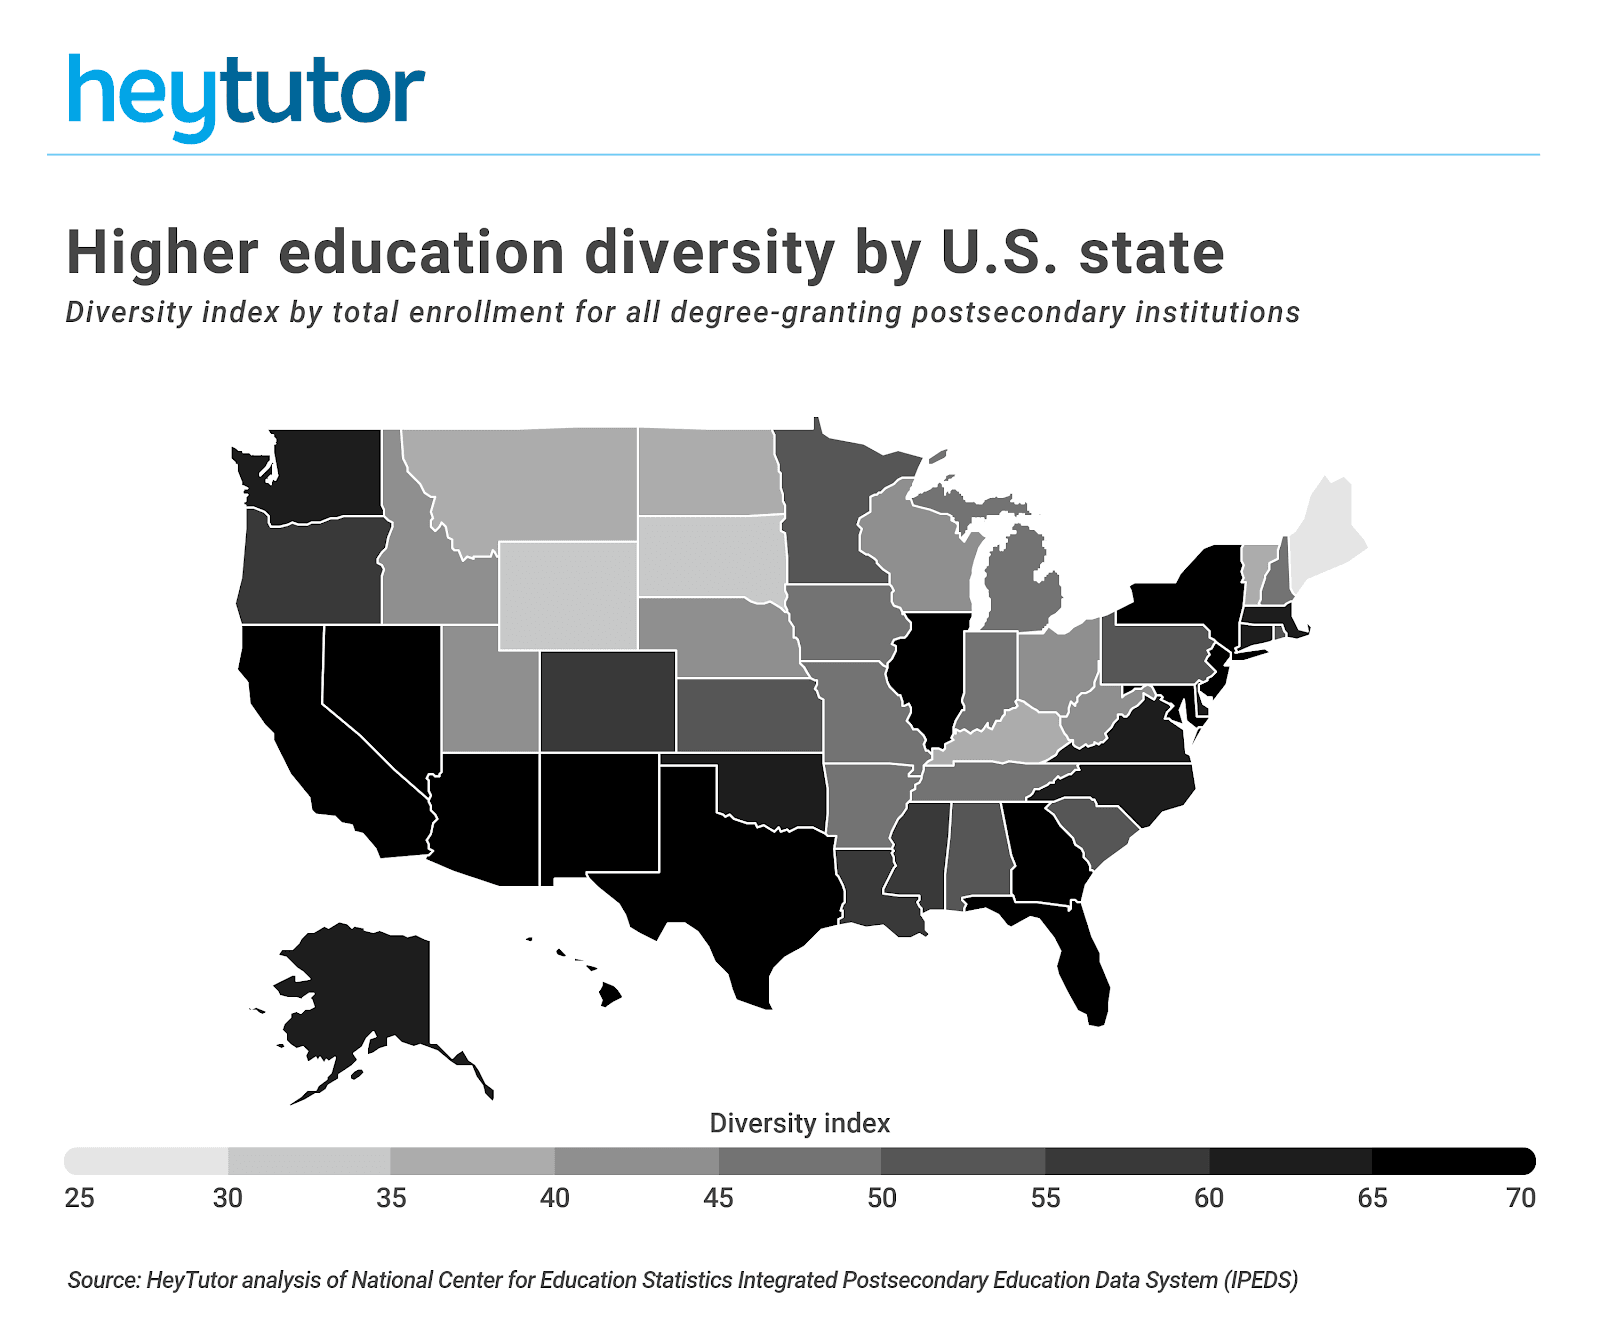
While the trend is clear at a national level, diversity varies widely by location. In fact, location is a much stronger predictor of diversity than whether a university is public or private with it being diverse public universities. America’s most diverse colleges, as measured by the Simpson Diversity Index, are predominantly found in California, New York, and Texas. In general, Western states have a more diverse student body, while Midwestern states tend to be less diverse.
The most and least diverse public universities by state
To find America’s most diverse public colleges, researchers at HeyTutor analyzed data from the National Center for Education Statistics (NCES) Integrated Postsecondary Education Data System (IPEDS). HeyTutor looked at fall 2017 undergraduate enrollment at more than 550 four-year, public, degree-granting institutions. They examined race/ethnicity data and calculated a diversity index for each school.
The table below is a summary of the results for the most diverse large public universities in the U.S.:
| University | Rank | Diversity Index | Total Undergraduate Enrollment | White | Hispanic | Black or African American | Asian | Nonresident | Other Races |
| University of California-Davis | 1 | 77.64 | 30,066 | 25.1% | 21.4% | 2.2% | 28.4% | 15.7% | 5.8% |
| University of California-Los Angeles | 2 | 77.31 | 31,002 | 26.7% | 22.2% | 3.4% | 28.1% | 11.8% | 5.7% |
| University of Nevada-Las Vegas | 3 | 76.87 | 25,279 | 31.7% | 29.0% | 7.8% | 15.5% | 3.5% | 11.4% |
| University of California-Santa Barbara | 4 | 76.51 | 22,186 | 31.9% | 26.6% | 2.3% | 18.2% | 9.9% | 8.6% |
| San Francisco State University | 5 | 76.32 | 26,680 | 18.0% | 32.7% | 5.5% | 25.8% | 7.1% | 6.8% |
| University of California-San Diego | 6 | 76.1 | 28,587 | 19.4% | 18.5% | 1.5% | 34.6% | 19.4% | 5.0% |
| California State University-Sacramento | 7 | 75.59 | 28,454 | 26.0% | 30.9% | 5.9% | 20.7% | 2.9% | 7.2% |
| University of Houston | 8 | 75.4 | 37,215 | 24.1% | 34.3% | 10.0% | 22.3% | 4.1% | 3.6% |
| University of California-Berkeley | 9 | 75.14 | 30,574 | 25.7% | 15.5% | 1.7% | 34.5% | 12.3% | 6.0% |
| University of California-Irvine | 10 | 74.80 | 29,307 | 14.0% | 26.4% | 1.9% | 35.7% | 16.7% | 4.2% |
| The University of Texas at Arlington | 11 | 74.51 | 33,307 | 36.3% | 27.4% | 14.8% | 11.4% | 4.1% | 4.0% |
| San Diego State University | 12 | 74.41 | 30,272 | 33.3% | 30.7% | 3.9% | 13.3% | 7.2% | 7.2% |
| San Jose State University | 13 | 73.99 | 27,778 | 16.1% | 27.9% | 3.4% | 35.7% | 7.5% | 5.5% |
| Rutgers University-New Brunswick | 14 | 73.82 | 35,641 | 38.8% | 13.1% | 7.2% | 26.5% | 9.0% | 3.6% |
| George Mason University | 15 | 73.79 | 25,010 | 41.3% | 14.2% | 11.0% | 20.0% | 5.8% | 4.9% |
For more information, a detailed methodology, and complete results for the most diverse public universities in the U.S., please see the original report on HeyTutor’s website. If you choose to use this data in an article of your own, please link/reference the study at: https://heytutor.com/blog/the-most-diverse-public-universities-in-the-us/


