Boyar Value Group commentary for the fourth quarter ended December 31, 2021.
Q4 2021 hedge fund letters, conferences and more
“We do a lot of thinking and not a lot of acting. A lot of investors do a lot of acting, and not a lot of thinking.” – Lou Simpson, Former Portfolio Manager of Berkshire Hathaway’s GEICO subsidiary.
A Look Back
Based on stock market returns and corporate earnings alone, U.S. equity investors should be thrilled with 2021’s results, with every sector of the S&P 500 having posted at least a 17% increase. Energy, real estate, and financials were the standouts, advancing 54.6%, 42.5%, and 35.0%, respectively, while industrials, consumer staples, and utilities “lagged” by advancing “only” 21.1%, 18.6%, and 17.7%. Overall, the S&P 500 recorded 70 record closes and notched its best December since 2010. Results were so strong, says Bespoke Investment Group, that as of December 31 the index’s 3-year total return crossed 100% (perhaps somewhat alarmingly, the first such occurrence since the dotcom bubble burst!).
It was also a spectacular year for corporate earnings, according to Michael Wursthern writing for the Wall Street Journal on January 2nd, 2022, with S&P 500 profits having risen 45% (estimated)—the highest figure since FactSet began tracking the statistic (admittedly against easy comps). But analysts don’t expect this high rate of growth to continue, with estimates for profit growth currently standing at ~10%, down from 16% earlier in 2021.
But as we all know, 2021 produced far more bad news than good. We’ve observed in previous letters that few investors given a preview of 2021’s major headlines (see a summary of them below) would have guessed that every major U.S. index would generate 20%+ returns:
Q1 2021
Roughly a week after the Democrats secured effective control of both houses of Congress through the Georgia Senate runoff election, the House voted to impeach President Trump, accusing him of encouraging the January 6 riots. Late January brought the rise of the “meme stocks,” with GameStop at one point in January advancing 1,741% causing once high-flying hedge fund manager Gabe Plotkin’s fund to decline more than 50% in a single month due to a short position in GameStop shares (as well as other “meme stocks”). In February, millions of Texans were stranded without power for days amid a winter storm that by some estimates caused $80-$130 billion of direct and indirect losses.
In March, President Biden signed a $1.9 trillion COVID-19 stimulus package into law. On a lighter note, NFTs (nonfungible tokens) burst into the popular lexicon when an artist known as Beeple sold a digital collage for $69 million! Then, in late March, a container ship ran aground in the Suez Canal, holding up nearly $10 billion worth of cargo per day and exposing the fragility of the global supply chain, which would hobble businesses throughout 2021 and—as of the writing of this letter—into the foreseeable future.
Q2 2021
April brought one of the most catastrophic hedge fund collapses in recent memory when Archegos Capital Management, after speculating with massive amounts of leverage on a handful of stocks, received a margin call. The fallout from the debacle, which cost Credit Suisse an estimated $5.5 billion remains a stark reminder of the dangers of leverage. Then, in May, U.S. housing prices experienced their biggest annual increase in almost two decades. (The median existing home sales price topped $350,000, nearly 24% higher than the year before.)
Q3 2021
Just as people were beginning to prepare for a return to “nearly normal,” the Delta wave of COVID- 19 hit, pushing back the long-awaited economic reopening. President Biden ordered that all federal employees be vaccinated or wear a mask, and the FDA approved the COVID-19 booster shot for those 65 years and older. In August, the Taliban took over Kabul and U.S. troops in Afghanistan eventually withdrew, ending almost 20 years of conflict.
Q4 2021
In October, roughly 140 countries agreed to one of the largest overhauls of global tax rules in a century, targeting a minimum 15% tax rate. In late October, Tesla’s market value surpassed $1 trillion after reports that Hertz had ordered 100,000 vehicles. (As of 12/31/19, Tesla’s market value had been “only” $75 billion.) In November, President Biden secured a notable legislative victory when he signed into law a $1 trillion infrastructure package. Toward the end of November as the Delta wave subsided, a new highly contagious Omicron strain was identified and designated by the World Health Organization as a variant of concern, sending equities sharply lower and further delaying a sustained economic reopening. In December, in a major blow to President Biden, Democratic Senator Joe Manchin announced that he would not support the Build Back Better Act, one of Biden’s and progressive legislators’ major legislative and social priorities, a move that has heightened uncertainty about future legislative and tax policy. (For more on these developments, see the Wall Street Journal article titled, “What Was News: 2021’s Biggest Stories,” published on December 15th, 2021.)
A Look Ahead
Any number of things could go wrong in 2022, whether related to Omicron or other potential COVID- 19 variants, misguided Fed policy, runaway inflation, or geopolitical tensions with China and Russia— among other things. But trying to predict the future, let alone the market’s reaction to it, is a fool’s errand. There will always be “reasons not to invest,” and predicting the near-term future is practically impossible. Instead, investors should focus on purchasing great companies at attractive valuations, thereby tilting the odds in their favor over the long run.
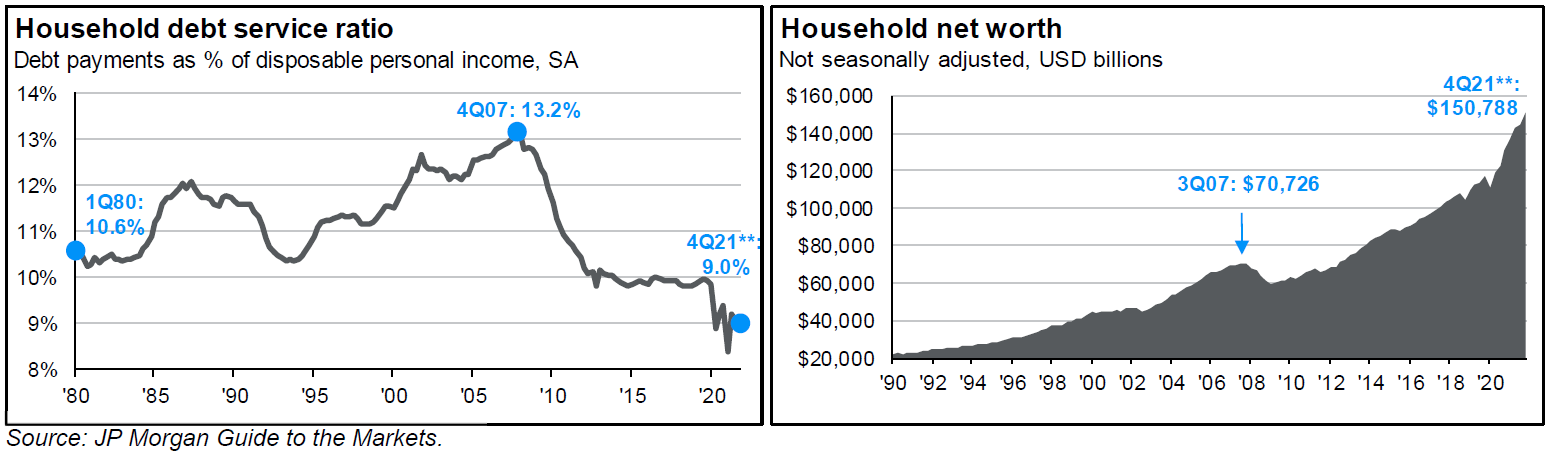
We remain bullish going forward, in part based on the state of the U.S. consumer. Debt payments as a percentage of disposable personal income stand at 9%, close to all-time lows and nowhere near the 13.2% reached in Q4 2007, right before the housing crisis. What’s more, with equities near all-time highs, amid a strong U.S. housing market, U.S. households’ net worth has never been greater (currently $150,788 billion, compared with $70,726 billion in Q3 2007). In our view, one of the dangers to a sustained recovery is cash hoarding, considering that the U.S. economy is largely consumer-driven.
The million-dollar question is whether the S&P 500 can continue its positive momentum for a fourth consecutive year. Certainly 3-year winning streaks are not unheard of, having occurred 11 times since 1927, but we also note that the S&P 500 dropped after six of those 3-year streaks.
Many of the high-flying companies that did so well in 2021 (and that have sharply reversed course thus far in 2022) were the favorites of the Robinhood crowd. The popular press often suggests that this new class of young investors who have entered the market should positively affect stocks’ long-term trajectory, bringing to mind similar stories written about day traders in the years prior to the dotcom collapse. However, when the bubble eventually burst, those day traders sustained such large losses that they exited the market completely and, in many cases, did not return for many years. With a good deal of the high-flyers having already lost 50% or more of their value, we’ll be interested to see whether this new class of investor will leave the market in a similar fashion.
U.S. Election Cycle and Stock Market Returns
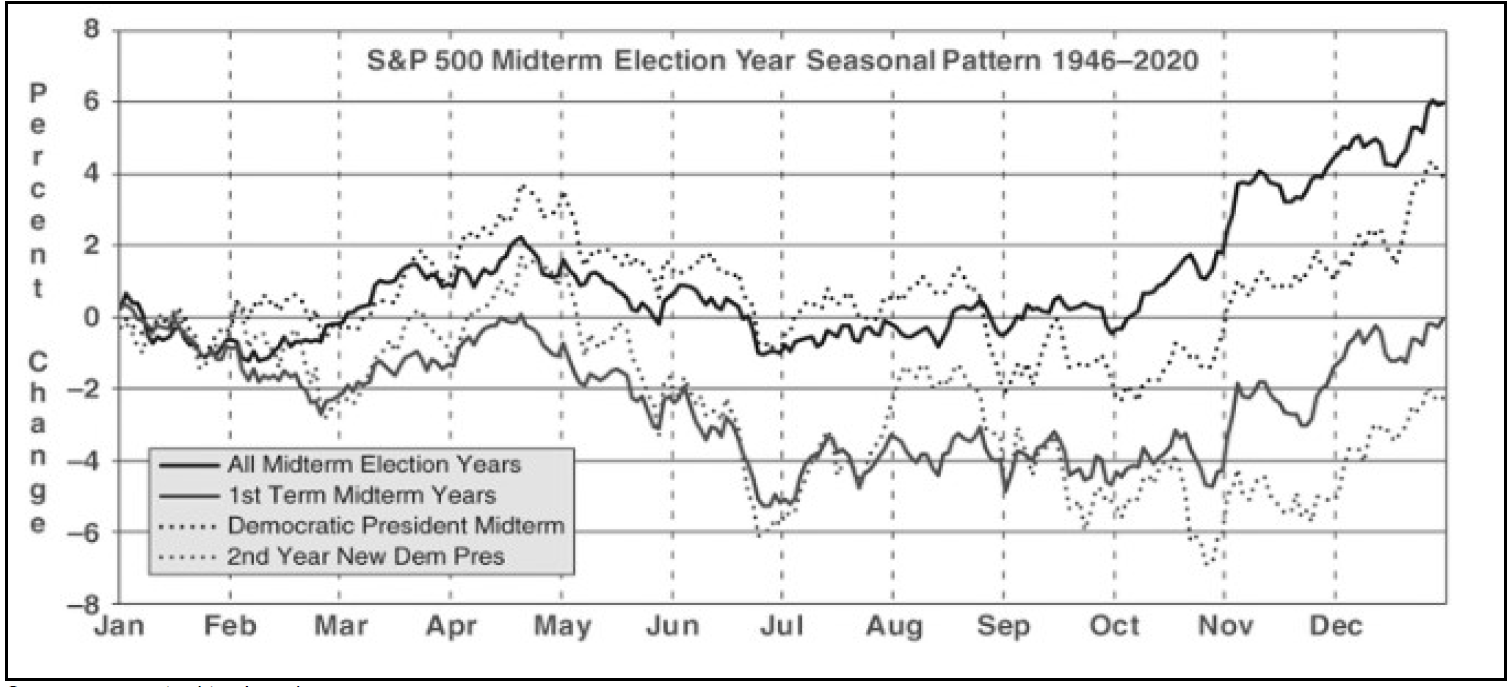
Since 1946, S&P 500 returns for midterm election years have been pedestrian at best, with advances averaging ~6%. When a Democrat is in the White House, the gain averages ~4%, but second years for new Democratic presidents have registered a 2.3% decline on average, according to the latest edition of the Stock Trader’s Almanac. What’s more, since 1913, the DJIA has dropped ~20.1%, on average, from its postelection high to its low in the following midterm year. The Dow’s postelection year high was ~36,488, so if history is any guide, the Dow could fall to somewhere around 29,153 before the midterms. (As of January 20, 2022, the DJIA stands at 34,715.)
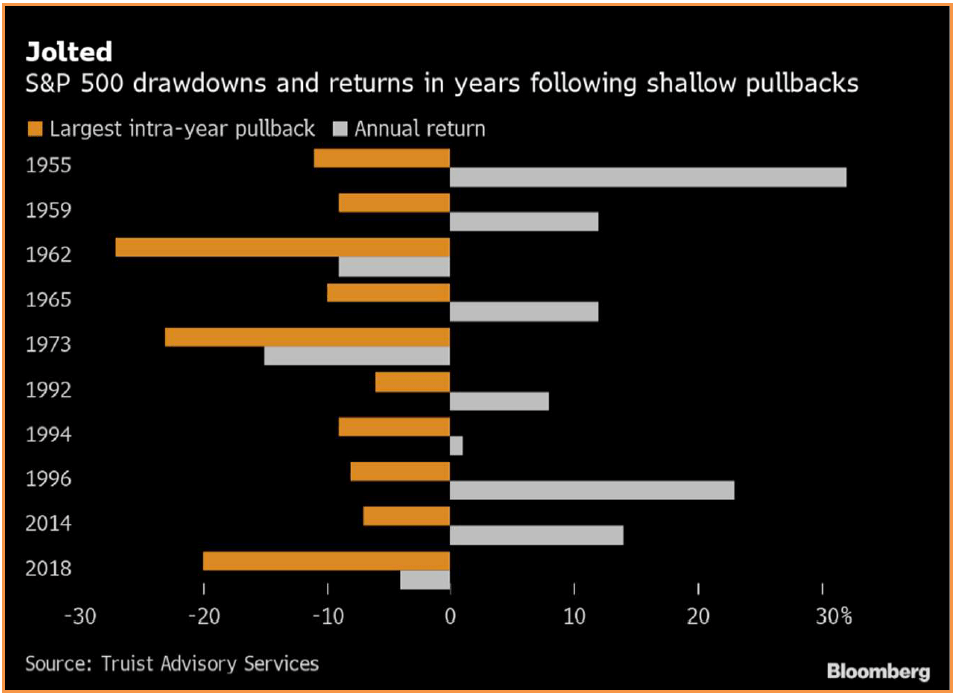
One factor that could potentially lead to more volatility in 2022 (and more muted gains), is the fact that 2021 was full of unusually mild pullbacks. According to Truist Advisory Services, following the ten years with the mildest pullbacks going back to 1955, stocks tended to advance the following year but were more volatile. According to Truist data in these years, the S&P 500’s deepest intra-year drawdown averaged 13% while posting an average return of 7%.
Interest Rates and Stock Market Returns
Now that the Fed is expected to start raising rates in 2022, examining how the stock market performed in a rising rate environment can be useful. As the following chart shows, from 1965 to 2009 stocks and rates moved together until the 10-year reached 4.5%, when a negative correlation appeared.
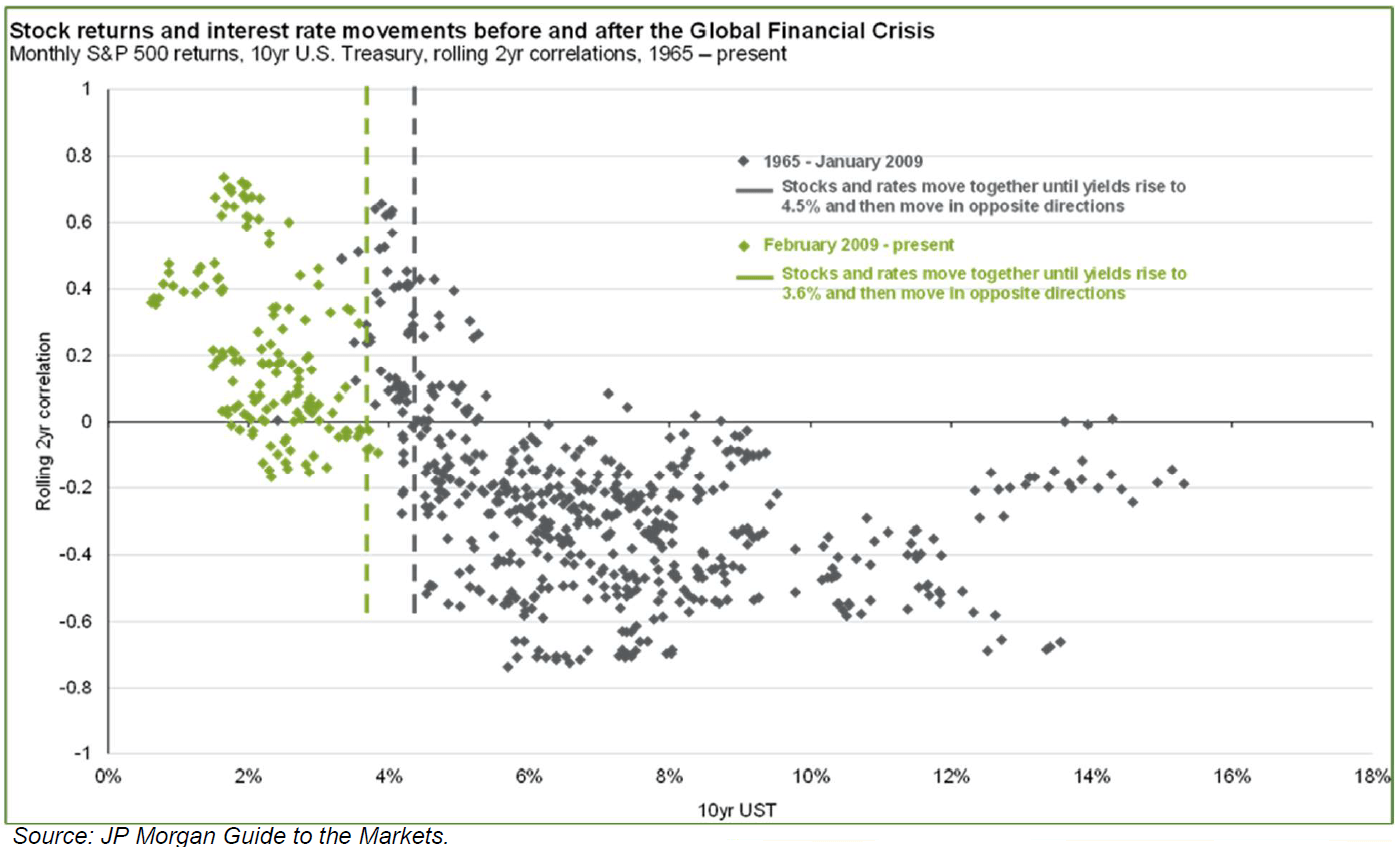
Since 2009 that negative correlation has started at 3.6%. With the 10-year currently yielding 1.77%, history would suggest that we have a long way to go before rising rates are negative for equities. We do offer one caveat: with rates so low for so long, amid such a level of monetary intervention by the Federal Reserve, we are in poorly charted waters, so past comparisons could be less meaningful.
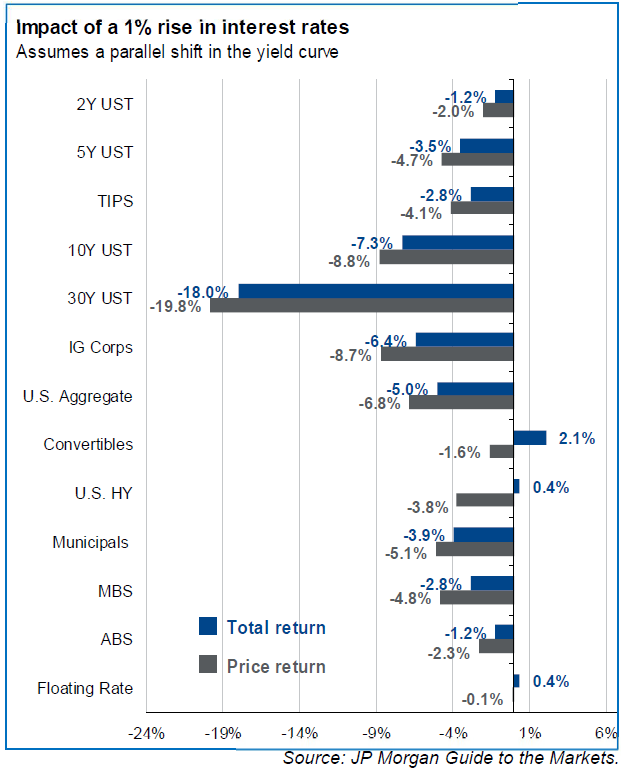
In 2021, some investors learned that fixedincome investments are not necessarily “risk-free” investments, with fixed-income investors’ returns especially painful against the backdrop of “risky” equities’ outperformance. If interest rates continue to rise, fixed-income investors could be due for much more pain, as can be seen by certain investments’ response (see chart to the right) to a 1% rise in interest rates.
If interest rates continue their ascent, Treasury investors might well see negative returns for 2 consecutive years (something unprecedented since records began in 1974). According to Michael McKenzie of Bloomberg, “The Bloomberg Treasury index provided a total return of minus 2.3% in 2021, its first slump in nominal terms since 2013. The index has in the past rebounded after a down year, with gains ranging between 5.1% and 18% after negative returns in 1994, 1999, 2009 and 2013.” Interestingly, despite the negative returns, investors put more money into bond funds than stock funds in 2021, according to Investment Company Institute data: ~$587 billion into bond funds and only $311 billion into stock funds.
Market Valuation
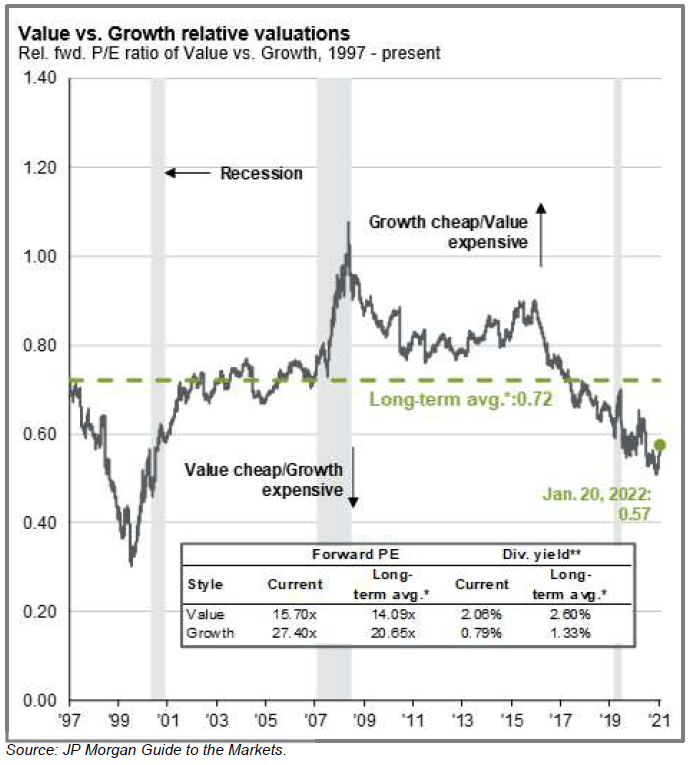
As of January 20, 2022 the S&P 500 was selling for 19.9x earnings (fwd.) versus 19.2x at its February 19, 2020, pre-COVID-19 peak and 13.3x at its March 23, 2020, pandemic low. Since the March 23 bottom, the S&P 500 has gained ~100%. By most traditional valuation measures, the S&P 500 is historically overvalued, yet value shares have not been this cheap relative to growth shares since the dotcom bubble (although they are not particularly cheap compared with their own long-term average). We continue to believe that value will outperform growth in the medium to long-term, not only on a relative basis, but also— and much more important—by producing a positive absolute return.
Narrow Leadership
We’ve observed before that the S&P 500 is being driven by a handful of mega-cap stocks, but things haven’t always been this lopsided. Based on data from JP Morgan, as of January 20, 2022, the top 10 companies in the market-cap-weighted S&P 500 accounted for 29.8% of the index (vs. ~17% back in 1996) and boasted an average forward multiple of 30.3x (vs. an average of 19.8x since 1996). Interestingly, says Gary Shilling, writing for Bloomberg, the decade before the average company’s market cap grows large enough to usher it into the S&P 500’s “top 10,” it outperforms the broader market by 10% a year (hardly surprising, with outperformance the driving factor in becoming a big company in the first place!)—but after companies join the top 10 club, they tend to underperform the broader market by 1.5% over the following 10 years. Anyone considering investing in some of the S&P 500’s larger stocks should keep this trend in mind, remembering what the great Wayne Gretzky used to say “skate to where the puck is going to be, not where it has been.”
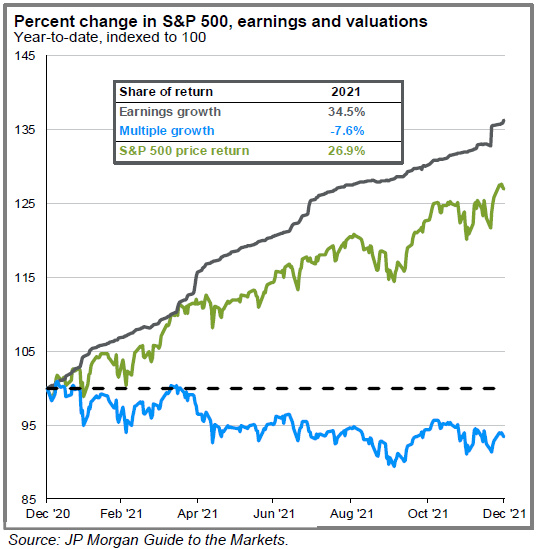
The remaining stocks in the S&P 500 are selling at 18.6x, above their average valuation of 15.7x since 1996 but far less than the top 10 companies. Interestingly, 2021’s results were driven solely by earnings, as earnings increased by 34.5% but the P/E multiple dropped by 7.6%.
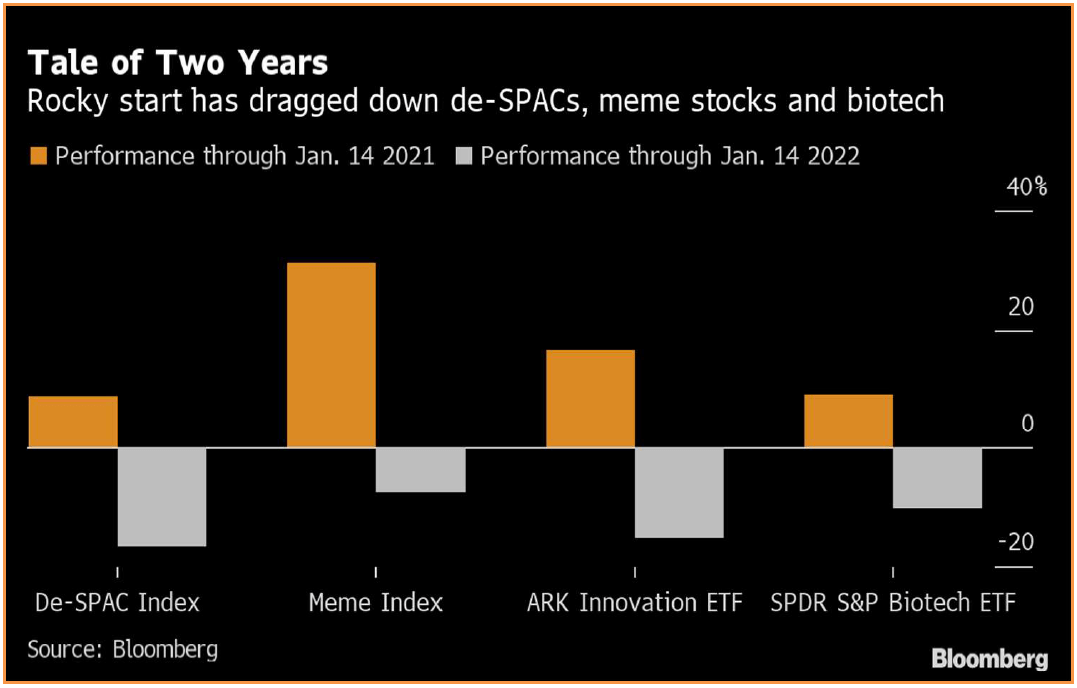
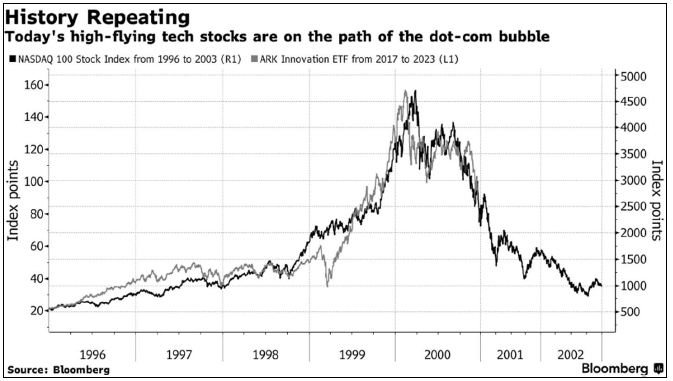
The ARK Invest Innovation ETF (managed by Cathie Wood) is the poster child for the pain felt in the market’s most speculative areas. ARK fund shares have gained almost 250% during the past 5 years, but much of that gain occurred in 2020, and the fund is down over 50% from its all-time highs in February 2021 (and down almost 20% in 2022 alone, as of January 20), says Edward Harrison of Bloomberg, who calls ARK’s performance “eerily similar” to the dotcom bubble and bust. Despite ARK’s recent poor performance, Ms. Wood’s longterm record is still quite strong, but unfortunately most of her investors haven’t done so well: according to Bespoke Investment group, the average investor in five of ARK’s ETFs is nursing a 27% loss.
Insiders Selling
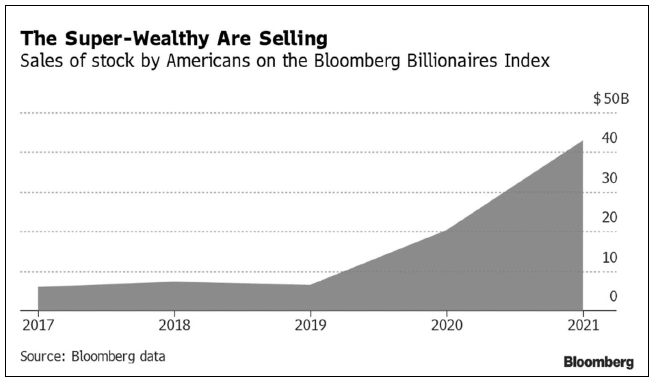
Corporate executives can have many different reasons for selling shares (anticipation of tax law changes, philanthropy, diversification, and much more), but the sheer number of billionaire founders who sold shares in 2021 should raise eyebrows and might well be signaling a market top. Bloomberg’s Ben Steverman and Scott Carpenter report not only that Mark Zuckerberg of Meta Platforms Inc. (formerly known as Facebook) sold shares in his company almost every day last year but also that the founders of Google sold ~$3.5 billion worth of stock (the first time either Sergey Brin or Larry Page has sold shares since 2017). But Elon Musk, in selling shares for the first time since 2016, is leading the pack, having sold ~$16 billion worth of Tesla stock in 2021. Overall, according to Bloomberg, the very richest Americans unloaded $42.9 billion in stock through the start of December—more than double their figure for 2020.
The Wisdom of Taking a Long-Term View
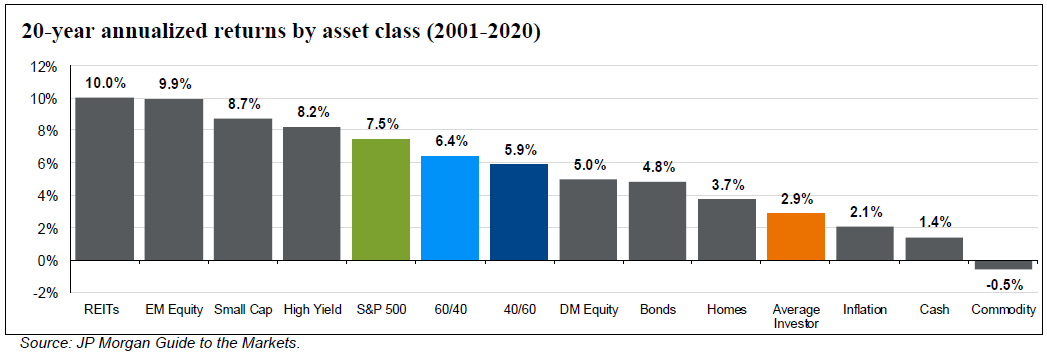
We’ve said it before, and we’ll say it again: individual investors stack the odds of investment success in their favor when they stay the course and take a long-term view. Yet data from Dalbar tell us that over the past 20 years, when the S&P 500 averaged a 7.5% annual advance, the average investor gained a mere 2.9%, barely beating the 2.1% inflation over the period. Why such a degree of underperformance? Partly because investors let their emotions get the better of them and chase the latest investment fad (or pile into equities at market peaks and sell out at market troughs)—and partly because they sell for nonfundamental reasons, such as a rise in a company’s share price (or in an index).
But history tells us that taking a multiyear view instead would tilt the odds of success in investors’ favor. According to data from JP Morgan, since 1950 annual S&P 500 returns have ranged from +47% to – 39%. For any given 5-year period, however, that range narrows to +28% to -3%—and for any given 20-year period, it is +17% to +6%. In short, since 1950, there has never been a 20-year period when investors did not make at least 6% per year in the stock market. Past performance is certainly no guarantee of future returns, but history does show that the longer a time frame you give yourself, the better your chances become of earning a satisfactory return.
As always, we’re available to answer any questions you might have. If you’d like to discuss these issues further, please reach out to us at [email protected] or 212-995-8300.
Best regards,
Mark A. Boyar
Jonathan I. Boyar


