
Bonhoeffer Capital Management commentary for the second quarter ended June 2021, providing a case study on Asbury Automotive Group, Inc. (NYSE:ABG).
Q2 2021 hedge fund letters, conferences and more
Dear Partner,
The Bonhoeffer Fund returned 11.1% net of fees in the second quarter of 2021. In the same time period, the MSCI World ex-US, a broad-based index, returned 5.9%, and the DFA International Small Cap Value Fund, our closest benchmark, returned 4.5%. Year to date, the Bonhoeffer Fund has returned 26.4% net of fees. As of June 30, 2021, our securities have an average earnings/free cash flow yield of 12.1% and an average EV/EBITDA of 4.6. The DFA International Small Cap Value Fund had an average earnings yield of 9.6%. These multiples are higher than last quarter, primarily due to replacing slower-growing securities with higher-growth securities. The difference between the portfolio’s market valuation and my estimate of intrinsic value is still large (greater than 100%). I remain confident that the gap will close over time, and the portfolio quality will continue increasing as we increase the allocation to faster-growing firms.
Bonhoeffer Fund Portfolio Overview
Since our investment universe has been extended beyond value-oriented special situations to include growth-oriented firms using a value framework, there have been modest changes within the portfolio in the last quarter in line with our low historical turnover rates. We have continued selling our slower-growing firms, as well as those being acquired or spun-out from special situations including: Buzzi Unicem, LX Holdings (spun out of LG Corp), Antero Midstream, At Home (acquired in a private equity buyout), and ALJ Regional. The proceeds have increased our holdings in Asbury Automotive, Countryside Properties, and Consolidated Communications. In the same vein, we have purchased Builder’s FirstSource (BFS), a US building products distributor, Millicom, a Latin American quad play telecommunications provider, and an Italian telecommunications fiber company.
As of June 30, 2021, our largest country exposures include: South Korea, United States, United Kingdom, South Africa, Italy, and Hong Kong. The largest industry exposures include: distribution, telecom/media, real estate/infrastructure, and consumer products.
We continue to see nice progress in our Korean holdings due, in part, to the fact that the country has effectively dealt with the spread of the COVID virus, unlike Latin America and South Africa, where we continue to see slow recoveries and challenges related to the virus. These countries have less developed health care infrastructures with slower distribution and immunization rates and cultures/jobs that require more face-to-face contact. The effects of COVID on these developing economies have been stifling to growth. Given the success of the COVID vaccine trials and the delayed production and logistics, I think recovery in these regions will occur to 2022. This provides us an opportunity to invest in deferred (versus developed countries) COVID recovery situations. Governance is good—and improving—in our South African and Latin American holdings and, in my opinion, the current pricing more than reflects the governance situation in Hong Kong. Since my last letter, we have added a position in a Latin American telecom provider with recurring revenues.
Compound Mispricings (39% of Portfolio; Quarterly Average Performance +7%)
Our Korean preferred stocks, the nonvoting share of Telecom Italia, Wilh. Wilhelmsen, and some HoldCos all feature characteristics of compound mispricings. The thesis for the closing of the voting, nonvoting, and holding company valuation gap includes evidence of better governance and liquidity. We are also looking for corporate actions such as spinoffs, sales, or holding company transactions and overall growth.
As discussed in our last letter, we continue to review our compound mispricings and look to sell where the discount is small and there do not appear to be ongoing actions to unlock value, as was the case with Buzzi Unicem. Having determined that there were better ways to play the increased housing/infrastructure growth in the United States (including BFS and Ashtead), in addition to the disappointing saving shares/common share conversion ratio that occurred earlier in the year, we sold our stake in Buzzi in order to take advantage of better opportunities.
The Korean preferred discounts in our portfolio are still large (25% to 73%). The trends of better governance and liquidity have reduced the discount in names like Samsung Electronics Co Ltd (KRX:005930), and more preferred names trade at a premium to common shares. We also sold the LX Holdings Corp (KRX:383800) preferred we received from the LG Corp (KRX:003550) spinoff transaction. In June 2021, we received TND shares of LX Holdings preferred for each LG Corp preferred share we held. LX Holdings include the spun-out assets of LG MMA, Silicon Works, LG Hausys, and LG International. We sold our LX Holdings preferred at a small discount to the NAV of LX Holdings. Typically, the preferred shares trade at a discount to the common, and the common trade at a significant discount to the NAV. As an example, LG Corp Preferred (the company LX Holdings was spun out of) currently sells at discount of 75% to LG Corp’s NAV.
Public LBOs (35% of Portfolio; Quarterly Average Performance +9%)
Our broadcast TV franchises, leasing, building-products distributors, and roll-on/roll-off (RORO) shipping fall into this category. One trend I’ve noted in these firms is growth creation through acquisitions, which provide synergies and operational leverage associated with vertical and horizontal consolidation and the subsequent repurchasing of shares with debt. The increased cash flow is used to pay the debt and the process is repeated.
Builders FirstSource, Inc. (NYSE:BLDR), a new addition to the portfolio, offers an example of this trend. The building products market in the US is a fragmented market undergoing consolidation. BFS is the largest building supplier in the US, with a 10% market share. BFS recently purchased BMC and other small building distributors tuck-in acquisitions with debt. In addition, BFS expanded its vertical integration through the purchase of a home design software firm. BFS has been able to finance these purchases at a low rate of 4.25% and invest in assets with a cash flow return of 9% per year for the Alliance acquisition. A reasonable longer-term EPS/FCF growth rate for BFS is mid-double digits over the next five years at a price/earnings of 7.8x.
Distribution Theme (40% of Portfolio; Quarterly Performance +11%)
Our holdings in car and branded capital equipment dealerships, online shopping, building product distributors, and capital equipment leasing firms all fall into the distribution theme. One of the main KPIs for dealerships and shopping is velocity. We own some of the highest-velocity dealerships in markets around the world. There have been challenges in some markets hit by COVID, like South Africa and Latin America; however, there should be recovery once a vaccine is approved and distributed.
Our UK car dealership, Cambria Automobiles PLC (LON:COG), has received a higher offer by management of £0.825 per share from £0.80 per share previously. We believe, given the quality of Cambria’s franchise, that Cambria is worth £1.50 to £2.25 per share today, with a growing value over time. Since this type of takeover will require at least 75% shareholder approval and there are other shareholders who think this price is low also, we think that, to gain acceptance, the offer price will have to be increased. The interesting dynamics of dealership economics are described in this quarter’s case study on Asbury Automotive.
Telecom/Transaction Processing Theme (34% of Portfolio; Quarterly Performance +13%)
The increasing use of transaction processing in our firms’ markets and the rollout of 5G will provide growth opportunities. Given that most of these firms are holding companies and have multiple components of value (including real estate), the timeline for realization may be longer than for other firms.
Millicom International Cellular SA (NASDAQ:TIGO), a new telecom firm added to the portfolio this quarter, is a combination of a Verizon wireless and a Charter Communications (a leading US cable company), operating in fast-growing Latin American countries. The rollout of fiber networks (a core communications service) is a future toll road being constructed worldwide. This region has been devastated by COVID, so short-term results will be challenging. Despite this, Millicom has continued to roll out a fiber-optic network in markets in Latin America as the only competitor—or one of two competitors—in each market. This will lead to high penetration rates; 30%+ in most of Millicom’s fiber optic network. This should result in 9% to 10% FCF growth rates over the next five to 10 years and today trades at a current valuation of 5x FCF and 3.6x five-year forward FCF. Given the location of this network (Latin America), it should trade at a discount to US networks; but, in my opinion, 5x FCF is extreme for a growing network with a lot of recurring revenue.
Consumer Product Theme (11% of Portfolio; Quarterly Performance +18%)
Our consumer product, tire, and beverage firms comprise this category. The defensive nature of these firms has led to lower-than-average performance due to the stronger performance from more recovery-correlated names. One theme we have been examining is the erosion of brand names in favor of store brands via value-oriented retailers. Our At Home investment is an example of this, as 70% of its sales are exclusives or At-Home-branded products. Unfortunately, management and its private equity partner were able to purchase At Home at a bargain purchase price from existing shareholders. The upside for Bonhoeffer is the business model of At Home has provided a blueprint for future retail investments.
Real Estate/Construction Theme (25% of Portfolio; Quarterly Performance +11%)
In my opinion, the pricing of our real estate holdings has been impacted by both a recession and the communist takeover in Hong Kong. The current cement and construction holdings (in US/Europe via BFS and Countryside and in Korea via Asia Cement) should do well as the world recovers from COVID shutdowns and governments start infrastructure programs. Our new holding, Countryside Holdings, a UK-based homebuilder/renovator, is a combination of spinoff/sale special situation where its homebuilding business will be spun off to fund repurchases of its capital-light partnerships business. The catalyst of sale/spinoff is anticipated to occur over the next six months which should highlight the value of its high-growth partnership business.
Application of The Growth Framework
In the last few letters, I have mentioned the growth framework we have incorporated into our investment selection/evaluation approach over the last few quarters. Specifically, we are looking forward five years and estimating what the revenue growth and earnings or free cash flow margins will be and applying an applicable terminal multiple to the earnings or free cash flow. In addition, I am estimating five-year forward price/earnings or free cash flow multiples. We then look at the revenue drivers and the operational leverage/margin drivers for the firm historically and what is the most likely path for these drivers going forward. Once identified, these drivers are tracked over time to see if they are being achieved. History of the target firm and comparable firms (by industry and revenue model) are used to validate the assumptions used in the projection model. This process, applied to firms around the world, provides some insight into where firms are going, in addition to their past performance. Using Ashtead as an example, an illustration of this methodology is shown below. This approach provides a forward-looking perspective to compare the valuation of firms with various growth profiles in a dynamic fashion versus a more static approach of comparing current multiples.
This framework is used in combination with our existing three frameworks (compound mispricings, mischaracterized firms, and public LBOs) to evaluate opportunities. With these frameworks, we have been able to evaluate firms in three very interesting themes: consolidation of distributors, development of fiber-optic networks, and leveraging slow-growth businesses to create nice cash flow growth.
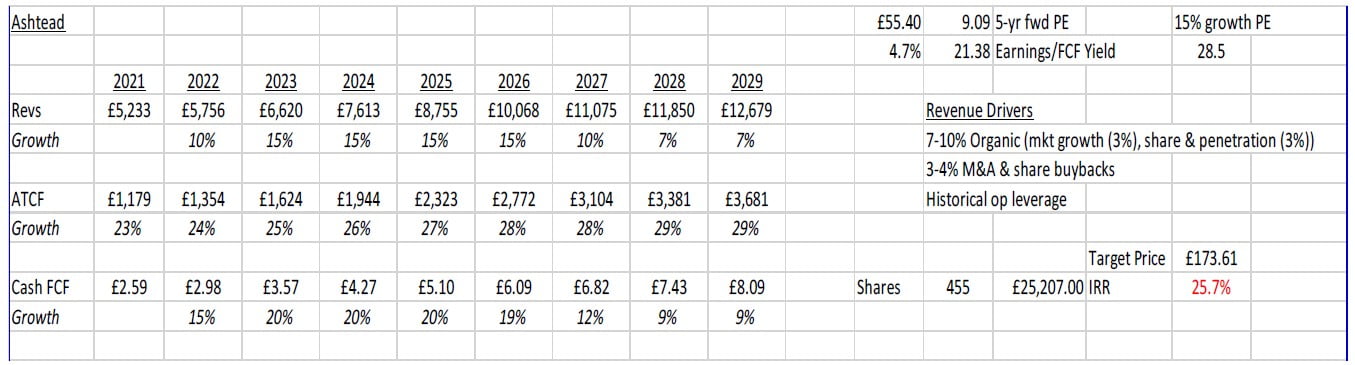
Ashtead Group plc (LON:AHT) (a portfolio holding) is a leading equipment rental firm in the US market. Ashtead’s ability to grow has been enhanced by a fragmented equipment leasing market and adjacent markets that Ashtead can lease from and sell products into (such as cleaning equipment) using the same infrastructure in leasing equipment (thus gaining local economies of scale). Ashtead can grow its sales at a rate of 15% per year, 7% to 10% via organic growth (market growth plus rental penetration) and 3% to 4% via acquisitions. If we use the historical operational leverage we have observed from Ashtead’s growth, then FCF per share should be able to grow by 20% per year. In five years, 20% growth will generate 2.4x the free cash flows and, if this can be maintained for another seven years, then the multiple should be about 35 times. So, in this case, you can get a 2.4x via cash flow growth, a 1.3x via increased multiple, for a combined upside of 3.2x. The key to these upside values is sustainable growth with margin expansion. These can be found in firms with growing franchises.
Conclusion
As always, if you would like to discuss any of the philosophies or investments in deeper detail, then please do not hesitate to reach out. Until next quarter, thank you for your confidence in our work and have a safe and fruitful remainder of your summer.
Warm Regards,
Keith D. Smith, CFA
Case Study – Asbury Automotive Group (NYSE:ABG)
Asbury is an automotive dealership group located in the United States (US). Asbury has 112 dealerships, 50 of which are considered premium or luxury brands, 43 of which are import brands, and 14 of which are mass market. Recently, Asbury has added an online sales channel through Clicklane. Automobile dealerships are really four businesses in one: new car sales, used car sales, service and parts, and financing and insurance. Disruption is occurring in the dealership industry via channel compression and disintermediation. The US new automobile market is less susceptible to disruption than other markets, such as in the UK, as the franchise agreements in the US provide geographically exclusive territories and the US dealers have access to off-lease used vehicles (30% of new cars sales in the US are leased).
Asbury has four levers for cash flow growth: (1) buying new dealerships, (2) paying down debt, (3) internet-only distribution, and (4) buying back shares. Asbury’s management has a returns-oriented framework, having delivered an average return on equity of 32% over the past 10 years—the highest in the US automobile dealership market. Historically, Asbury has grown by buying dealerships in and around existing clusters or buying a new platform in a new market to anchor activity in that new market. Asbury has enhanced its organic growth with 10% of new car sales in Q2 2021 from Clicklane. Management expects that number to increase to 15% of new sales online by Q4 2021. Clicklane was rolled out in late Q4 2020, so this growth is only from six months of operations. 93% of the Clicklane customers are new customers to Asbury. This is a much quicker ramp-up than experienced by Lithia Motors, a competitor to Asbury, which has had online only sales for six months and is selling 6.5% of its new cars online.
As mentioned above, auto dealerships are really four types of businesses: new car sales, used car sales, service and parts, and financing and insurance. New car sales are cyclical based upon original equipment manufacturer (OEM) sales. Used car sales are less cyclical, as consumers will purchase used cars when there is an economic downturn. Service and parts are more defensive, as service is required on a regular basis for automobiles. Financing is dependent upon new and used car sales and is a high-margin add-on to these types of sales.
The integrated auto dealership market is being disrupted by new business models and technology. The used car superstore and online store are new business models where disruption is occurring. Examples in the US include CarMax and Carvana; a UK example is Motorpoint. These firms typically sell cars at lower prices and have higher inventory turns versus the traditional integrated dealer models. They also attract value-oriented automobile consumers who buy used versus new cars. Technology is also facilitating the selection and purchase of used cars, making the transaction more transparent and enjoyable compared to tradition auto dealer haggling. US OEM dealers have advantages versus online-only firms, including: (1) access to new cars from the OEMs, (2) more customer touchpoints (via service) to generate recurring revenues, and (3) used car sourcing from vehicles coming off OEM leases. Some of the OEM auto dealer groups (Asbury, Group 1, and Lithia) have developed stand-alone online distribution channels for new and used cars. There has been tremendous growth in this channel over the past year, with Group 1 having a 100% increase in sales and Asbury, in Q2, selling 10% of its cars via this channel from none last year. For OEM dealership groups, this is a low-investment way to increase sales and realize some of the scale advantages associated with internet distribution. The online channel also is attracting a younger demographic to Asbury. In all cases, these are new customers (with 95% or more new customers) to Asbury, Group 1, or Lithia. Historically, Carvana, the largest online-only dealer, has provided 50% subprime and 50% prime credit financing, with about 80% of sales financed. Asbury has provided third-party financing and has had a more prime clientele. In my opinion, there is room for both Carvana, CarMax, and firms like Asbury, as each is servicing different segments of the auto retailing market. Asbury has differentiated itself in that it scrapped its legacy CRM system, PUSHSTART, and replaced it with Clicklane, which includes an all-online sales and financing functionality, as well as traditional CRM functionality found in PUSHSTART.
Another disruption is the larger independent automobile service providers—like Monro Auto Service and Tire Centers in the US—who provide high-margin automobile service outside the automobile dealership. Luxury car dealers are more immune from price competition than the volume dealers, superstores, and independent automobile service firms, in part, due to luxury automobile consumers valuing service more than price-conscious consumers. Luxury dealerships are a larger part of Asbury’s mix (45%) than other US car dealers such as Lithia Motors (25%), AutoNation (39%), and Group 1 (24%). Asbury’s gross margin mix of new sales (20%), used sales (14%), finance and insurance (23%), and parts and service (43%) is in line with other US dealers.
The automobile dealer’s service operations are also being challenged by non-internal combustion engine (ICE) types of automobiles—electric vehicles (EVs) and hybrids. Based upon data from Group 1 in the US, Bilia in Scandinavia (where there is higher EV penetration), and Edmunds.com, EV and hybrid customers generate as much dollar revenue of service per year as ICE customers, but what is serviced is different—more software, tires, and software than ICE automobiles. Also, the increased complexity of vehicles—and the equipment and personnel needed to service this complexity—should allow dealers to take service market share from independent repair shops.
The auto dealership model is also subject to local economies of scale. In a local market, a dealership, like other retailers, can take advantage of economies of scale (density) associated with advertising, logistics, and local management/oversight. Of the US publicly traded automobile dealers, Asbury has the most geographic clustering, which leads to higher margins and inventory turns versus more geographically dispersed competitors.
US Auto Dealership Business
In the US, the top five dealers have an 8% market share, so the market is fragmented and consolidating. Asbury has a small market share of US car and truck sales, with a 0.7% market share.
Sources of growth for Asbury include service and parts growth, used car sales growth, new dealerships, and acquisitions. The US market has been flat for the past 15 years (from 2004 to early 2020), with new car and truck sales remaining flat at around 17 million seasonally adjusted annual rate (SAAR). Asbury has been able to increase sales over the past 15 years by 4% per year led by an increase in parts, services, and new car and used car sales. Asbury has been able to provide, on average, 18% EPS growth when SAAR has been flat since 2004. This is, in part, due to consolidation and operational leverage. Most auto dealers have vertically integrated into used cars, parts/service, and financing/insurance—and most new cars are financed by inexpensive floor plan financing.
Asbury has utilized the local scale model to generate higher margins (6.2% EBITDA) and inventory turns (6.4x) than comparable US automotive dealers (Lithia, AutoNation, Penske, and Group 1). The higher margins are, in part, due to the larger portion of luxury dealerships in the mix versus other US dealerships. Inventory turns are also important in the auto retailing business. Asbury has the highest inventory turns—at 6.4 times per year—amongst the US car dealers, which range from 4.4 to 6.0 times per year. Quicker inventory turns mean that the dealer is matching the customers to cars more quickly than its competitors. This ability allows Asbury to either sell fewer cars than competitors or to lower prices and obtain the same return on invested capital. Asbury has a higher return on equity than US competitors from both higher margins and inventory turns.
Downside Protection
Auto dealer risks include both operational leverage and financial leverage. One way to measure operational risk in automotive dealerships is the “absorption” ratio, which measures how closely the firm’s gross profits (assuming no new car sales) cover the firm’s selling, general, and administrative costs. Of the US automotive dealers, Asbury has one of the highest absorption ratios (125%) and thus one of the lowest amounts of operational leverage.
Financial leverage can be measured by the debt/EBITDA ratio. Although Asbury has a higher debt/EBITDA than other US dealers, it has a relatively low debt/EBITDA ratio of 2.19. Asbury has also done well in the US auto recession of FY2020. Over this year, Asbury’s revenues declined by 1%, while Lithia had an increase of 3%, and AutoNation, Group 1, CarMax, and Penske’s revenues ranged from a decline of 4% to a decline of 12%. Asbury’s EPS increase over the past year has been in the middle of the pack (+36%)—where EPS increases ranged from 3% to 46% for US automobile dealers—despite Asbury having higher margins than the US automobile dealers.
The coronavirus hit near-term sales and earnings but, over the intermediate and longer term, the quality franchises, like Asbury, should be the first to emerge from the shutdowns and be in a stronger position versus the less profitable and more highly levered competitors. In China, there are reports of higher demand (due to an aversion to mass transit) and one high-RoE dealer, China MeiDong, is actually up by about 25% from year-end 2019.
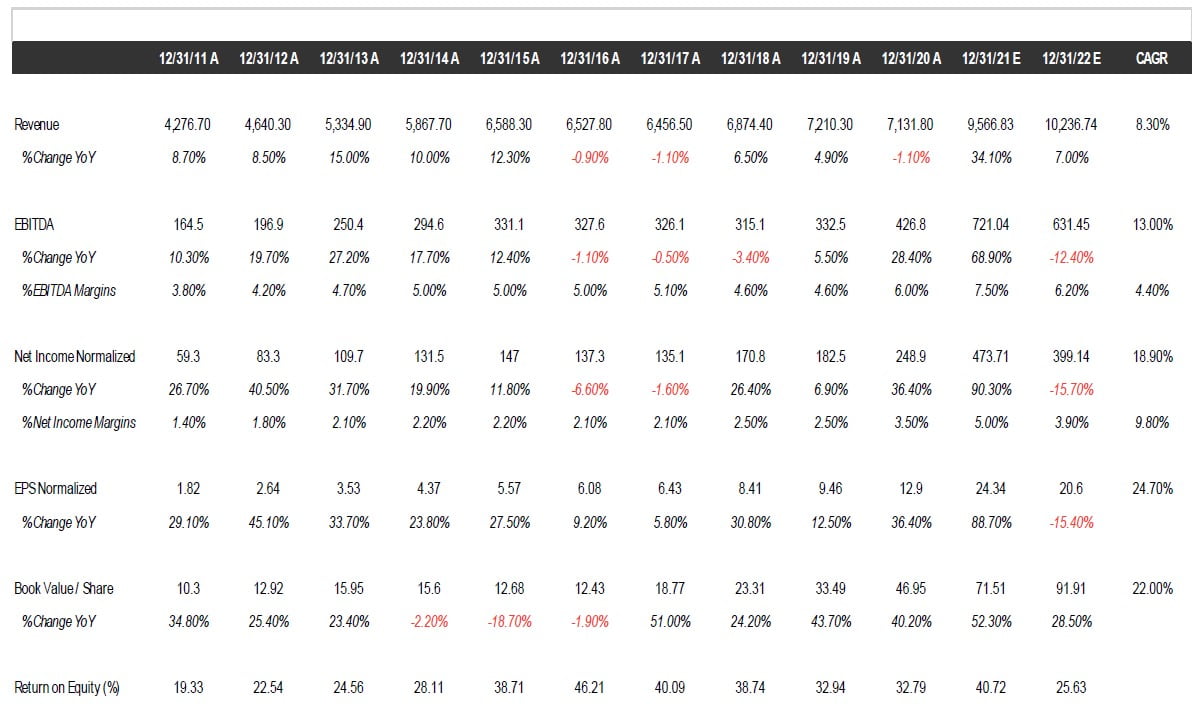
The history and projected financial performance for Asbury is illustrated below.
Management and Incentives
Asbury’s management has alternatively purchased dealerships when the right dealership was available at the right price financed by debt, paid down debt, repurchased common stock, and developed Asbury’s technology for internet distribution (Clicklane). Asbury has a unique structure, as a capital allocation committee is part of the board of directors. The CEO currently holds 49,680 shares ($9.7 million), which is more than five times his 2020 salary and bonus of $931,731. Other top-level executives are required to hold 3x their base salary in Asbury stock. The CEO’s compensation is structured as 30% base pay and 70% incentive, with 60% of incentive being performance-based and 40% being time-based. The cash incentive pay is based upon EBITDA growth at various levels of US car sales. The performance-based incentive pay is based upon three-year EPS growth, operating margin, same-store parts/service GP growth, and same-store used car sales overlaid with US automobile dealer relative shareholder returns. Asbury grants 1.1% of its shares outstanding for option grants in each year.
Valuation
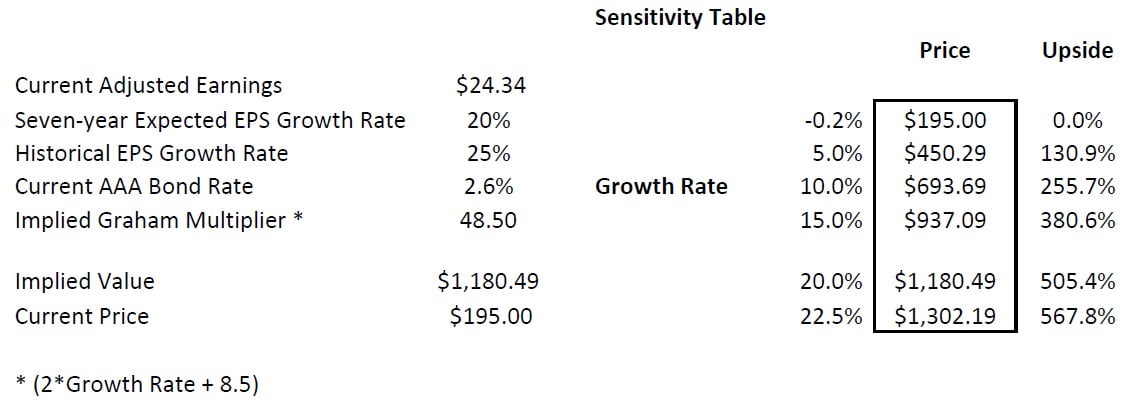
The key to the valuation of Asbury is the expected growth rate. The current valuation implies an earnings/FCF decline of 0.2% into perpetuity using the Graham formula ((8.5 + 2g)) with the conservative assumption that the AAA bond rate will revert to a value of 4.4% over the long term. The historical 10-year earnings growth has been 25% per year including acquisitions and the current return on equity of 33%.
A bottom-up analysis based upon market growth rates of US automotive dealer market results was used to estimate an organic growth rate of 1.5% for Asbury. The five-year growth rate of US automotive dealer sales per IBIS is 0.8%, and IBIS projects a 1.5% annual growth rate going forward. Over the past five years, Asbury has grown sales by 7.9% per year, 7.1% in excess of the market growth rate. This excess is due primarily to acquisitions, but same-store sales growth also contributed to growth. Over the next five years, Asbury has plans to increase the historical revenue growth rate via acquisition (10% unit growth), same-store sales growth (2%), and the use of the internet via Clicklane (10% per year additional sales). As a benchmark for the internet growth, Asbury has increased sales by 20% annually over the first six months of 2021. These forward estimates are less than Lithia’s—one US dealer comparable—forecasted growth of 30% per year which has similar revenue growth drivers. If we assume modest operational leverage of 40% increase in margin for doubling in revenue, use a lower operating margin starting point of 3.8%, then the implied EPS growth rate is about 20%. We would expect operational leverage given Asbury’s local clustering strategy, which takes advantage of local economies of scale as revenue grows. This EPS growth rate is conservative given the historical EPS growth rate of 25%, the doubling of operating margins with a doubling of revenue, and the current 33% return on equity with all the current earnings being retained. The resulting current multiple is 49x while Cambria trades at an earnings multiple of 8x. If we look at firms in different markets (Lithia and MeiDong) with similar high-growth prospects, they have earnings multiples of 11 to 40x. If we apply 20x earnings to Asbury’s estimated FY2021 earnings of 24.23, then we arrive at a value of $485 per share, which is a reasonable short-term target. If we use a 20% seven-year growth rate, then we arrive at a value of $1,180 per share. This results in a five-year IRR of 43%.
Growth Framework
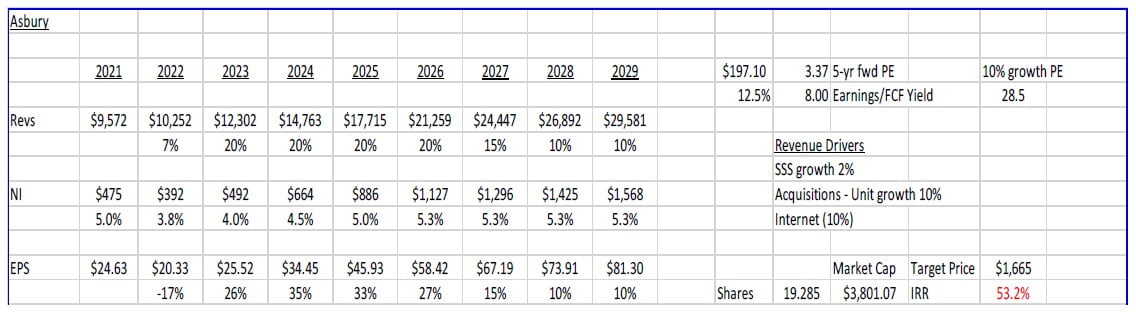
Another way to look at growth and the valuation of companies is to estimate the future EPS of FCF/share five years in the future and see how much of today’s price incorporates this growth. Using the same revenue and operational leverage described above results in a 2026 EPS of $58.42, or 3.4x the current price. If we assume a steady-state growth rate from 2026 on of 5%, then this results in a fair value Graham multiple of 18.5x or a $1,080 per share similar to the five-year forward valuation above of $1,180 per share.
Comparables
Below are the US and international firms engaged in the car dealership market that have high returns on equity.
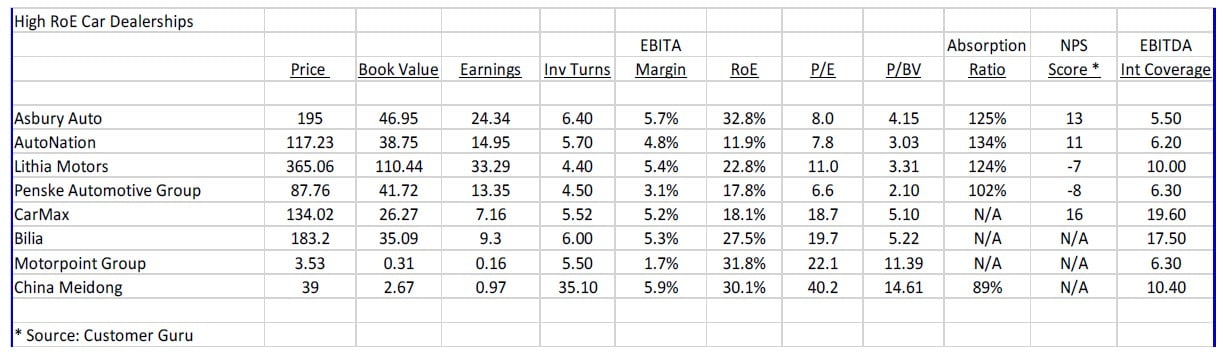
Benchmarking
Compared to other US automotive dealer groups, Asbury has the highest EBITDA margins and return on equity. Asbury also has a high absorption ratio, which measures operational leverage, and a reasonable EBITDA interest coverage ratio. The EBITDA coverage ratio for Asbury is on the low end of these comps but is in the range of a BBB credit. Amongst traditional dealers, Asbury has the highest NPS score, per Customer Guru.
Risks
The primary risks are:
- lower demand due to coronavirus;
- lower-than-expected growth in sales and earnings due to delayed opening of new dealerships; and
- a lack of new investment opportunities (mergers and acquisitions or new dealerships).
Potential Upside/Catalyst
The primary catalysts are:
- higher-than-expected car sales/demand (like we are seeing in Wuhan);
- purchase by a US dealership consolidator; and
- increased local scale or purchase of local scale in new markets.
Timeline/Investment Horizon
The short-term target is $450 per share, which is almost 84% above today’s stock price. If the consolidation thesis plays out over the next five years (with a resulting 5% FCF earnings per year), then a value of $1,080 could be realized. This is a 43% IRR over the next five years.


