
The US dollar has begun a counter-trend rally which should last for several months. As precious metals investors, why should we care about what happens to the dollar?
The coming advance may put downward pressure on the precious metals throughout its duration. Despite increased use worldwide of alternative currencies such as the Chinese yuan and special drawing rights (SDR’s) from the World Bank in recent years, the U.S. dollar is still to this day considered the world’s reserve currency. And while, from the country’s founding in 1776 through the abolishment of the Bretton Woods Agreement in 1971, the U.S. dollar was officially backed by gold, since that time the U.S. currency remains unbacked by any tangible commodity. In essence, gold and silver now serve as competing currencies to the U.S. dollar.
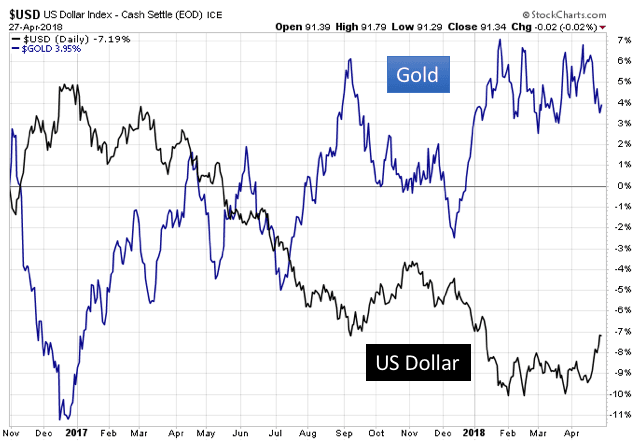
We need look no further than the relative price action between gold and the greenback over the preceding 18 months to see the inverse relationship. While the negative correlation between the two assets is not perfect, it is strong enough in its impact that as precious metals investors it would behoove us to regularly monitor the relationship:
U.S. Dollar Breaks Downtrend
Below we show the U.S. dollar index, which measures the dollar versus a basket of international currencies, from 2014 to the present. From the peak at 103.5 down to the recent low of 88.2 on the index, the dollar has lost nearly 15% of its value versus many foreign currencies over the last year and a half. Yet importantly, note how the dollar has broken higher from the nearly 18-month downtrend (dashed blue line) just last week, which defined the trajectory of the currency’s weakness since the top in December 2016:
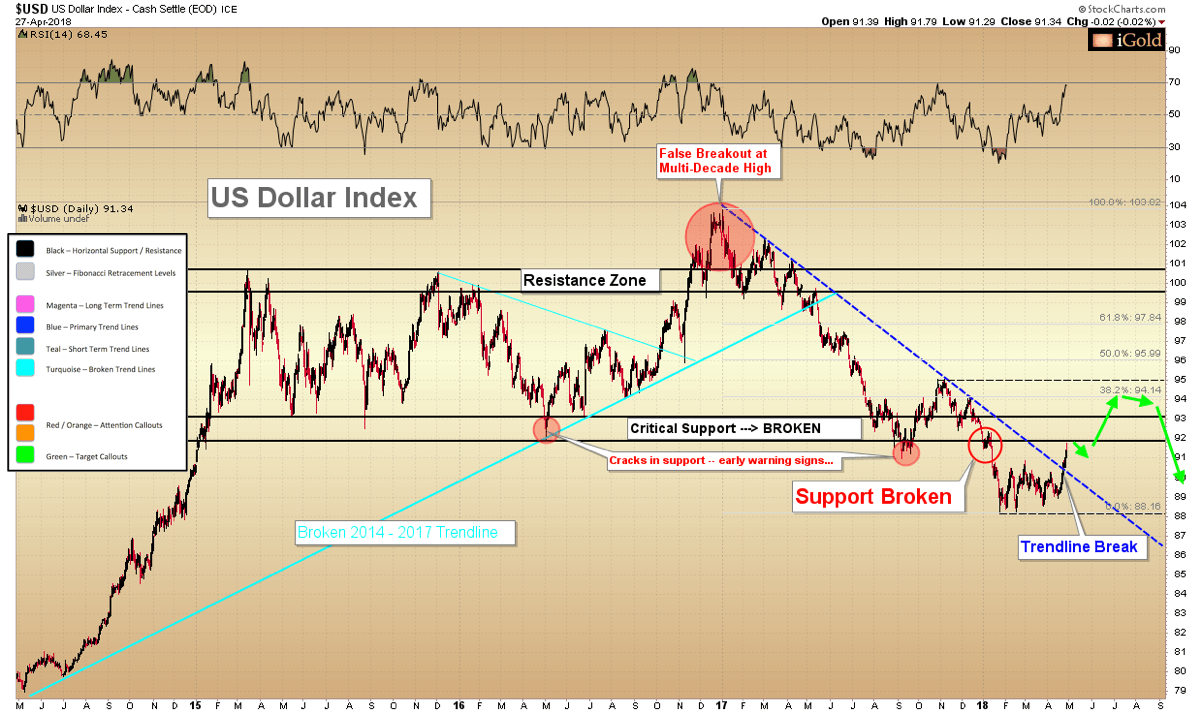
This trendline break is significant. When a clear trend which has defined a nearly one-way trade lasting over a year is negated, it argues that an asset is set to change its direction, at least over the short term. Note, for example, the significance of the trendline break in the opposite direction that occurred in March 2017 (turquoise line), which defined the 2014 – 2017 advance. A counter-trend rally in the U.S. dollar is probable at this juncture, lasting for several months. Precious metals investors should take note that gold and silver may be under pressure during this time. The key question now is: how far will the dollar advance?
Rally Should Be Counter-Trend
We maintain that the dollar has formed a significant long-term top, and that the coming rally should be counter-trend in nature. After an intermediate-term advance, the dollar should continue to see selling pressure resume. Why do we expect that the dollar is in a primary decline and that any advance will be counter-trend in nature? Below we examine a monthly momentum indicator called the relative strength index for the dollar dating back to 1987. Note the significance of the monthly overbought reading followed by negative divergence with the price (top of chart) which occurred in the year 2000. Following this signal and when the dollar subsequently peaked in early 2002, a six-year decline ensued which saw the dollar fall from 120 on the index to 72, a loss of 40%.
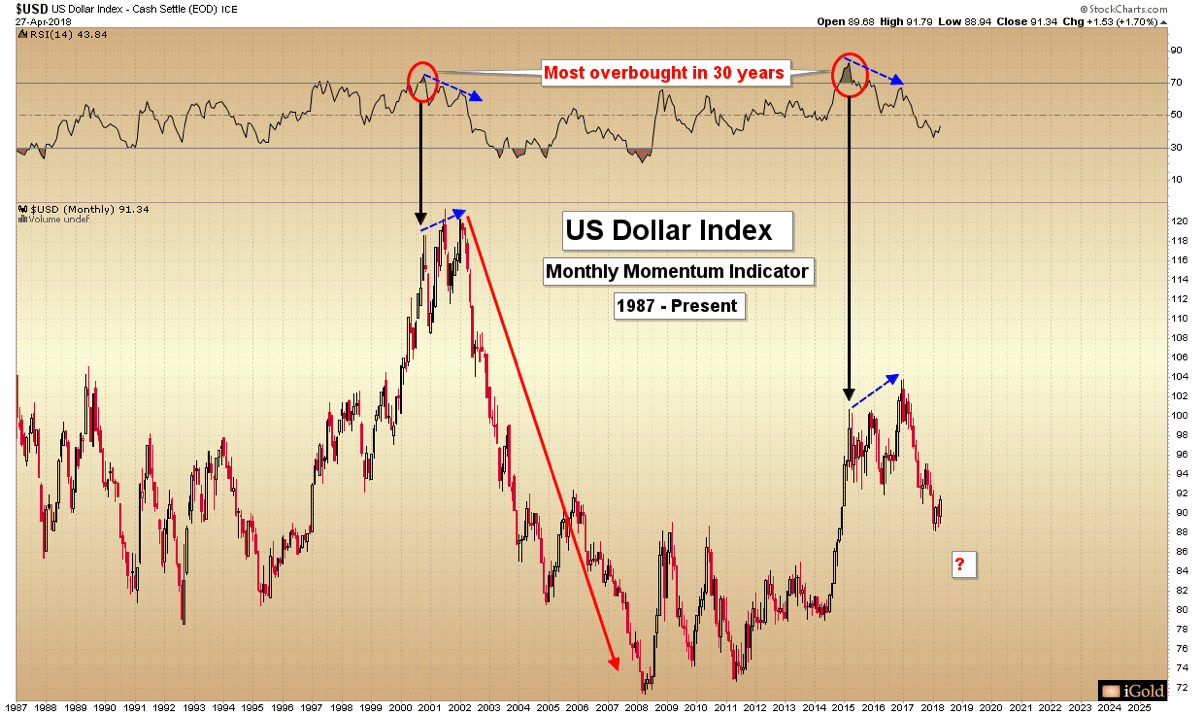
Fifteen years later, in 2015 the dollar registered an overbought reading even more extreme than that observed in 2000. Again, negative divergence was observed between price and momentum from 2015 through early 2017. And once again, in January 2017 the dollar began its significant decline.
The key is that monthly overbought momentum readings of this magnitude are rare. Only two signals have occurred in the past 30 years. The last signal of this nature saw the dollar decline by 40% over six years. The present reading was even more extreme than the 2000 – 2002 example. Our best assessment is that the main trend will remain lower for the dollar for the foreseeable future. Increased U.S. budget and trade deficits amidst Federal Reserve tightening policy which is behind the inflation curve are likely to be primary causes.
Targets for Dollar Rally
Refer again to the second chart of this article, the intermediate-term view of the dollar from 2014 – present. There is a strong confluence of resistance (expected sellers) for the U.S. dollar visible on the chart between the 93 – 95 zone. This is where we expect the next dollar top to form:
- First, the now-broken critical support zone between 92 – 93 (black callout) which held the dollar higher for nearly three years. When a support zone of this nature is decisively broken, we expect underwater traders who previously bought dollars in this region to sell on the next approach.
- Second, the 38.2% Fibonacci retracement of the entire 2017 – 2018 decline comes in at 94.1 on the index.
- Third, the November 2017 peak at 95 on the index represents a clear short-term resistance level.
In sum, we have a confluence of three distinct resistance levels between 93 – 95 for the U.S. dollar. When multiple resistance levels fall within a proximal distance, this gives us a high-probability target zone for a top to form.
The Dollar Going Forward
Having broken its primary downtrend which defined the 2017 – 2018 decline, the dollar is showing clear signs that an intermediate-rally is set to unfold. However, this rally should be counter-trend in nature. The big picture shows that the dollar will have more room to fall over the coming years.
Still, likely targets for the dollar over the coming months include an advance up to 93 – 95 on the dollar index. While gold does not always move opposite to the US dollar, precious metals investors may be presented with better buying opportunities in the months ahead as the dollar approaches its next peak. After reaching one or more of these counter-trend targets, we expect the dollar to come under renewed selling pressure and for the primary downward trend to continue. We will watch for this scenario by mid/late 2018.
Christopher Aaron
Bullion Exchanges Market Analyst
Christopher Aaron has been trading in the commodity and financial markets since the early 2000’s. He began his career as an intelligence analyst for the Central Intelligence Agency, where he specialized in the creation and interpretation of pattern-of-life mapping in Afghanistan and Iraq. His strategy of blending behavioral and technical analysis has helped him and his clients to identify both long-term market cycles and short-term opportunities for profit.
This article is provided as a third party analysis and does not necessarily matches views of Bullion Exchanges and should not be considered as financial advice in any way.


