
U.S. consumer sentiment just dropped from a near record-high to its lowest level in eight years.

Q4 2019 hedge fund letters, conferences and more
A new Refinitiv Ipsos survey conducted on March 24-25 finds that U.S. consumer sentiment fell sharply in the past few weeks, in the environment of the COVID-19 pandemic. Additionally, two thirds of adults surveyed say that, compared to six months ago, they are less comfortable making a major purchase like a home or a car (67%) and other household purchases (66%).
Jharonne Martis, Director of Consumer Research at Refinitiv, said, “More U.S. consumers are filing for unemployment due to the coronavirus pandemic. This is causing the overall Refinitiv Ipsos consumer sentiment to decline as consumers worry about their current conditions, employment and financial investments.”
Here are the detailed findings:
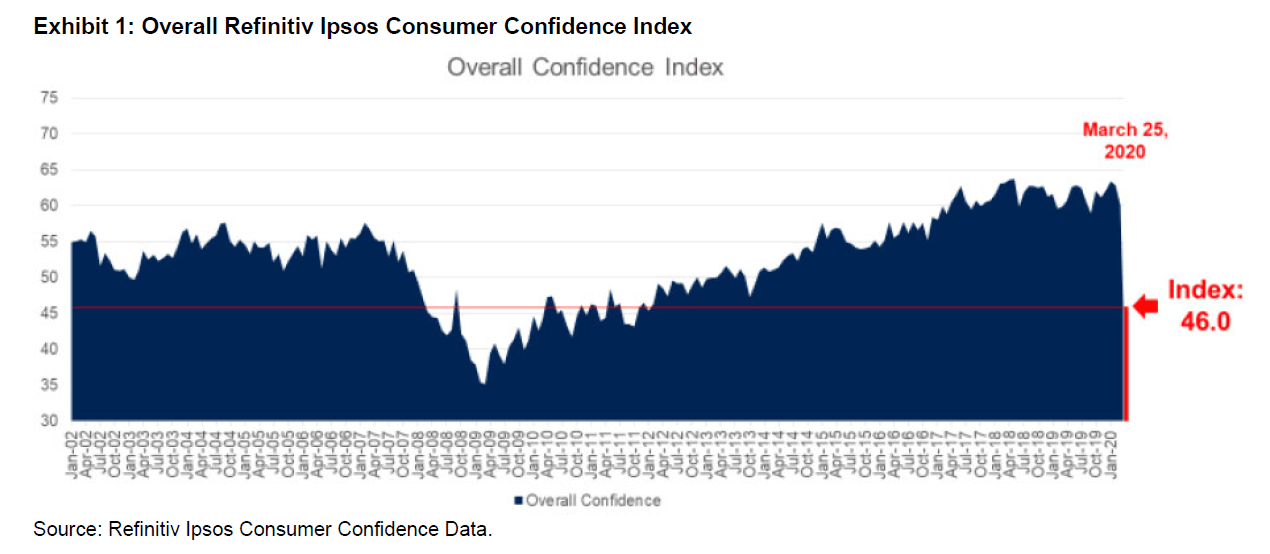
- With an index score of 46.0, overall consumer confidence this week is almost 15 points lower than it was just a few weeks ago (60.9).
- The drop in overall U.S. consumer sentiment is most driven by a decline in confidence about current conditions, the jobs situation and outlook, and the investment climate.
- Today, 67% say they are less comfortable making a major purchase, like a home or car, compared to six months ago.
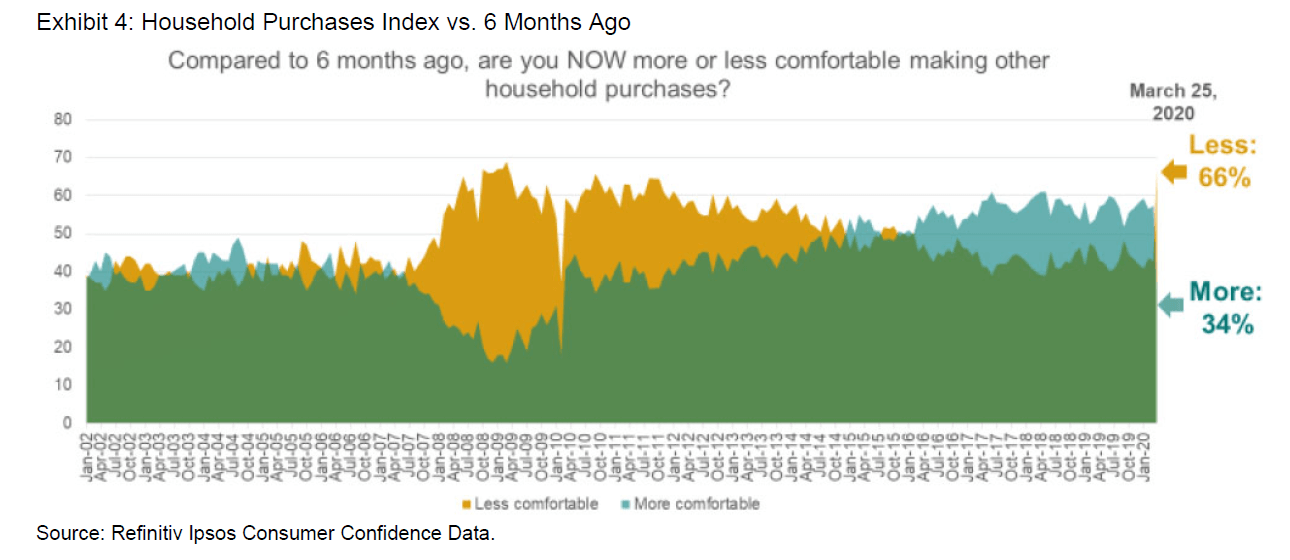
- Compared to six months ago, 66% say they are less comfortable making another major purchase now.
Overall Consumer Confidence
With an index score of 46.0, overall consumer confidence this week is almost 15 points lower than it was just a few weeks ago (60.9) (Exhibit 1).
- In the 18 years since Ipsos started tracking U.S. consumer confidence, no such precipitous drop had ever been recorded.
- Americans’ consumer sentiment has not been this low since January 2012.
- The current index is more than six points lower than the historical average of 52.6, but still more than 10 points higher than it was a few months after the 2008 financial crisis.
The Drop in Consumer Confidence
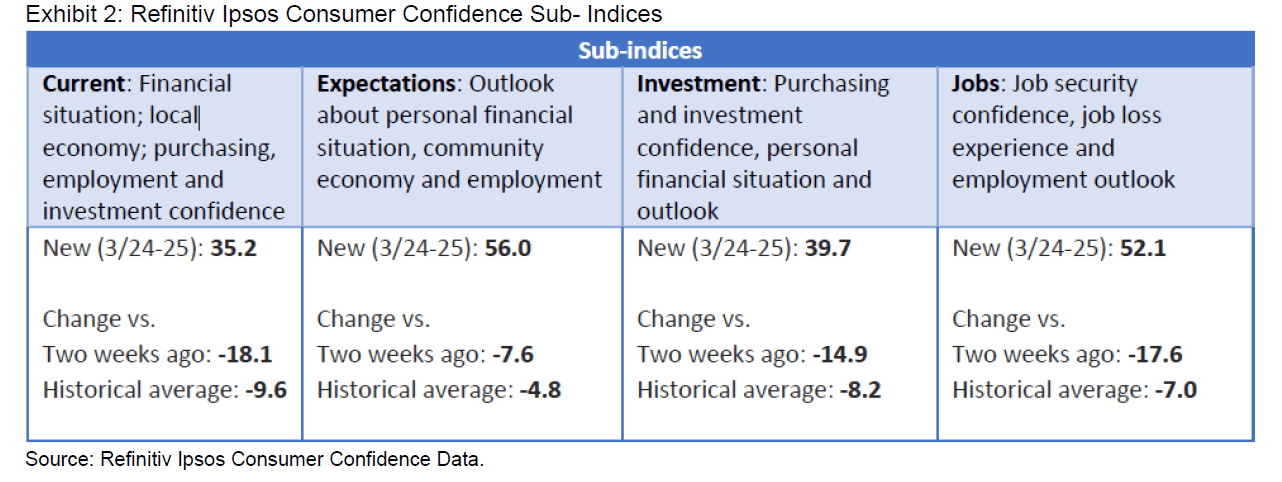
The drop in overall U.S. consumer sentiment is most driven by a decline in confidence about current conditions, the jobs situation and outlook, and the investment climate.
- The current, jobs and investment sub-indices all show score drops in the 15 to 18-point range since earlier this month and negative differences of seven to 10 points vs. its average since 2002.
- Signaling that Americans remain hopeful, the expectations sub-index (56.0) shows a lesser drop than the other sub-indices (under 8 points) and is “only” about 5 points lower than its historical average.

Major Purchases
Today, 67% say they are less comfortable making a major purchase, like a home or car, compared to six months ago.
- This is up 19 points from earlier this month (48%) and the highest it’s been in eight years
U.S. Consumer Sentiment Weighs On Household Purchases
Compared to six months ago, 66% say they are less comfortable making another major purchase now.
- This is up 23 points from earlier this month (43%) and the highest it’s been in 10 years
Questions
The data used for the Consumer Confidence index and sub-indices is based on the following questions:
- Now, thinking about our economic situation, how would you describe the current economic situation in US? Is it… very good, somewhat good, somewhat bad or very bad?
- Rate the current state of the economy in your local area using a scale from 1 to 7, where 7 means a very strong economy today and 1 means a very weak economy.
- Looking ahead six months from now, do you expect the economy in your local area to be much stronger, somewhat stronger, about the same, somewhat weaker, or much weaker than it is now?
- Rate your current financial situation, using a scale from 1 to 7, where 7 means your personal financial situation is very strong today and 1 means it is very weak
- Looking ahead six months from now, do you expect your personal financial situation to be much stronger, somewhat stronger, about the same, somewhat weaker, or much weaker than it is now?
- Compared to 6 months ago, are you NOW more or less comfortable making a major purchase, like a home or car?
- Question compared to 6 months ago, are you NOW more or less comfortable making other household purchases?
- Compared to 6 months ago, are you NOW more or less confident about job security for yourself, your family and other people you know personally?
- Compared to 6 months ago, are you NOW more or less confident of your ability to invest in the future, including your ability to save money for your retirement or your children’s education?
- Thinking of the last 6 months, have you, someone in your family or someone else you know personally lost their job as a result of economic conditions?
- Now look ahead at the next six months. How likely is it that you, someone in your family or someone else you know personally will lose their job in the next six months as a result of economic conditions?
- For some consumers, owning a vintage luxury bag might seem a better investment than the stock market at the moment.
About the Study On U.S. Consumer Sentiment
These findings are based on data from an Ipsos survey conducted March 24-25, 2020 with a sample of 970 adults aged 18-74 from the continental U.S., Alaska and Hawaii who were interviewed online in English.
The sample was randomly drawn from Ipsos’ online panel (see https://www.ipsos.com/sites/default/files/2017-03/Ipsos_IIS_NAAccessPanelsRecruitment_.pdf), partner online panel sources, and “river” sampling (see https://www.ipsos.com/sites/default/files/AAPOR-Online-sources-2018.pdf) and does not rely on a population frame in the traditional sense. Ipsos uses fixed sample targets, unique to each study, in drawing a sample. After a sample has been obtained from the Ipsos panel, Ipsos calibrates respondent characteristics to be representative of the U.S. Population using standard procedures such as raking-ratio adjustments. The source of these population targets is U.S. Census 2016 American Community Survey data. The sample drawn for this study reflects fixed sample targets on demographics. Post-hoc weights were made to the population characteristics on gender, age, race/ethnicity, region, and education.
Statistical margins of error are not applicable to online non-probability polls. All sample surveys and polls may be subject to other sources of error, including, but not limited to coverage error and measurement error. Where figures do not sum to 100, this is due to the effects of rounding. The precision of Ipsos online polls is measured using a credibility interval. In this case, the poll has a credibility interval of plus or minus 3.5 percentage points for all respondents. Ipsos calculates a design effect (DEFF) for each study based on the variation of the weights, following the formula of Kish (1965). This study had a credibility interval adjusted for design effect of the following (n=970, DEFF=1.5, adjusted Confidence Interval=+/-5.0 percentage points).
Findings from previous time periods going back to March 2011 are based on data from Refinitiv /Ipsos’ Primary Consumer Sentiment Index (PCSI) collected in a monthly survey on Ipsos’ Global Advisor online survey platform with the same questions. For the PCSI survey, Ipsos interviews a total of 1,000+ U.S. adults aged 18-74. The Refinitiv/Ipsos Primary Consumer Sentiment Index (PCSI), ongoing since 2010, is a monthly survey of consumer attitudes on the current and future state of local economies, personal finance situations, savings and confidence to make large investments. The PCSI metrics reported each month consist of a “Primary Index” based on 10 questions available upon request and of several “sub-indices” each based on a subset of these 10 questions. Those subindices include a Current Index, an Expectations Index, an Investment Index and a Jobs Index.
Findings for January 2002- February 2011 are based on data from the RBC CASH Index, a monthly telephone survey of 1,000 U.S. adults aged 18 and older conducted by Ipsos with a margin of error of +/- 3.1 percentage points.


