
While the U.S. 10-Year real yield is at its highest level since 2010, gold remains uplifted. Despite this outperformance, the pair should reconnect again.
Real Problems
With gold and mining stocks enjoying oversold bounces on Sep. 27, the pace of the PMs’ recent drawdowns was poised to normalize at some point. Also, since asset prices don’t move in a straight line, daily declines of 1% or more often result in countertrend rallies along the way.
Q2 2022 hedge fund letters, conferences and more
However, with the PMs’ medium-term technical and fundamental outlooks supremely ominous, a hawkish Fed, higher real yields, and a stronger USD Index are poised to inflict more pain. To explain, I wrote on Apr. 11:
With real interest rates poised to turn positive in the coming months, gold should suffer profoundly once its war premiums unravel.
The historical fundamental playbook shows:
- When a crisis erupts, the Fed cuts interest rates and commences QE;
- Real yields turn deeply negative;
- Gold rallies sharply;
- The Fed normalizes monetary policy, real yields surge, and gold plunges.
Please see below:
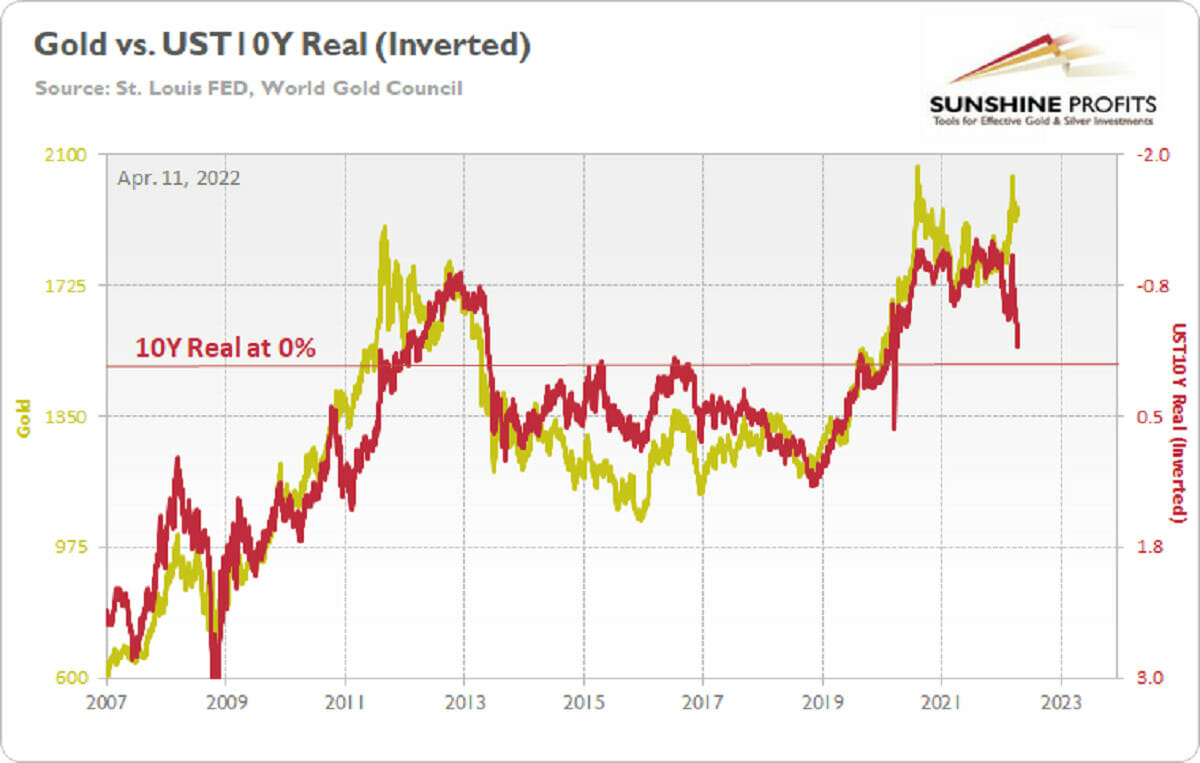
To explain, the gold line above tracks the price tallied by the World Gold Council, while the red line above tracks the inverted U.S. 10-Year real yield.
For context, inverted means that the latter’s scale is flipped upside down and that a rising red line represents a falling U.S. 10-Year real yield, while a falling red line represents a rising U.S. 10-Year real yield.
Moreover, while I’ve shown variations of this chart before, the long-term implications are profound. For example, if you analyze the left side of the chart, you can see that the U.S. 10-Year real yield soared and gold plunged during the global financial crisis (GFC).
However, when the Fed launched QE and the U.S. 10-Year real yield sank to an all-time low, gold hit a new all-time high along the way.
Furthermore, the current situation is a spitting image. When Fed Chairman Jerome Powell performed a dovish pivot in late 2018, the U.S. 10-Year real yield suffered. Then, when the Fed fired its liquidity bazooka in March 2020, it pushed the metric to another all-time low. And surprise, surprise, gold hit another all-time high.
However, we’re now in stage four of the historical fundamental playbook. With the Fed normalizing policy, the U.S. 10-Year real yield has surged in recent weeks. Moreover, the Fed needs to push the metric above 0% to curb inflation.
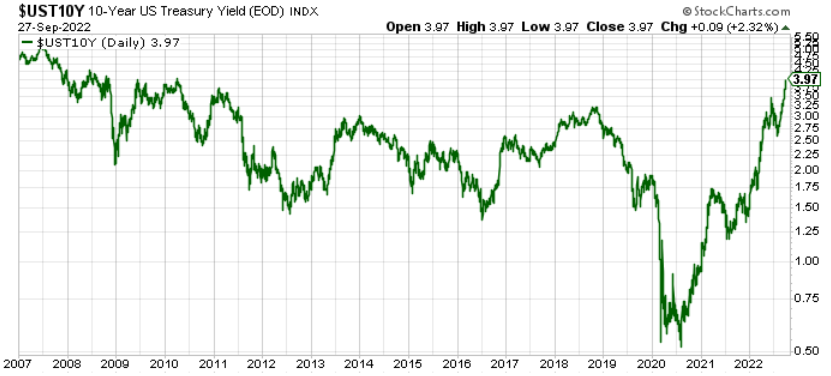
To that point, with long-term Treasuries continuing their sell-offs on Sep. 27, the U.S. 10-Year Treasury yield closed at another 2022 high of 3.97%.
Please see below:
More importantly, the U.S. 10-Year real yield ended the Sep. 27 session at 1.64%, its highest level since 2010. Therefore, my prediction has proved prescient, even though gold has been a relative outperformer amid the chaos.
Please see below:
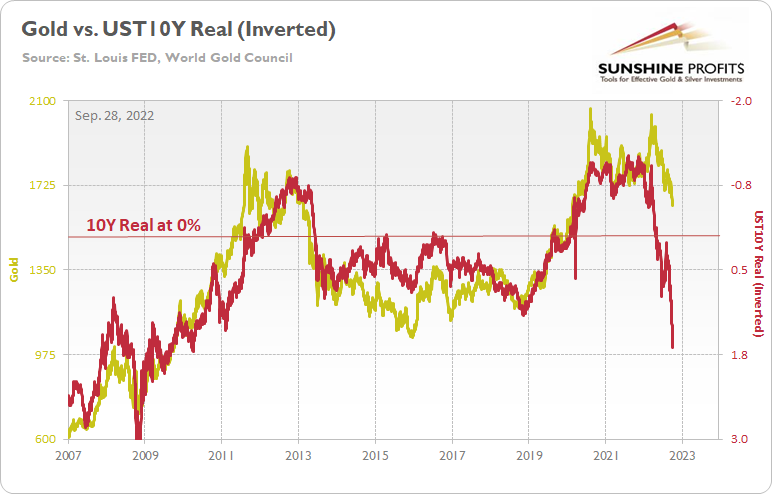
To explain, the U.S. 10-Year real yield is at its highest level in a decade-plus, while gold is relatively uplifted. Furthermore, a U.S. 10-Year real yield of 0% implies a gold price of $1,500, while the current reading of 1.64% should have gold south of $1,300.
So, what gives?
Well, for one, it’s not uncommon for assets to operate with a lag, meaning that gold will reconnect with the U.S. 10-Year real yield at some point, only the timing remains uncertain. As evidence, remember when I presented this chart throughout 2021 and 2022?
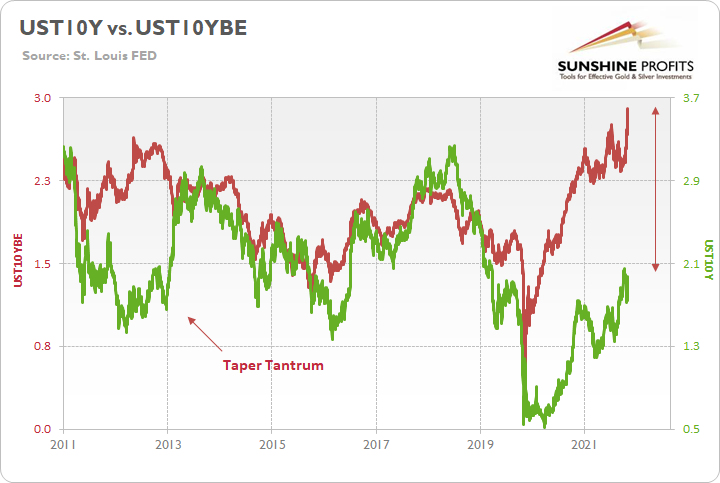
To explain, the green line above tracks the U.S. 10-Year Treasury yield, while the red line above tracks the U.S. 10-Year breakeven inflation rate. The unprecedented gap on the right side of the chart shows how a low nominal rate (the green line) and a high breakeven rate (the red line) created a major imbalance and pushed the U.S. 10-Year real yield into deeply negative territory.
For context, the latter sank to an all-time low of -1.17% in August 2021 and hit -1.04% on Mar. 8 during the Russia/Ukraine conflict.
However, significant imbalances don’t last forever. In fact, if you analyze the middle of the chart, you can see that the two lines reconnected after the 2013 taper tantrum and remained in contact for years after that.
Therefore, when the U.S. 10-Year real yield hit 0% in April 2022, the reconnection was complete, and the 2020-2022 imbalance was erased.
As such, we find ourselves in an identical situation now. While gold has outperformed the U.S. 10-Year real yield, the pair should reconnect once again; and with the Fed forced to play catch-up due to 40+-year high inflation, gold is much more likely to collapse than the U.S. 10-Year real yield. Remember, I wrote the Fed needs to push the metric above 0% to curb inflation.
However, there is no magic real yield that sinks inflation. In reality, the Fed needs to keep pushing the metric higher until progress materializes. Moreover, I noted that Powell understands this and made the point for me during his June FOMC press conference.
Please see below:
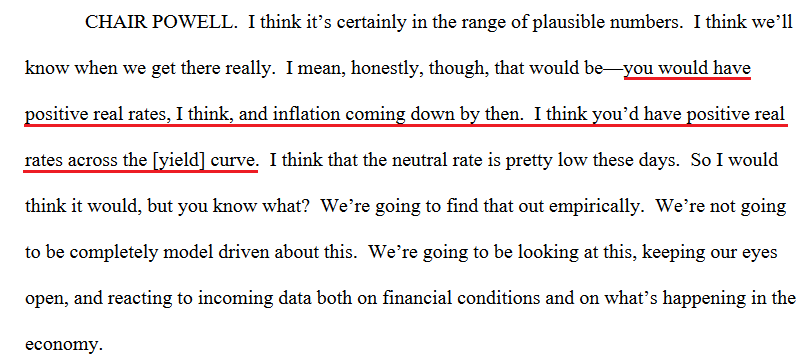
Source: U.S. Fed
Thus, while Powell has achieved his objective of “positive real rates across the [yield] curve,” it only matters if real rates are high enough to reduce demand and alleviate inflation. If not, they need to go higher.
To that point, with the Cleveland Fed projecting the headline and core Consumer Price Indexes (CPI) to rise by 8.20% and 6.64% year-over-year (YoY) in September, the metrics are nowhere near normalized.
As a result, the U.S. 10-Year real yield has the wind at its back, and gold should fall to restore the imbalance.
Please see below:
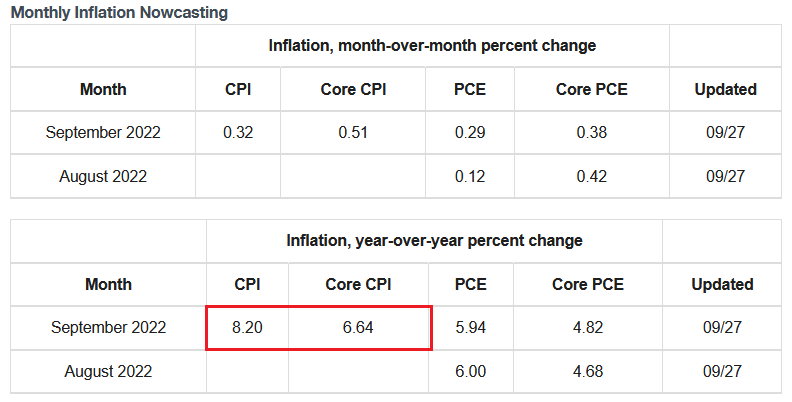
Source: Cleveland Fed
Also, please note that while gold has showcased immense resiliency in the face of elevated real yields and a soaring USD index, the GDXJ ETF hasn’t been so lucky.
Please see below:
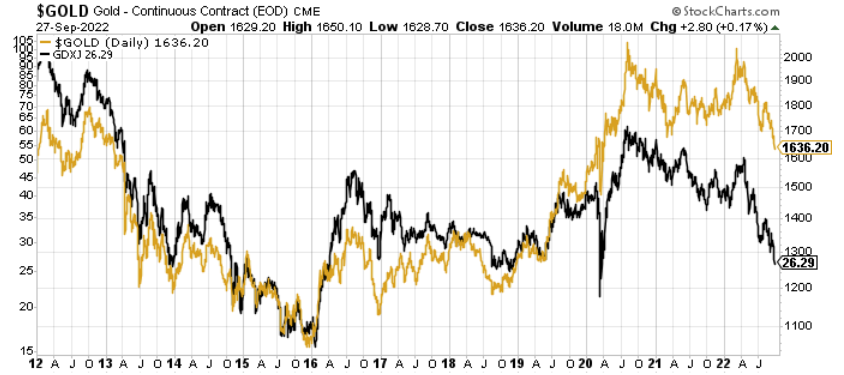
To explain, the gold line above tracks the gold futures price, while the black line above tracks the GDXJ ETF. If you analyze the relationship, you can see that the pair remained close pre-pandemic.
Conversely, with the junior miners materially underperforming gold post-pandemic, shorting the GDXJ ETF has proven profoundly wise and lucrative, as the junior miners have followed the real-yield roadmap to a greater extent.
In addition, the USD Index paints a similar portrait.
Please see below:
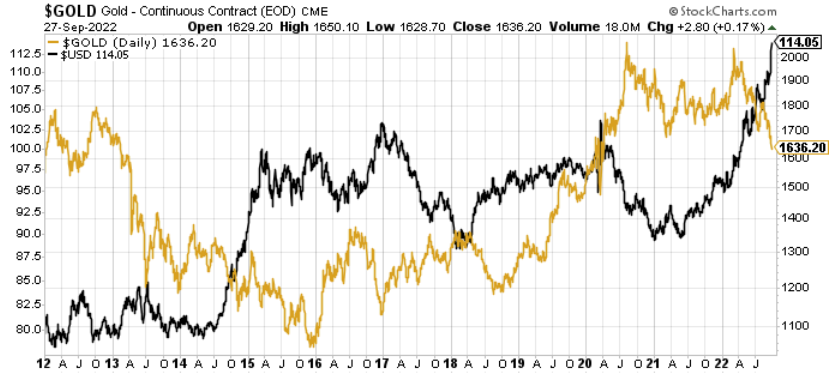
To explain, the gold line above tracks the gold futures price, while the black line above tracks the USD Index. If you analyze the middle of the chart, you can see that when the USD Index hit its ~2017 high, gold sank below $1,200.
However, while the USD Index closed well above its ~2017 high on Sep. 27, the yellow metal is much higher.
In contrast, the GDXJ ETF’s price action has been more formulaic.
Please see below:
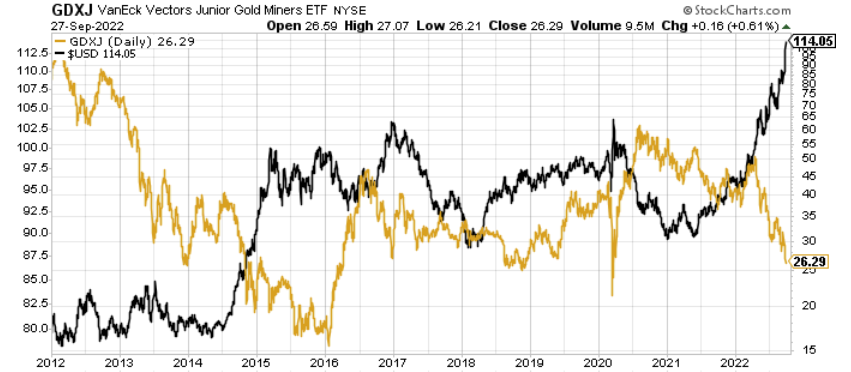
To explain, the gold line above tracks the GDXJ ETF, while the black line above tracks the USD Index. If you analyze the right side of the chart, you can see that the junior miners’ Sep. 27 closing price is much nearer the low set when the USD Index hit its ~2017 high. Thus, it’s another example of why choosing the right asset to short is just as important as being correct in your investment thesis.
Hawk Talk
With Fed officials back to parroting Chairman Jerome Powell’s future plans, his deputies reiterated his hawkish message. For example, Cleveland Fed President Loretta Mester said on Sep. 26:
“We have to understand that inflation is going to be continuing to be hard to predict (…). We can’t have wishful thinking replace really compelling evidence. So before I conclude that inflation has peaked, I will need to see several months of declines in the month-over-month (MoM) readings.”
As a result, Mester was ominously honest about the economic challenges that lie ahead.
Please see below:
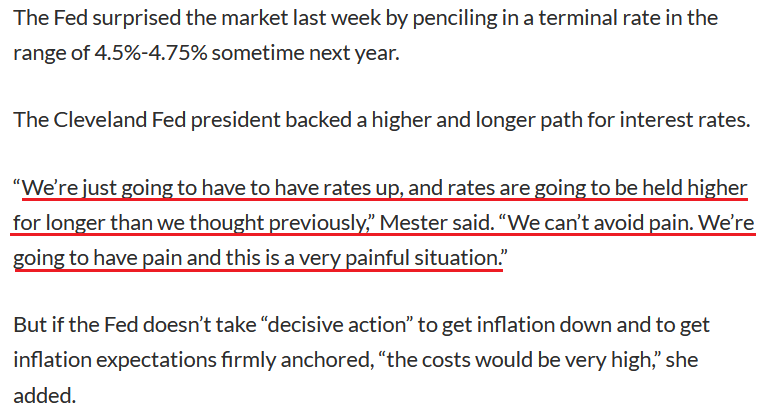
Source: MarketWatch
Likewise, St. Louis Fed President James Bullard said on Sep. 27:
“[Inflation] is a serious problem and we need to be sure we respond to it appropriately. We have increased the policy rate substantially this year and more increases are indicated.”
He added that the U.S. federal funds rate (FFR) may need to reach “the 4.5% range,” as inflation is more resilient than Fed officials expected. As such, with the U.S. labor market on solid footing, officials remain focused on the other half of their dual mandate.
Please see below:
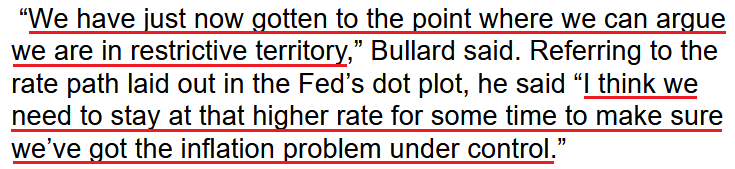
Source: Bloomberg
Finally, Chicago Fed President Charles Evans said on Sep. 27 that “My own viewpoint is roughly in line with the median assessment” from the Summary of Economic Projections (SEP).
“I had a sobering assessment that we’ve got more work ahead,” Evans said. “I’m optimistic that the peak that we’ve set out is going to be sufficiently restrictive that it could be enough.”
Thus, while I warned for months that reality would re-emerge, suddenly, a 4.5% FFR is the low-end of the consensus range.
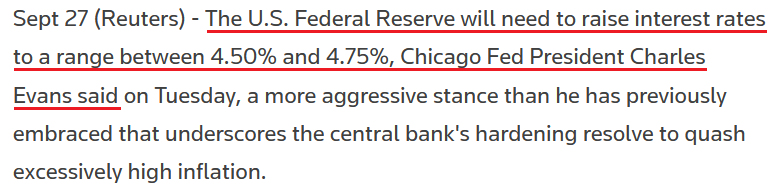
Source: Reuters
The Bottom Line
While gold has relatively outperformed the U.S. 10-Year real yield and the USD Index, the GDXJ ETF has not. Moreover, the prior imbalance between the U.S. 10-Year Treasury and breakeven inflation rates is a cautionary tale of how history is undefeated.
Therefore, the yellow metal should reconnect with the U.S. 10-Year real yield at some point, and we expect the normalization to occur through lower gold prices.
Furthermore, with Fed officials hawked up and pressing ahead with further rate hikes, the medium-term outlooks are bullish for the USD Index and the U.S. 10-Year real yield. Absent short-term sentiment rallies, gold, silver, and mining stocks should struggle in the following weeks and months.
In conclusion, the PMs were mixed on Sep. 27, as silver ended the day in the red. However, while oversold conditions may provide some short-term relief, the medium-term implications are unchanged: the precious metals remain in downtrends, and the technicals and the fundamentals signal lower lows in the months ahead.
While I’m not making any promises with regard to price moves or profitability, in my opinion, the above also indicates that profits on our short positions in junior mining stocks are going to increase even further.
Thank you for reading our free analysis today. Please note that the above is just a small fraction of today’s all-encompassing Gold & Silver Trading Alert. The latter includes multiple premium details such as the targets for gold and mining stocks that could be reached in the next few weeks.
If you’d like to read those premium details, we have good news for you. As soon as you sign up for our free gold newsletter, you’ll get a free 7-day no-obligation trial access to our premium Gold & Silver Trading Alerts. It’s really free – sign up today.
Przemyslaw Radomski, CFA
Founder, Editor-in-chief
Sunshine Profits: Effective Investment through Diligence & Care
All essays, research and information found above represent analyses and opinions of Przemyslaw Radomski, CFA and Sunshine Profits’ associates only. As such, it may prove wrong and be subject to change without notice.
Opinions and analyses are based on data available to authors of respective essays at the time of writing. Although the information provided above is based on careful research and sources that are deemed to be accurate, Przemyslaw Radomski, CFA and his associates do not guarantee the accuracy or thoroughness of the data or information reported.
The opinions published above are neither an offer nor a recommendation to purchase or sell any securities. Mr. Radomski is not a Registered Securities Advisor. By reading Przemyslaw Radomski’s, CFA reports you fully agree that he will not be held responsible or liable for any decisions you make regarding any information provided in these reports.
Investing, trading and speculation in any financial markets may involve high risk of loss. Przemyslaw Radomski, CFA, Sunshine Profits’ employees and affiliates as well as members of their families may have a short or long position in any securities, including those mentioned in any of the reports or essays, and may make additional purchases and/or sales of those securities without notice.


