Here’s a quick note looking at some charts created using data from the latest weekly equity sentiment poll I’ve been running. As a reminder, the Weekly Equity Sentiment Poll uses Twitter polling and distinguishes between whether respondents are bullish or bearish primarily on the back of fundamental vs technical analysis reasons.
The first graph shows the response for each of the 4 options across the weeks. What sticks out is the distinct turn for the bearish in the latest results with all 4 options moving consistently (both bearish options up, both bullish options down.

The next two charts are where it really gets interesting. Here we compare the bulls vs bears spreads across the technicals vs fundamentals rationale. The “Fundamentals”Bull/Bear spread is at its most net-bearish point since just prior to the pre-election market jitters. Meanwhile the technicals fail to show the same enthusiasm that market prices might suggest – a classic divergence.
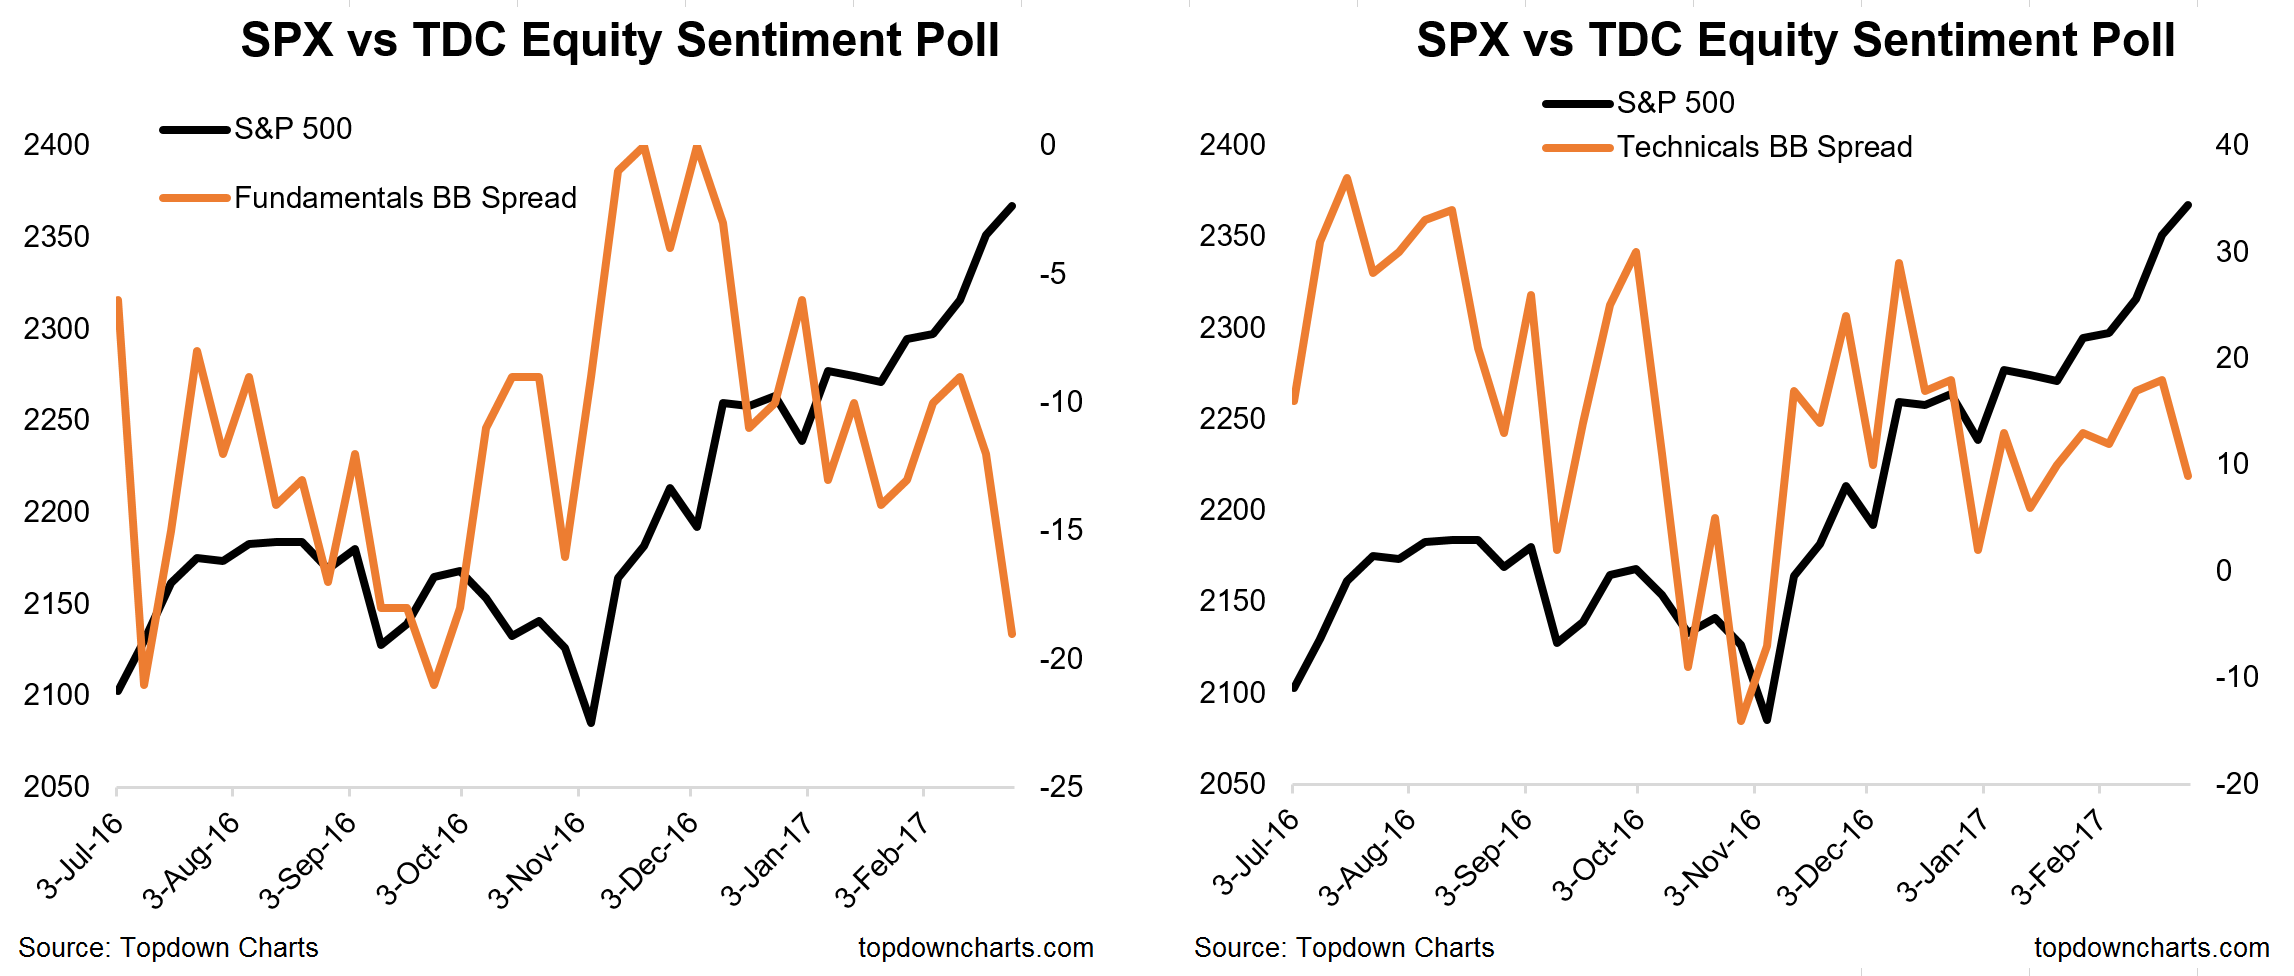
What’s notable about the fundamentals bull bear spread above is that it appears to have more of a lead on the market vs more of a coincident move for the technicals bull bear spread. So it’s also interesting then to look at how the overall bulls vs bears spread is tracking against the VIX. Followers of the survey and of this blog will note that this has been a running chart ever since the divergence opened up.
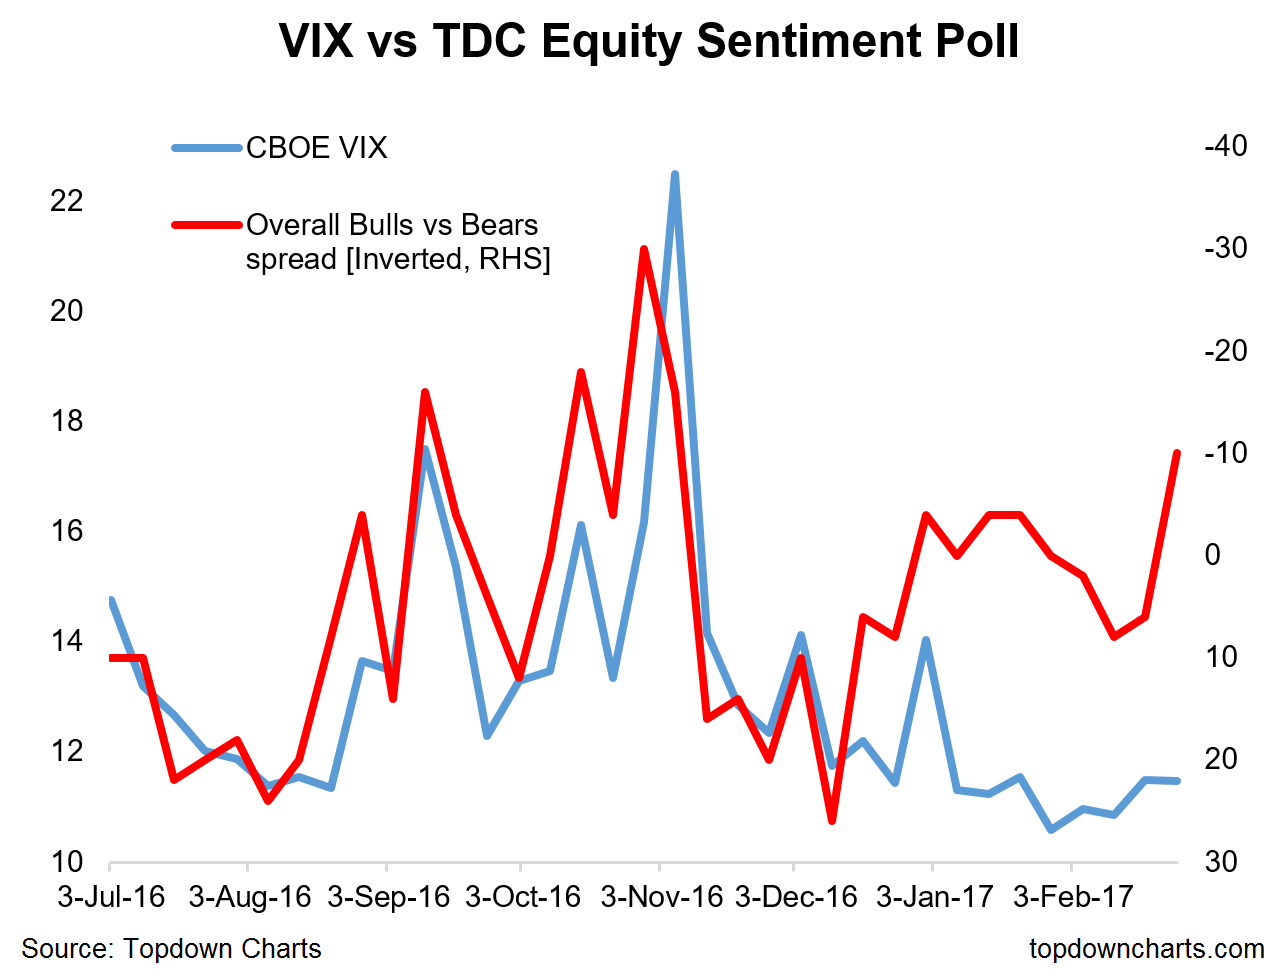
But now the divergence has widened much further, and it could certainly be a sign of an impending blowout in the VIX – with the survey implying a move toward 18 from around 11.5 on the close.
Summary
Overall with the turn to the bearish, there is a clear negative and bearish signal in the latest survey results. There is divergence between the technical bull/bear spread and the S&P500, there is a warning sign in the often leading indicator that is the fundamentals bulls vs bears spread, and the overall net-bulls indicator is pointing to a much higher VIX. So as with the conclusion in the latestWeekly S&P500 #ChartStormthe bearish warning signs are building…


