Employing basic bond math, we can decompose the US Treasury bond into two pieces: real rates and break-even inflation expectations. Because real rates (TIPS) and nominal rates (US Treasuries) are directly observable, break-even inflation is relatively easy to determine.
Taking this logic one step further, we can actually decompose a US Treasury bond into three components: 1) growth expectations, 2) a term premium and 3) break-even inflation expectations. A term premium is the extra yield an investor demands for holding longer dated securities, often insurance against an unexpected spike in inflation.
The term premium cannot be directly observed; it has to be calculated using a model. The Adrian, Crump and Moench (ACM) term premium is the one most used by the Federal Reserve (https://www.newyorkfed.org/research/data_indicators/term_premia.html).
So, in the end we have the following identities:
Nominal Rates = Real Rates + Breakeven Inflation
Real Rates = ACM Term Premium + Growth Expectations
Nominal Rates = ACM Term Premium + Growth Expectations + Breakeven Inflation
When we decompose the YTD move in the 10-Year US Treasury, we can see a significant divergence between the components. The term premium and breakeven inflation have fallen while growth expectations have increased. This goldilocks scenario has certainly helped stocks move higher this year.

Historically the nominal 10 Year US Treasury is tightly linked to term premiums, so it is not surprising to see the two move mostly in tandem this year.
The term premium is generally negatively correlated with growth expectations, so it is logical to see growth expectations having moved higher while term premiums fell.
Since the term premium is generally tightly linked to inflation expectations, it makes sense to see breakeven inflation expectations have moved lower alongside the term premium YTD.

The best macroeconomic driver we can identify that brings these components into a coherent focus is the move down in the US Dollar YTD.
This has, in turn, held down bond volatility—here represented by the MOVE Index (Merrill Lynch Option Volatility Index). The MOVE is to bonds what the VIX is to stocks.
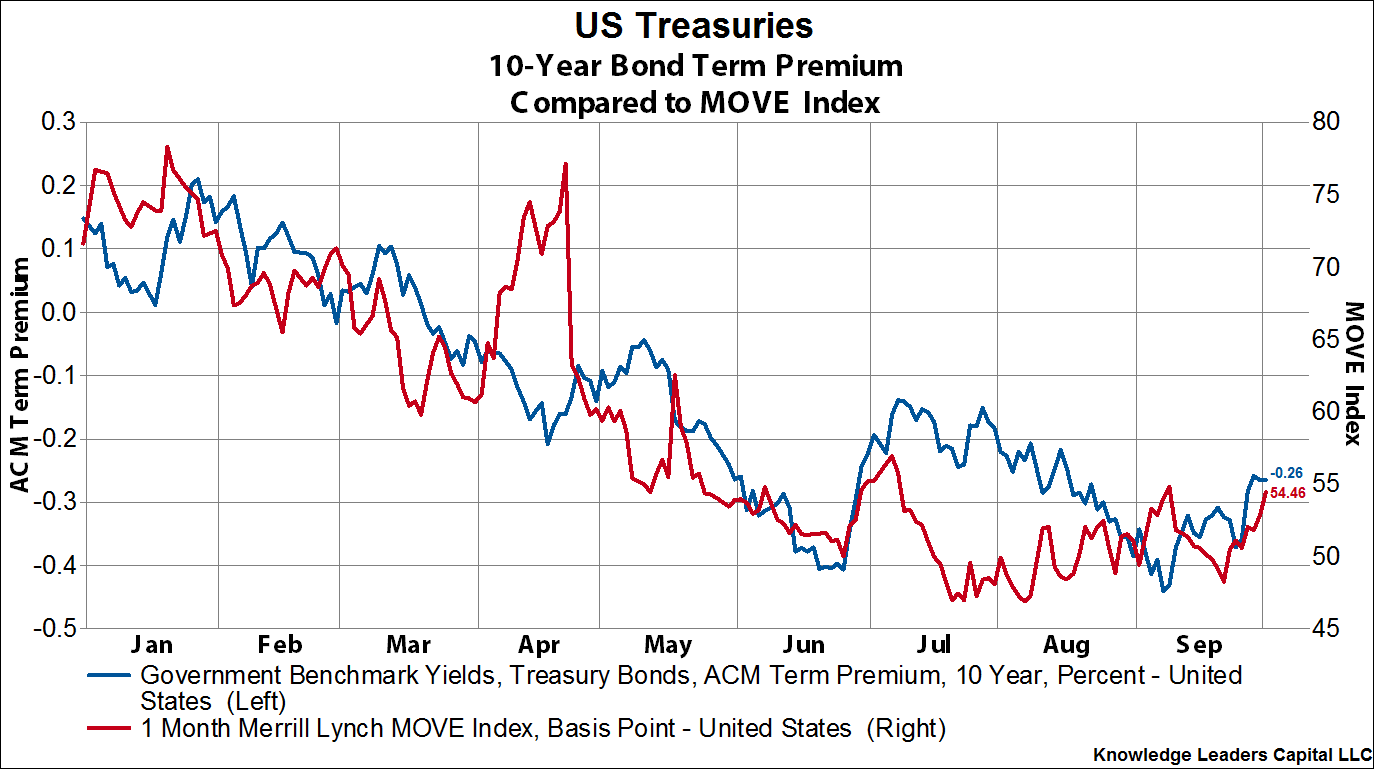
So far this year, while the US Dollar has sold off, 10 year US Treasury yields are down around 10bps, but more important is how the underlying components have moved. Term premiums and breakeven inflation are down while growth expectations are up. Will growth expectations hang on while the Fed reduces the size of its balance sheet?
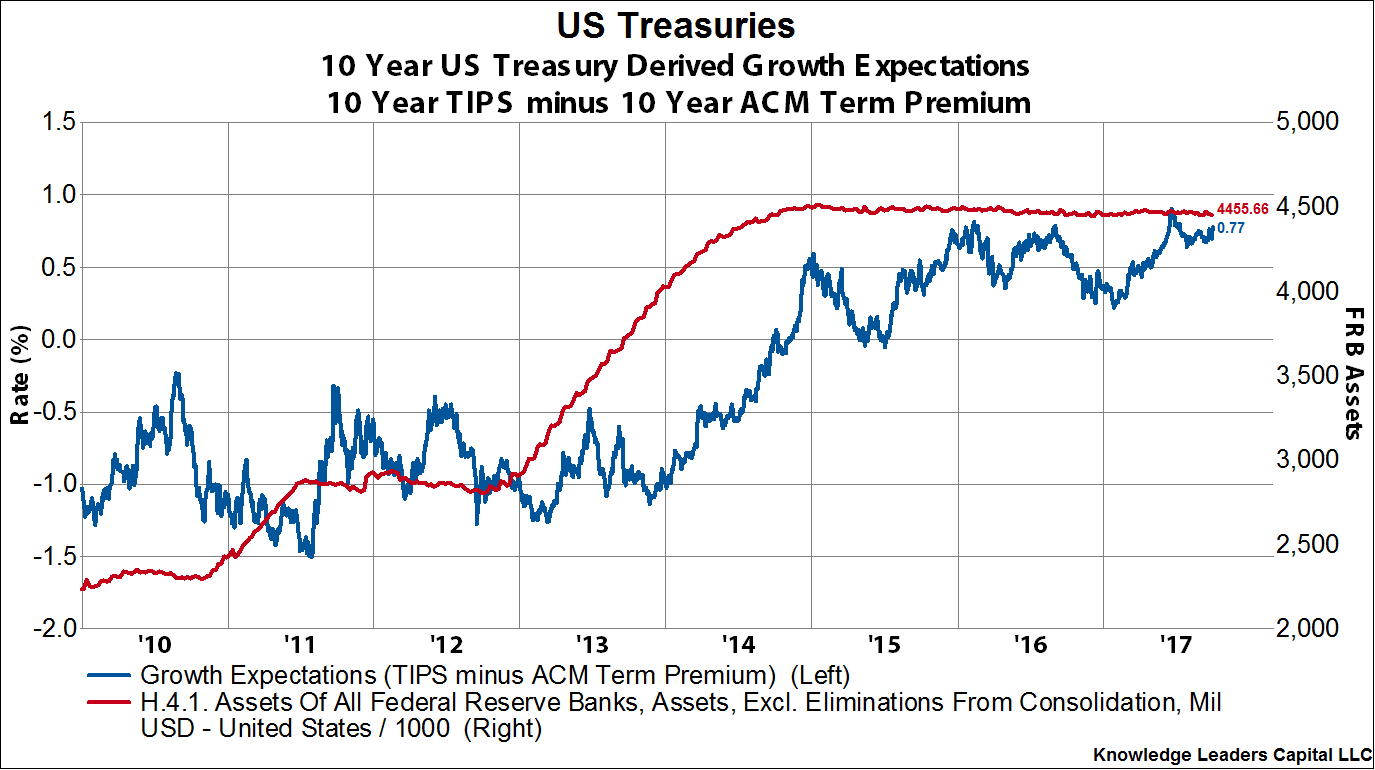
Or will the unwind of the Fed’s balance sheet cause the term premium to jump, overwhelming growth expectations, and leading to higher rates?
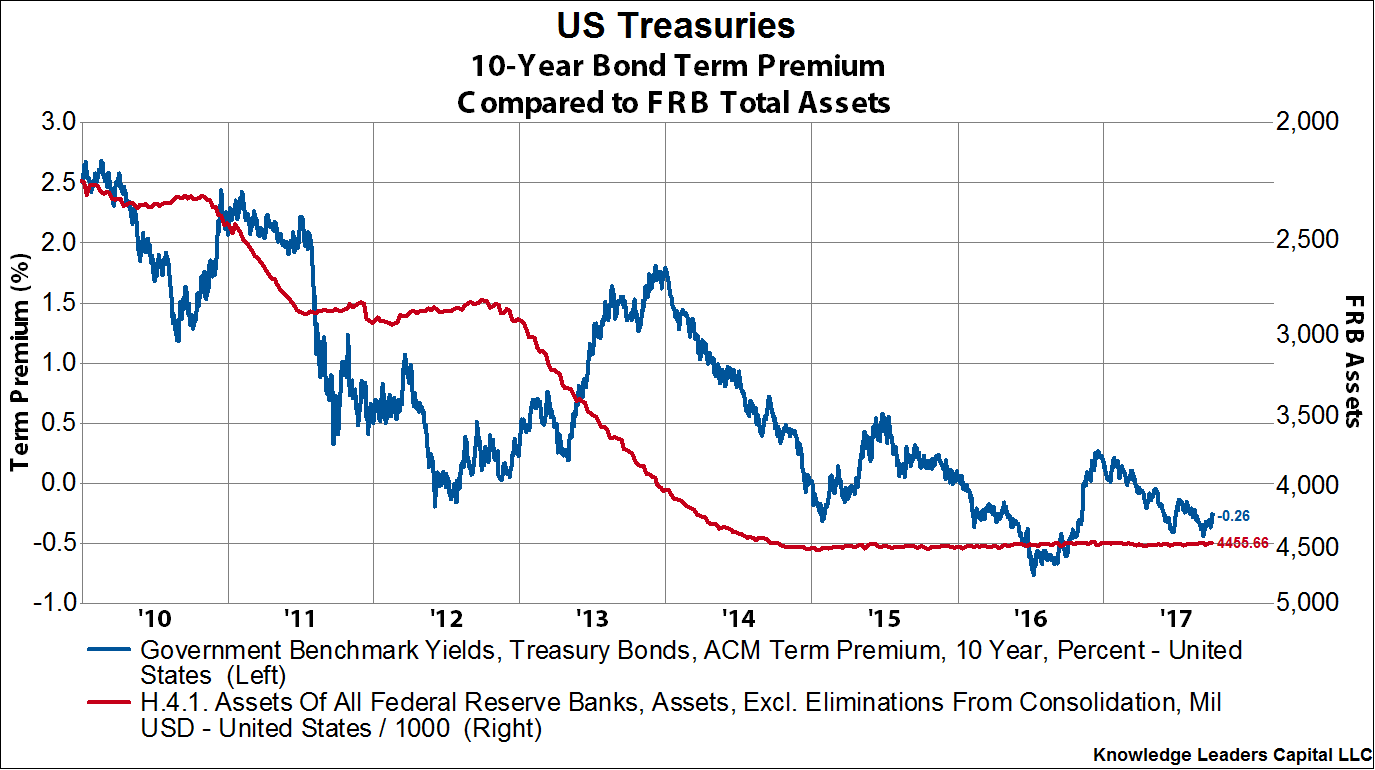
The currents are shifting underneath the US Treasury market as the Fed prepares for the great unwind.


