If I were only able to analyze a single metric before investing in a company it would be ROIC (Return on Invested Capital). Fundamentally, a company creates value by taking capital from investors (both debt and equity) to generate cash flows in the future.
A company only creates value to the extent that the return (ROIC) it generates is above its cost of capital (WACC), which we use to discount the future cash flows. The higher a company’s ROIC the greater the return it generates and ultimately the higher the cash flows it produces. Thus, the combination of growth and ROIC drives value creation.
A company that produces a lower ROIC than its WACC actually destroys capital. The logic is simple. Borrowing or raising capital at a rate of 10% (WACC) and then investing it into a business generating a 8% return (ROIC) is the equivalent of lighting cigars with $100 bills.
Your money is going up in smoke, both literally and figuratively. The only constituents who are happy in this scenario are your investment bankers, who receive a commission for every dollar you raise whether it’s equity or debt and will undoubtedly be encouraging you to go for that game changing M&A deal.
Unfortunately, there are a number of different permutations on how to calculate ROIC. Michael Mauboussin at Morgan Stanley published a 44 page report on how to correctly calculate ROIC in October 2022. Fortunately, you don’t need to go to that level of detail to improve your investing results. For our purposes as private investors my preferred definition of ROIC is the following:
ROIC = EBIT / Invested Capital X 100%
Invested Capital = total assets – current liabilities + short term borrowings
and
EBIT = earnings before interest and tax
EBIT is stated after all a company’s operating costs have been expensed, but before financing expenses such as interest on borrowings and taxes have been deducted. This is the same definition used by Joel Greenblatt in his Magic Formula.
If you’re familiar with Joel Greenblatt, you’ll know he’s one of the most successful hedge fund managers in recent history. Thus, I’m confident that ROIC as we’ve defined it is an excellent starting point for stock analysis.
In general, a company that can produce a 15% or higher ROIC is considered high quality. In my own portfolio, I only own businesses that can produce a 15% ROIC or higher. When analyzing a company the LTM (Last Twelve Months) ROIC data is important but you should also analyze the trend over the past 5 years.
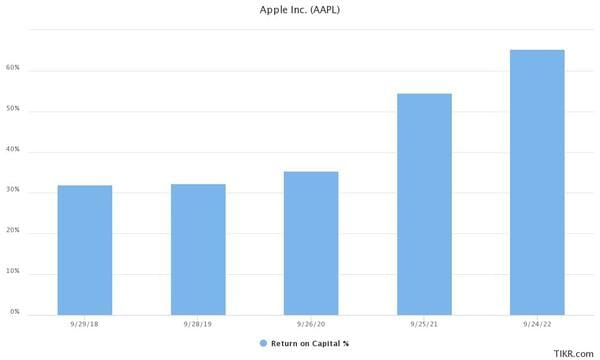
The chart below depicts the 5-year trend in ROIC for Apple Inc (NASDAQ:AAPL), a company that Warren Buffett believes to be one of the best in the world. Notice not only the absolute level of ROIC but also that it’s trending upward. This is the ideal scenario for a shareholder.
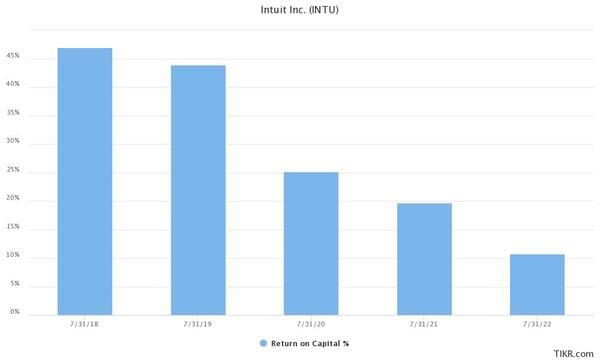
Now take a look at the chart below for Intuit. Notice not only the low absolute level of ROIC for the latest fiscal year ending 7/31/2022, but also the declining trend. Intuit is the producer of QuickBooks, an accounting software used by small and medium sized businesses globally.
It’s an excellent business with high levels of recurring revenue and a wide moat. Naturally, you must be wondering what caused the decline in ROIC. In next week’s email, I’ll use DuPont analysis to try and breakdown what’s happening with Intuit.
In the meantime, I would recommend going through your own portfolio and calculating the LTM ROIC for your current holdings. If you want the calculation done for you, I highly recommend the TIKR terminal. It’s a great tool for both analysis and screening.