Qualivian Investment Partners commentary for the third quarter ended September 30, 2022, discussing their investment thesis for Floor & Decor Holdings Inc (NYSE:FND).
The most important investing question is not, “What are the highest returns I can earn?” It’s, “What are the best returns I can sustain for the longest period of time?” – Morgan Housel
Q3 2022 hedge fund letters, conferences and more
Overview
Qualivian Investment Partners is an investment partnership focused on long-only public equities. We own a concentrated portfolio of 15–25 understandable companies with wide moats, long reinvestment runways, and outstanding capital allocation. Since we expect them to compound capital at a mid-teens rate, we hold them for an extended period.
We are seeking investors who are aligned with our long-term investment time horizon. We do not short securities. We do not use leverage. We do not use derivatives. We are not macro investors. We believe that only a relatively small number of exceptional companies are worth investing in over the long term.
Our Formula
Long-Term Orientation + Long-Term Investors + Focused Portfolio + Quality Compounders = Maximizing Chance for Outperformance
Our investors should understand how we invest so they make the right decision. We encourage investors who agree with our long-term horizon and philosophy to contact Aamer Khan ([email protected]) at 617-970-9583 or Cyril Malak ([email protected]) at 917-742-2039.
Cumulative Performance Since Inception Through September 30, 2022
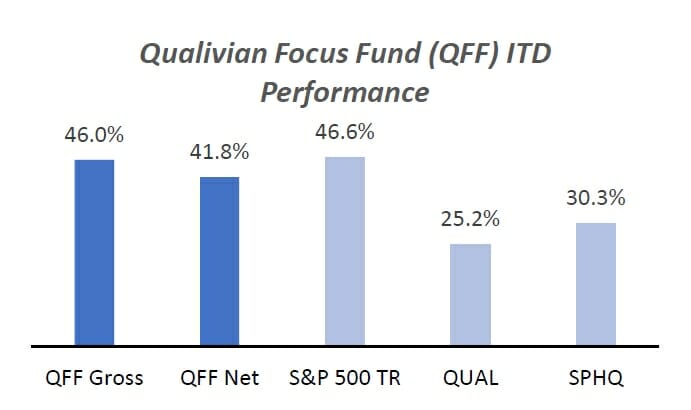
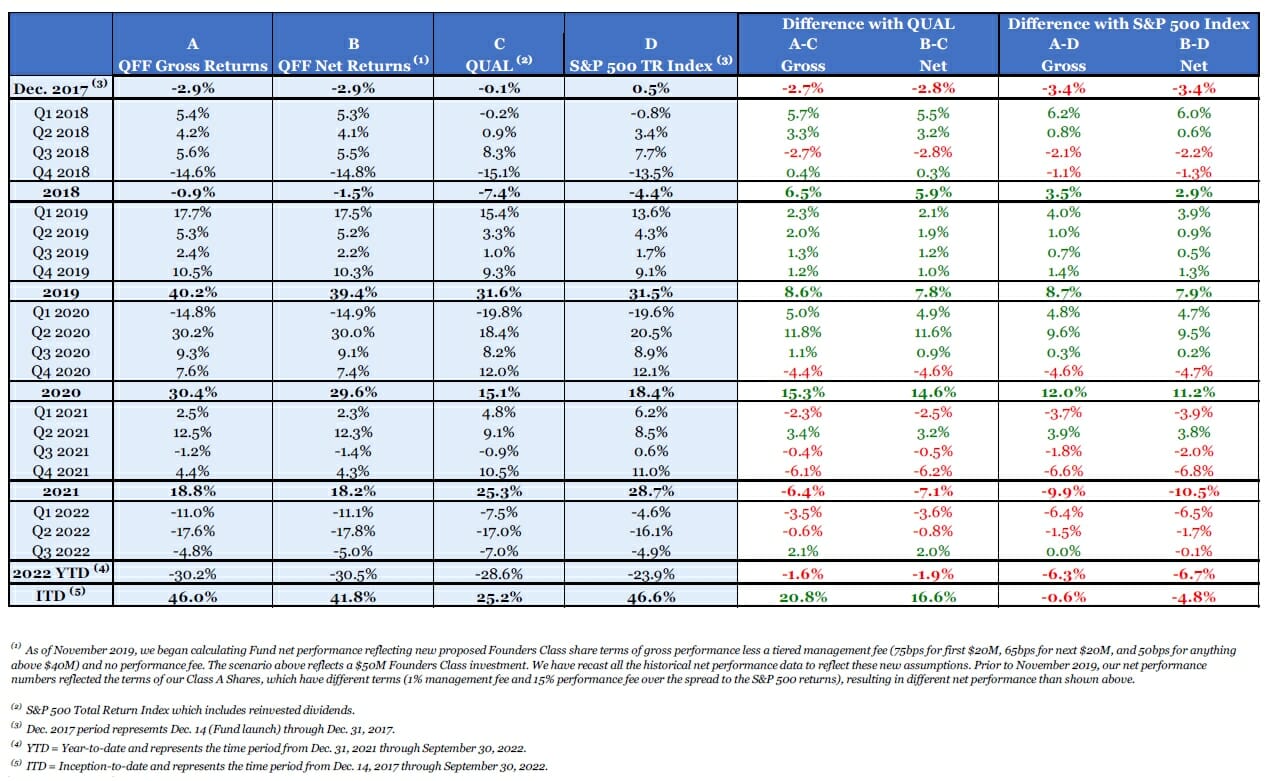
We have outperformed the iShares MSCI USA Quality Factor ETF (QUAL)1 by 20.8% and 16.6% on a gross and net basis. Similarly, we have outperformed the Invesco S&P 500 Quality ETF (SPHQ)2 by 15.7% and 11.5% on a gross and net basis respectively.
We have underperformed the S&P 500 Total Return3 index by 0.6% and 4.8% on a gross and net basis respectively from inception (Dec. 14, 2017) through September 30, 2022.
Q3 2022 Performance
In Q3 our gross and net return was –4.8% and -5.0% respectively, which was essentially in line with the S&P 500’s Total Return of –4.9%. Our performance was affected by the following factors:
- The Federal Reserve’s continued interest rate hikes, accelerating a tightening cycle which will continue until inflation meets the Fed’s 2% inflation target.
- The market continued its rotation out of growth and cyclical stocks and into defensive sectors such as Utilities and Consumer Staples sectors.
Our Portfolio, Inflation and Higher Rates:
- Despite the sell-off in growth stocks, the intrinsic value of the high-quality growth stocks in our portfolio should be less affected because:
- They have higher than average pricing power, enabling them to pass higher input costs via price increases on to their customers.
- They generally have higher gross margins than the average stock, so an increase in their cost of goods sold should have a more muted effect on their bottom line.
- Most of our companies are free cash flow positive and do not rely on debt financing to fund their ongoing operations, and what debt they do have is typically fixed-rate debt which they raised when corporate borrowing rates were much lower prior to the Fed’s steep and rapid rate hikes this year
Portfolio Changes in Q3 2022
We did not make any trades in Q3 2022. For our top 3 and bottom 3 contributors in the quarter, please refer to Appendix 2.
Are we living in Oligopolistan?
Since the 1980s. oligopolies are an increasing part of the business landscape. Simply put, an oligopolistic market is one that has limited competition.
Oligopolistic markets are characterized by:
- High concentration
- Large markups for market participants
- A large share of the profit pool is appropriated by a few firms
- Barriers to entry inhibit new competition and lead to persistence of the market share of existing firms.
Both anecdotal observation and market research indicates that the number of oligopolies has increased.
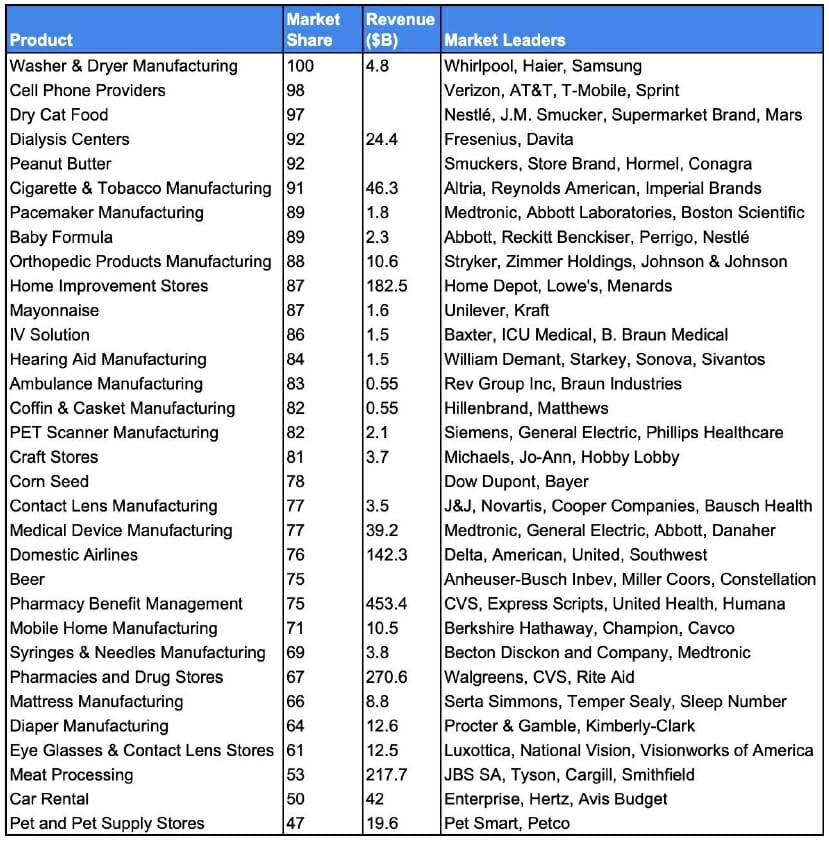
Anecdotal Observations
The following table illustrates a sampling of the pervasiveness of concentration among a few firms across broad product sectors:
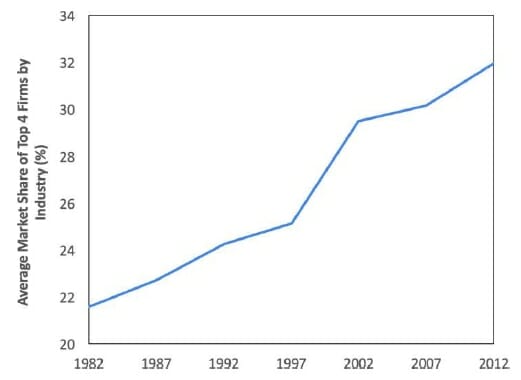
Rising Concentration of Top Firms
Industrial concentration has been on the rise since the early 1980s. The exhibit below is excerpted from a research paper by Autor et al.5 where they calculate the market share of the top four firms in each of 676 industries (e.g., grain and oilseed milling, furniture stores, etc.). They find that the average concentration increased by around 50% from 1982 to 2012.
Persistence of Market Shares
In a less competitive economy, market shares tend to be sustained since it is harder for new competitors to enter.
One measure of market share persistence is what Thomas Phillipon refers to as the Exit Probability. It is defined as follows: given that a firm is in the top four of its industry, either by market value or profits, how likely is it that it will drop out over the next three years? The results are displayed in the following figure.
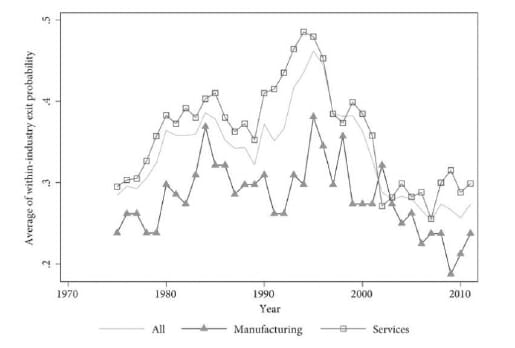
For example, in the 1990s the likelihood of being replaced was about 45 percent. More recently, the likelihood of being replaced within three years is only 30 percent. Leaders have more staying power.
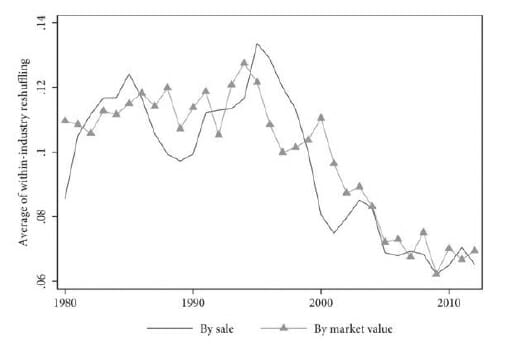
Another measure of persistence is reshuffling. Firms are ranked by market value or revenue in a particular year. Their rank is computed again five years later. The correlation of the two rankings is computed.
If the correlation between the two ranking series is one, it means that the relative position of firms has not changed at all over five years. If it is zero, it means that there has been a complete reshuffling within the industry. Reshuffling is defined as one minus the rank correlation.
The figure below shows that reshuffling has steadily decreased since the mid-1990s. Market shares have become more persistent. The firms on top five years from now are likely to be the same firms on top today.
Markups
Markup is the difference between the revenue of a firm and its cost of goods sold. The average markup in the US rose from 1.21 in 1980 to 1.54 in 2019. This is illustrated in the following chart:7
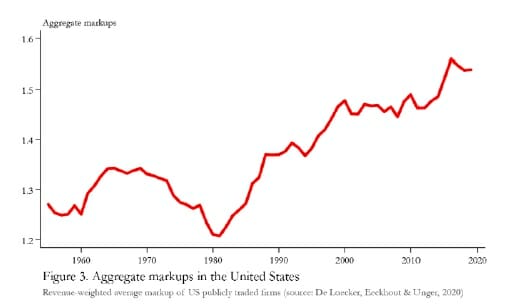
Interestingly, the median markup has remained unchanged; however, the markup for firms occupying the top market share positions has grown enormously:
- The nineteenth percentile of markup distribution has grown from 1.5 in 1980 to 2.5 in 2016 – that is 250% above cost.
Market Leaders Are More Profitable
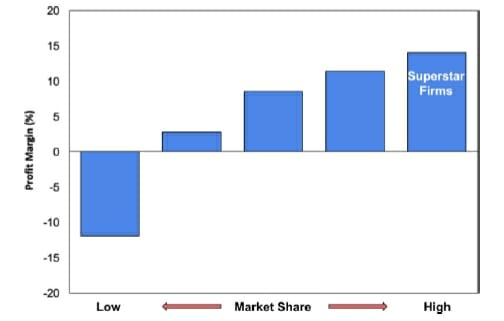
As one would expect, companies occupying the share leadership position in their respective sectors tend to be more profitable than their smaller counterparts as demonstrated in the graph above,8 in part because:
- Their enhanced pricing power as we saw in the previous section with markup data, and
- They pay a smaller share of their revenues to labor:
- Larger firms pay higher wages in absolute terms, but this represents a smaller percentage of their greater revenues than for smaller firms.9
As economic activity is becoming increasingly concentrated in the hands of a few large firms in each industry and as these firms are more profitable and pay a smaller share of their revenues to their workers:
- The percentage of profits as a percentage of sales increased from 1–2% in 1980 to 7–8% in 2016.
- The percentage of corporate profits to GDP increased from 4% in 1947 to between 8–9% in 2017 as can be seen in the graph below:10
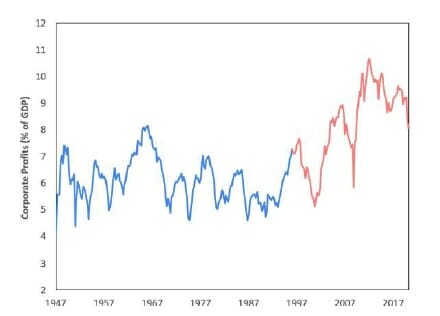
Historically, profits were reliably mean-reverting around 6% of GDP (blue). However, starting in the late-1990s, they seemingly underwent a paradigm shift (red). While they still gyrate with the business cycle, they appear to be around a significantly higher mean.
Do Oligopolies Outperform as Investments?
Hypothesis: Investing in a broad index of oligopolies leads to outperformance.
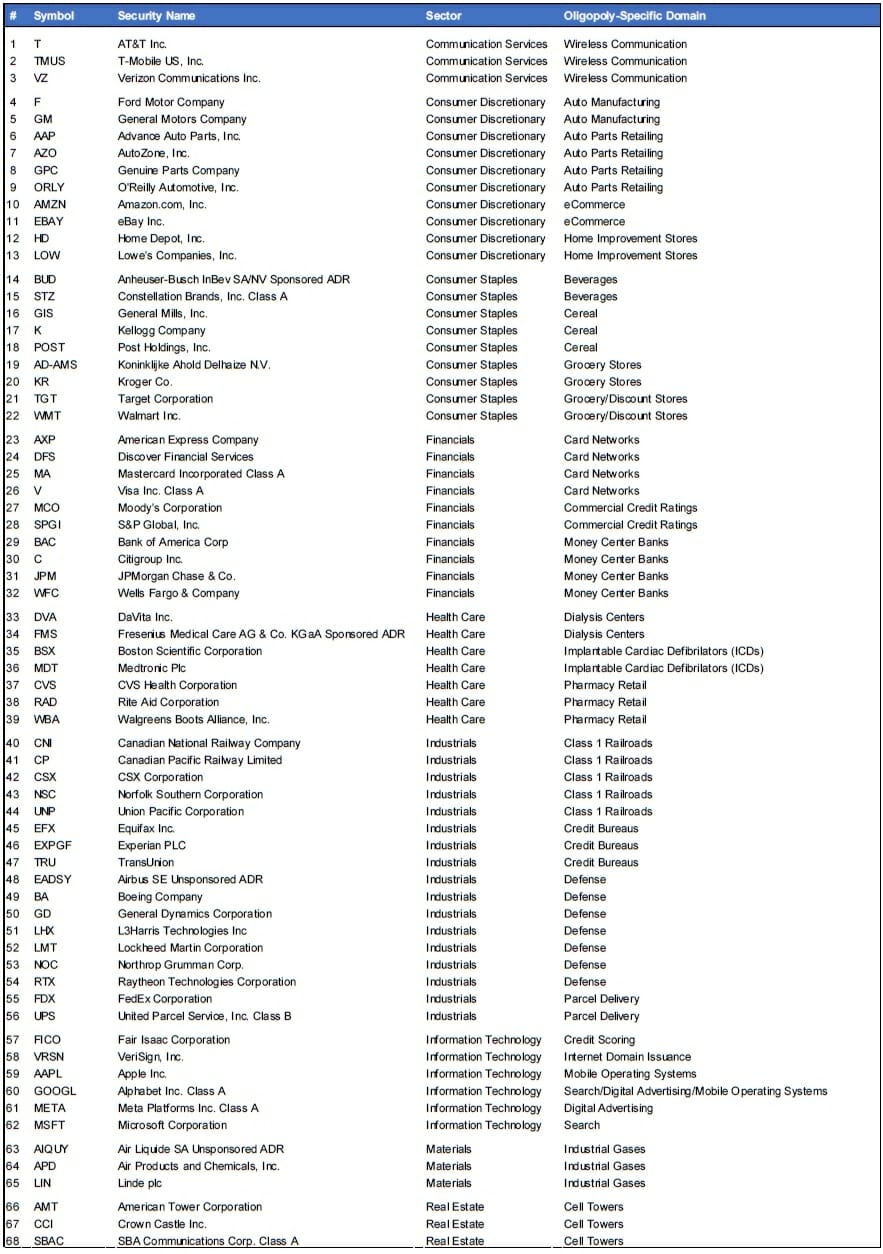
We conducted an analysis of 23 oligopolies comprised of 68 companies to see how they performed as investments over the last ten years.
Each firm in the analysis had the following characteristics:
- It was already an oligopoly at the beginning of the analysis period (December 1, 2012), i.e., it did not emerge as an oligopoly over the last ten years.
- Its market cap on December 1, 2012, was greater than $2 billion.
The list of companies and their sectors is listed in Appendix 3.
Conclusion: Investing in oligopolies does not necessarily lead to outperformance versus the market.
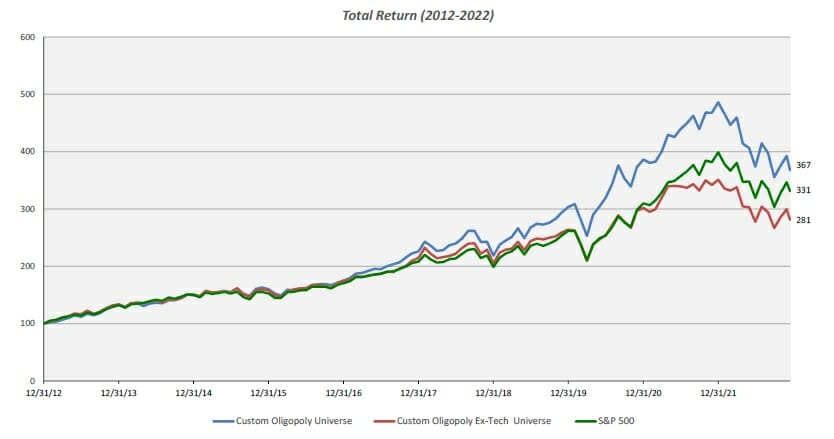
We measured the total return (price appreciation plus reinvested dividends) for our custom Oligopoly Index11 versus the S&P 500 and surprisingly found only a slight outperformance over the past ten years. We expected to see a greater level of outperformance given the advantaged nature of oligopolistic firms.
Furthermore, as can be seen from the graph below, when we remove the Technology companies from this list, we see an underperformance of oligopolies versus the S&P 500. We did not find statistically significant outperformance.
Why is this?
One explanation is that equity market participants figure out the advantages to oligopolistic companies and price them accordingly.
We then consulted the research and tested another hypothesis:
Hypothesis: Buy firms whose market shares are increasing and may be emerging as oligopolies.
Conclusion: This strategy led to an annualized outperformance of 2.2% versus the market as evidenced in the Sparkline Capital study.12
The key to this outperformance was to focus on the rate of change in market share and not the absolute level of concentration. The outperformance resulted from an inefficiency in the market: while investors recognized and properly priced established oligopolies, they were slow to recognize an emerging oligopoly.
We now highlight a company that has increasing market share and may be emerging as a Quality Compounder.
Floor and Decor Holdings Inc. (FND)
Overview
Floor & Decor Holdings Inc (NYSE:FND) is a specialty retailer that sells hard surface flooring and related accessories. It was founded in 2000 and has compounded revenue by 30% per annum over the last decade and adjusted EPS by over 37% over the last decade.
It has 180 stores across the US. The total addressable market is $41 billion which is segmented into a $25 billion residential market and a $16 billion commercial market. FND has a 20% share of the residential market and a 10% share of the commercial market.
Investment Thesis
FND is a specialty retailer that is an emerging category killer. It has:
- A differentiated value proposition providing a better service at a lower price to both the do-it-yourself segment and the professional segment.
- A business model that is extremely hard to disrupt from existing competitors and new competitors.
- A long growth runway with high returns on capital, compounding intrinsic value over time.
- A pro shareholder management team that has created enormous economic value.
It is an early-stage version of a business model that is partly Home Depot and partly Costco.
Key Points
- The Hard Surface Flooring market has secular growth: The overall (hard and soft) flooring market is growing at 2–4% per annum.
- The hard surface market continues to gain share from soft surface (carpet), increasing its market share from 44% of the total market to 57% over the last ten years. Consumer preferences are shifting to hard surfaces.
- FND is steadily gaining share in the Hard Surface Flooring market: Its share of the total addressable market was 8% in 2021, up from 6% in 2020. It was less than 2% in 2010.
- FND has a superior value proposition for customers – both do-it-yourselfers and professionals. This is premised on the following critical success factors:
- FND has a wider selection of in-stock inventory than its key competitors – the home centers (Home Depot/Lowe’s), other specialist stores, and independent retailers.
- Availability of in-stock inventory is a critical differentiator for most professional installers and many retail clients. They suffer from significant delays and uncertainty if inventory is not available on time.
- FND averages 1,700 in-store SKUs versus fewer than 500 for most of its competition. This results from:
- FND has larger store formats (78,000 square feet) versus much smaller stores for its competitors. Home centers typically devote 3–5,000 square feet to their flooring department, and other specialists have a maximum area of 20,000 square feet.
- FND has large distribution centers nationally. None of its competitors have large distribution centers dedicated to flooring. This enables FND to stock a much larger number of SKUs.
- FND is the only large player that has built out a global supplier network from which it sources directly. This capability is hard to replicate because it requires (1) local knowledge in different countries, and (2) tinkering over an extensive period to get the supply model right. All its competitors go through intermediaries or distributors, which adds cost and complexity. Some (Lowe’s) have tried to replicate direct sourcing but had to abandon the attempt.
- FND has the lowest prices. This results from its ability to source directly without having to pay for intermediate distribution. Low prices are especially important for professionals who are repeat customers and the largest customer segment by volume. FND aims to keep prices low to attract volume, akin to the Costco strategy.
- FND service levels are much better than the home centers, and on par with the independents and specialists. Their staff specializes in flooring, so is much more knowledgeable than the generalists.
- FND’s service to professionals (the most important segment) is better than the home centers and the independents. They have a dedicated pro desk and a pro loyalty program.
- FND averages 1,700 in-store SKUs versus fewer than 500 for most of its competition. This results from:
- Long Growth Runway: FND currently has about 180 stores. It plans on reaching 500 stores by 2030. This is entirely reasonable given its 8% market share and market growth of 2–4% per annum.
- Excellent Five-Year Outlook: With the above planned store growth, and a conservative assumption of flat same store comp sales growth for mature stores, and limited operating margin expansion, we believe FND can achieve:
- Mid-teens revenue CAGR
- Mid-20s EPS CAGR
- High-teens Return on Invested Capital (ROIC)
- Competitive Advantage: Competitors have neither the focus nor the resources to compete effectively with FND.
- Home centers lack the selection, service, and advantaged sourcing:
- They currently do not have the wide SKU selection of FND. They will have to build out much larger dedicated flooring departments together with dedicated flooring warehouses. They are generalists with many demands on their resources, so such a strong focus on flooring is unlikely.
- They lack the capability to source flooring directly from a global supplier to offer the lowest prices. This capability is not easy to develop.
- The other flooring specialists and independents lack the resources for large flooring departments, dedicated warehouses, or directly sourcing from a global network.
- Amazon and other online competitors are handicapped by:
- The complexity, the need for advice, and the inventory and transport requirements required for flooring.
- An omni channel may be possible but it would require the large bricks and mortar investment that FND has for Amazon to succeed.
- Home centers lack the selection, service, and advantaged sourcing:
- Reasonable Valuation: FND is trading at a 24 P/E for a high confidence 20% EPS growth rate over the next five years, or a very reasonable 1.2X PEG ratio.
Ending Thoughts
We look forward to continuing to share our thoughts on our investment approach and to keep you abreast of our performance and changes to the portfolio. If you would like additional information about Qualivian, please refer to Appendix 4 for links to prior Investor Letters, our investor presentation, and an interview that Aamer did with Insider Monkey. In the meantime, if you have any questions, please feel free to reach out to us at the links below.
With best wishes,
Aamer Khan
Co-founder
Cyril Malak
Co-founder
Appendix 1: Qualivian Focus Fund Quarterly Performance Table
Appendix 2: Top 3 and Bottom 3 Contributors for Q3 2022
Our top three contributors in Q3 2022 were O’Reilly Corp. (NASDAQ:ORLY), TJX Corp. (NYSE:TJX), and Amazon (NASDAQ:AMZN). Our bottom three contributors were Alphabet (NASDAQ:GOOGL), Adobe Corporation (NASDAQ:ADBE), and American Tower Corp. (NYSE:AMT).
Top 3 Contributors:
O’Reilly Corporation (ORLY):
The company grew overall revenues an impressive 9.2% on top of a 7.6% same-store sales (SSS) comp and a 3-year SSS comp stack of 31.2%. Management expects consumers to continue to spend money on maintaining their current vehicles as inflation, higher rates, and other economic challenges make it difficult for many of them to invest in new cars.
Furthermore, the steady recovery in miles driven and the health of their customer base due to current employment levels should sustain customer demand going into Q4 and into 2023.
ORLY logged in double-digit sales growth in its professional service business given its pricing initiatives in this segment and low single-digit growth in its DIY business, which faced very strong comparisons vs 2021 pandemic-inflated demand. Management raised rest of year revenue, SSS comp, and their EPS guide.
We suspect 2023 will be a mean-reverting year to more normalized low- to mid-single digit SSS comps, resulting in mid-to-high single-digit top-line growth and low double-digit EPS growth in line with longer-term trends.
ORLY tends to be somewhat counter-cyclical as new car purchases decelerate in a rising rate environment and more challenged consumers, extending consumers’ existing car age and their need to spend on maintaining their vehicles.
TJX Corp. (TJX):
Q3 revenues declined 2.9% against very tough Q3 2021 comparisons when revenues grew 23.9%. Same-store sales (SSS) comps in the core Marmaxx business, which we view as the key metric for brand health, rose a healthy 3%, beating consensus comp estimates of 1%.
Gross margins also came in ahead of expectations on strong merchandise margins, which were partially offset by higher freight and wage pressures.
More importantly, we continue to view TJX’s retail format as having the right combination of an appealing “treasure hunt” experience for consumers, while providing “good, better, and best” offerings at discount prices that ought to attract consumers in a more challenged economic environment.
We feel Q4 guidance feels sufficiently conservative for management to come in at or ahead of expectations. Reduced freight costs and higher availability of inventory should bode well for TJX in calendar 2023. We remain positive on the company’s differentiated retail formula and this management’s ability to navigate through a challenging environment.
Longer-term we expect TJX’s ability to sustain low- to mid-single digit SSS comps on top of 2% store growth, delivering mid- to high-single-digit topline growth and double-digit EPS growth for the coming few years.
Amazon (AMZN):
Amazon had a disappointing quarter, growing the topline by 15% (19% on a constant currency basis), admittedly on tough comparisons to a pandemic-boosted quarter in Q3 2021. AWS grew 27% (28% on a CC basis) and exiting the quarter at a 25% pace of growth, clearly disappointing the market. The one bright spot was the 30% growth in advertising revenues, reaching $9.5 billion in the quarter.
The company continues to grapple with inflationary costs from fuel and wages, as well as the overexpansion in its logistics network in the last two years, resulting in continued cost inefficiencies.
As revenues continue to grow into the excess capacity they built, we expect Amazon will see positive leverage in operating earnings and cash flow in the medium term. We remain comfortable with our long-term outlook for Amazon’s eCommerce and AWS businesses.
Bottom 3 Contributors:
Alphabet (GOOGL):
GOOGL grew Q3 topline by a disappointing 6% (including 5.0% of f/x headwind) reflecting a deteriorating macro backdrop, with search ad revenues growing only 4%. YouTube advertising revenues disappointed reflecting weakness in general brand advertising, declining by 2% in the quarter.
Offsetting the weakening ad revenues across Search and YouTube, Google Cloud delivered accelerating revenue growth of 38% in the quarter (posting higher growth than Amazon’s AWS and Microsoft’s Azure cloud businesses), while profitability in that segment remained elusive as Alphabet continued to invest in scaling that business.
We remain encouraged by Alphabet’s investment in the Cloud space, which we believe is still very much in the early days of its growth trajectory.
Operating margins declined for the second consecutive quarter as headcount growth continued to weigh on profitability, growing faster than overall revenues, which we found to be disappointing given management’s commentary regarding better cost control in the Q2 quarter.
While there is an element of cyclicality in online advertising revenues, we believe the longer-term prospects for continued growth in Search and YouTube revenues, as well as in Google Cloud, remain quite robust.
In the meantime, Alphabet’s management have significant levers to adjust operating costs to protect earnings and cash generation as the company navigates any potential economic downturns ahead.
Adobe Corp (ADBE):
Q3 revenues were essentially in-line, growing 13% (15% on an f/x adjusted basis), and EPS grew 9%. Furthermore, Q4 guidance was slightly below consensus but given the f/x headwinds and weakening macro backdrop, that was not a major surprise.
What was a major surprise to us and the market, was ADBE’s announced acquisition of Figma, a leading web-first collaborative design platform, for $20 billion, or 50X Figma’s $400 million annual recurring revenue (ARR).
While we and the market recognize that Figma is a unique asset and would allow ADBE to boost its Creative Cloud revenue growth by bootstrapping its offerings onto Figma’s real-time collaborative design tools, we are concerned about the premium paid by ADBE, and what that steep premium might imply about their competitive positioning in the market.
As a result, we will be reviewing our thesis in ADBE as we learn more about Figma.
American Tower (AMT):
AMT’s Q3 was a bit choppy, growing topline by 9% and AFFO/share flattish, with a combination of FX, rates and collections pressure from its largest customer in India (Vodafone India) weighing on the near-term outlook. We now expect AFFO pressure in 2023 from higher rates and a stronger USD, growing mid- to high single-digit.
The rest of AMT’s business was quite healthy, with the organic guide for international raised by +50 bps and the U.S. tower business about to turn the corner to ~4–5% growth from reductions in the T-Mobile/Sprint churn.
Our medium-to longer-term thesis remains intact:
AFFO/share growth should reaccelerate to low double-digit territory toward the back half of 2023 and beyond as the company experiences:
1) fewer future pitfalls from Sprint churn vs. peers supporting solid organic tenant billing growth in the US as wireless carriers continue to expand and fill in their 5G networks;
2) International growth and network buildouts continue resulting in higher EBITDA conversion as margins improve,
3) opportunistic share buybacks helping to provide downside protection, and
4) longer-term the optionality regarding new “edge compute” revenue streams leveraging their CoreSite data center acquisition and their tower network in the US.
Appendix 3: Components of Our Custom Oligopoly Index