Logica Capital commentary for the month ended August 31, 2023.
Summary
Equity markets stumbled a tad in August, and VIX/Implied Volatility didn’t respond, as demonstrated by the concurrent negative from a naïve straddle. This is mildly surprising given the relatively low level at which IV started the month; but was the outcome nonetheless.
In equity markets, we once again see some dispersion, with the NASDAQ 100 significantly outperforming the Russell 2000 and Dow Jones indices, furthering a trend of narrow participation. Outside of tech, energy was the sole sector to post a positive return in August, in line with the recent strength in the oil markets.

1) Returns are net of fees and represent the returns of Logica Absolute Return Fund, LP and Logica Tail Risk Fund, LP, respectively. Past performance is not indicative of future results.
2) Naïve Straddle Return: a 1.5 month out, S&P 500 at-the-money put and call bought on the final trading day of prior month and sold on the final trading day of current month. This return on premium is divided by a factor of 6 to be comparable to Logica’s typical AUM-to-premium ratio. For illustration purposes only.
3) Naïve Ratio Straddle Return: a 1.5 month out, S&P 500 at-the-money put and at-the-money call (divided by 2) bought on the final trading day of prior month and sold on the final trading day of current month. This return on premium is divided by a factor of 6 to be comparable to Logica’s typical AUM-to-premium ratio. For illustration purposes only.
4) S&P 500. The index measures the performance of the large-cap segment of the U.S. market. Considered to be a proxy of the U.S. equity market, the index is composed of 500+ constituent companies.
5) The Nasdaq-100 is a stock market index made up of 101 equity securities issued by 100 of the largest non-financial companies listed on the Nasdaq stock exchange.
6) The Dow Jones Industrial Average is a stock market index of 30 prominent companies listed on stock exchanges in the United States.
7) The Russell 2000 Index is a small-cap U.S. stock market index that makes up the smallest 2,000 stocks in the Russell 3000 Index.
The Portfolio: Looking Inside – Commentary & Portfolio Return Attribution


8) For illustration purposes only. Attribution returns are composed of daily returns, gross of fees
“I talk a lot about taking risks, and then I follow that up very quickly by saying, ‘Take prudent risks.”
– Irene Rosenfeld
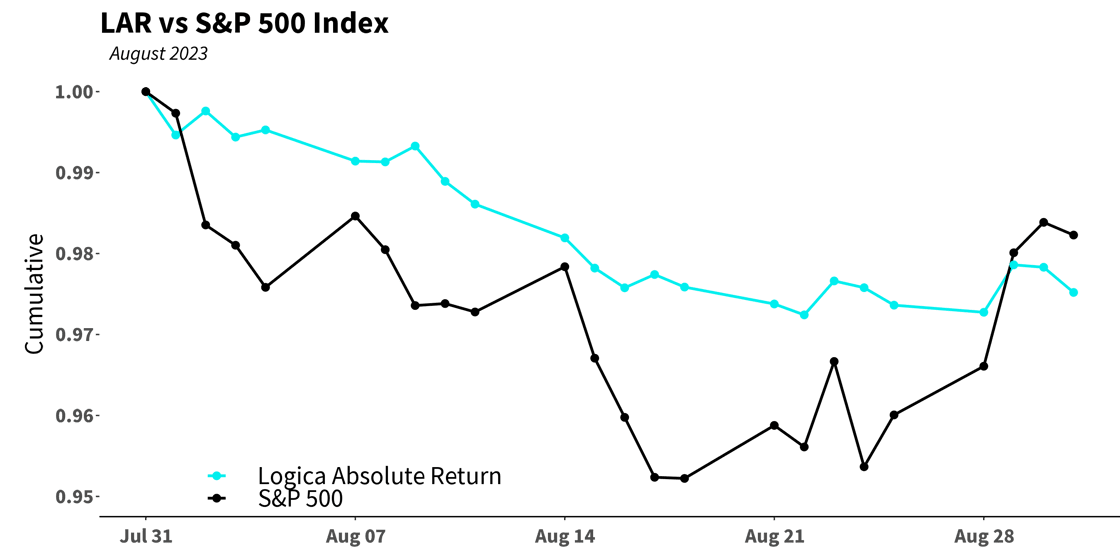
Across our strategies, there wasn’t much out of the ordinary for August. Both LAR and LTR suffered from a lack of Implied Volatility (“IV”) increase in connection with the retreat in the S&P 500. When this occurs, as we discussed in prior letters, we face two headwinds when the underlying goes down: theta, and delta. Theta is expected in holding options, but we also face a delta headwind because LAR typically carries a slightly positive delta notional position. We are willing to take delta risk in order to generate positive carry (in lieu of short volatility exposure). From our perspective, these two exposures are well worth the “risk” of carrying long Vol/Vega for the interspersed occasions it provides a valuable upside and offset, but, as occurred on various occasions in 2022, our positioning ends up a bit “lopsided” without the expected tailwind from IV. Said differently, all the risks are wonderful to take when the reward side of the coin pays off as expected, but then express themselves as pure risk (i.e. downside) when the reward side does not “do its thing.”
Our Sector & Single Stock Calls kept up with the S&P 500 MTD, which was nice, but there was not enough outperformance to overcome the aforementioned headwinds, and similarly, our Macro Overlay was flat to slightly negative on the month, but in either case, did not contribute to overcoming a Delta drag without a Vega climb.
“Your assumptions are your windows on the world. Scrub them off every once in a while, or the light won’t come in.”
– Irene Rosenfeld
One major component of our portfolio that did outperform nicely is our Vega scalping, which seeks to trade around our long Vol “inventory” to accumulate more Vol before potential downside equity moves, and reduce Vol before potential upside equity rallies (with the expectation of some Vol crush). A more detailed analysis of our Vega scalping on the month shows solid performance there, demonstrating our being more long Vega at the right times, and less long Vega at the similarly right times. Taking a closer look at the graphical representation of these trades below, we see 13 dots in the “Good” quadrants, and only 9 dots in the “Bad” quadrants (and 1 dot sitting atop the fence – so neutral). Moreover, we see one standalone dot in the “Very Good” far corner, demonstrating that we had unusually high Vega preceding an equity down/IV gain day.
Looking at these decisions to our positioning in the face of the result begets an interesting point: our model called the exposures quite well (in fact, 57% right), but because IV did not pop as much as expected, we did not get the expected payoff. Simply, our right decisions could not overcome the lack of IV responsiveness. But does this mean we were not as good as we thought, or something along those lines? In our view, absolutely not, as we vehemently believe it is best to separate decision from outcome.

As traders (whether of Vol or any other asset), given that the future is truly unknowable, the only reasonable goal is to make the best possible decision with the evidence in hand, which quantitatively, can be evaluated by such things as “hit rate” or “edge”. And if that hit rate or edge is positive (e.g. greater than 50% and/or with right skew), then one is – broadly — doing the right thing. But since one cannot know what the market is going to do, or more precisely, whether the core assumptions that one relies on for a high-level strategy approach (such as “Vol goes up when equity markets go down”) will always do what is expected, one will not always be as “right” as one’s decisions.
Of course, the same thing might be said for any strategy approach. Many a value investor has taken a position in a “value” stock because the fundamentals, by every assessment and given decades of experience, are cheap, but the market just keeps dragging the stock lower. The question, then, is to check in with those core assumptions every so often, such as “do these fundamentals infer a good buy?” In our case, do we still expect Vol to pop when equities fall? We certainly do!
Not only is there substantial empirical evidence that Vol pops when equites fall, there are many reasonable explanations for this inverse relationship. As a single structural example, trillions of dollars of equity assets are “Vol-targeted,” meaning that these approaches mechanically increase gross equity exposure when Vol is low and reduce exposure when Vol is high. These flow decisions, therefore, support the inverse relationship between Vol and equities. More so, and most powerfully, the onset of fear and panic during real disaster – whether intrinsic or extrinsic to the financial markets (think ’08 GFC vs. Covid-19) has time and time again led to both aggressive buying of Vol in order to protect the extent of uncertainty, as well as extremely heightened realized Vol as traders and speculators maneuver through the uncertainty. In summary, not only do we believe this inverse relationship will persist, we expect even greater upside at these levels given how relatively cheap Vol is at this time vs. last year(s). But in August, this just didn’t happen. The point is, with the core assumption in place, all we can do without knowing the future, is trade the best we can, i.e. maintain a positive edge. And to that goal, we are satisfied.
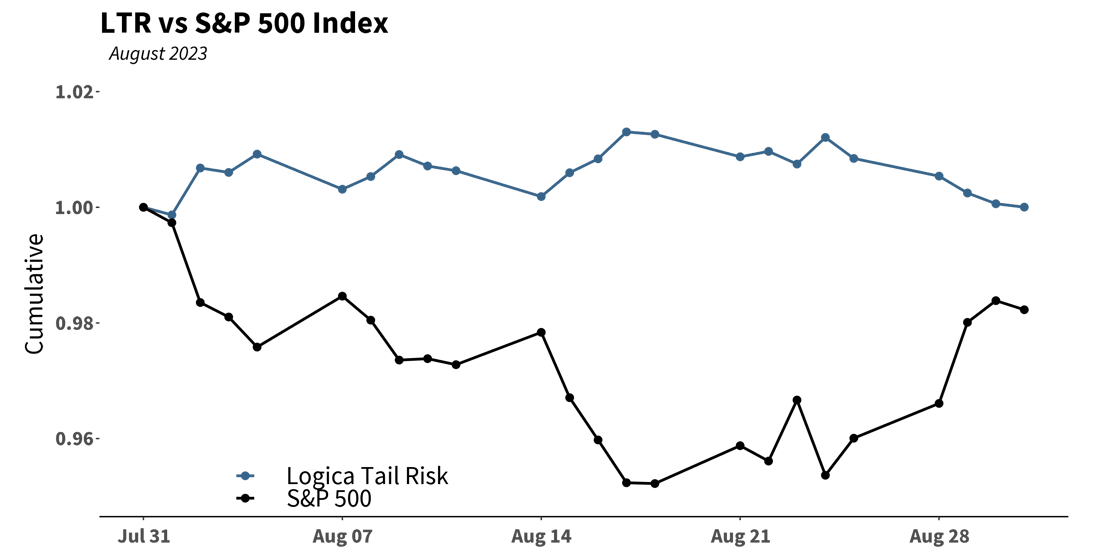
Finally, we can see LAR weighed down by its slightly positive delta exposure throughout the month, while LTR avoids that headwind and opposes the S&P 500 nicely (and as we expect):
The Volatility Market: Looking Outside
“Every weakness contains within itself a strength.”
– Shusaku Endo
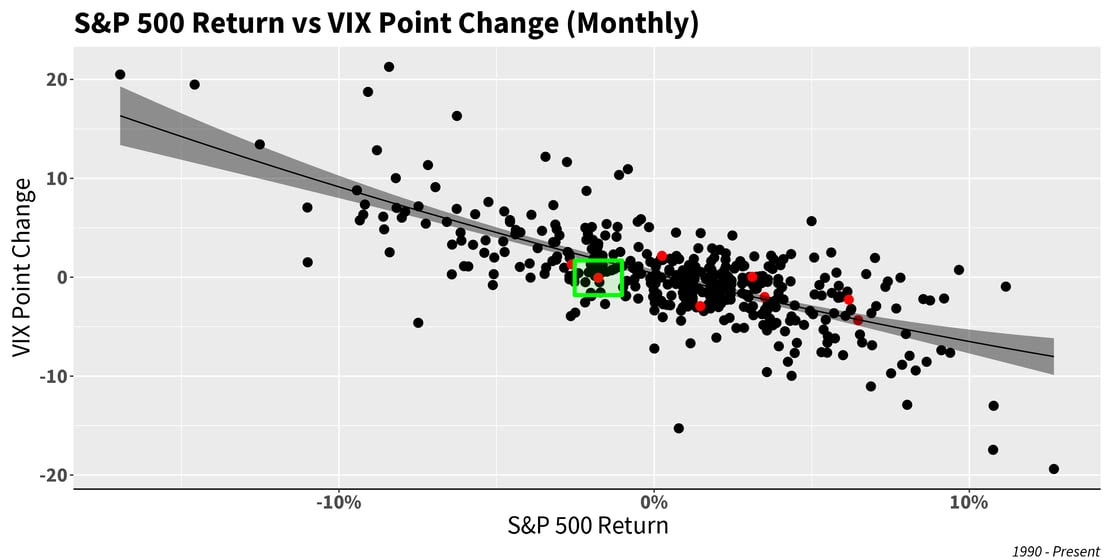
As we can see in the chart below, the VIX/Implied Volatility response (or lack thereof) in August given the small S&P 500 drawdown is noticeable; the red dot (in the green square) demonstrates its weakness in falling nicely below the average curve.
Looking even more granularly, we can pick out a point in August to evaluate the weak intra-month responsiveness. The reason to do this exercise is in attempts to identify if there was at least some responsiveness during the calendar month – even though it might appear that there wasn’t much responsiveness on a month over month basis, where such intra-month moments might’ve offered some Vega scalping opportunities. However, that was not the case in August.
In the chart below, we strike the analysis with a red dot on the 18th, as it was essentially the low point of the S&P500 on the month, and concurrently, the high point of VIX (poignantly, continuing to confirm the core assumption described above; S&P down, IV up). At that moment, we can see that it is again well below the average outcome, and hence our resolution that “we expected more responsiveness from IV.” Said differently, we saw a consistent lack of responsiveness from IV in August, therefore limiting opportunities (and favorable payoff moments) for our scalping strategies, and even though we did well in preparatory timing and positioning as illustrated above.

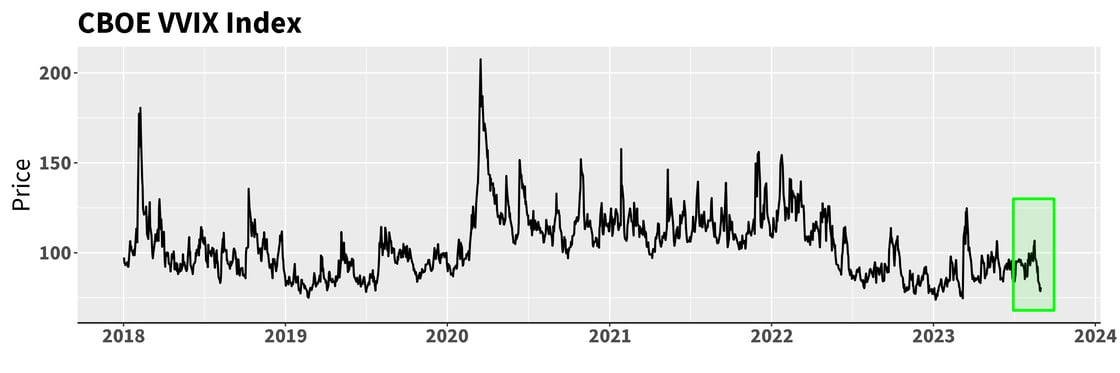
On a similar note, VolofVol, or the volatility of IV, as measured by the CBOE VVIX Index, is nearing multi-year lows (again, another way of saying that IV isn’t providing many Vega scalping opportunities):
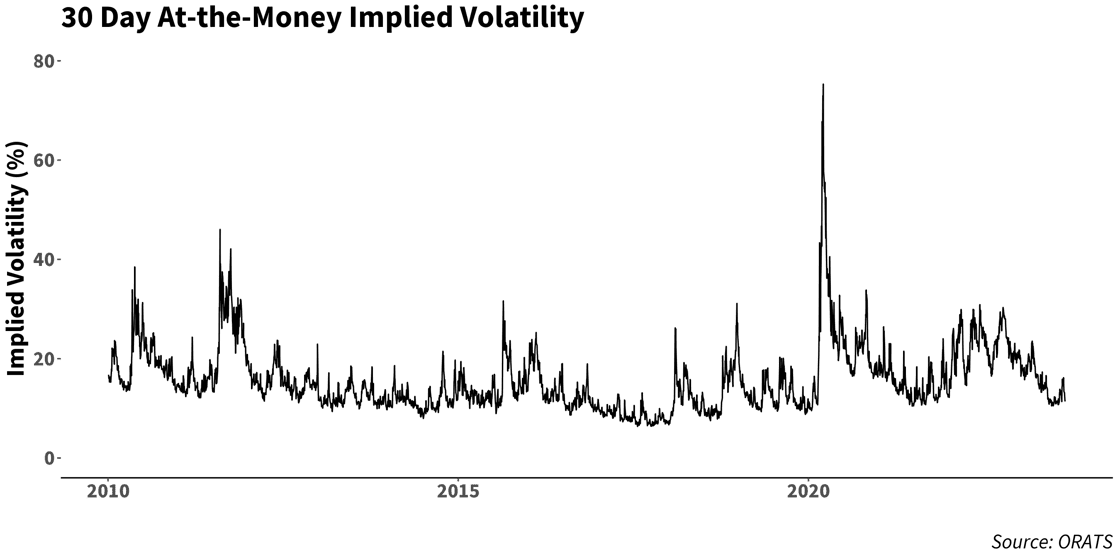
A simple at-the-money IV chart tells the same story, and reiterates a mantra that we’ve been repeating month after month in recent times: IV is looking quite cheap and one can’t help but see it as a coiled spring that is ready to pop.
“I disagree with everything I used to say.”
– Vivienne Westwood
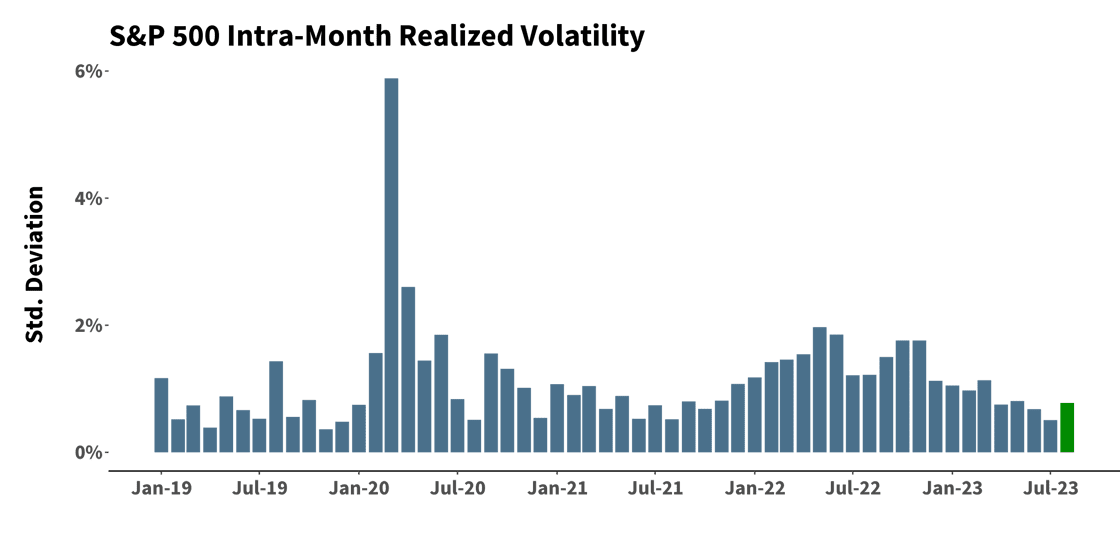
On a wholly separate note, and very interestingly, the chart below shows realized vol ticking up measurably, but of course without the expected commensurate implied volatility uptick, almost as if market participants are saying “I see that actual volatility is going up, but I don’t believe this level of actual volatility will continue into the future.” We disagree.
 Lastly, while not much changed from 1 month ago, we continue to monitor just how out of whack factor/index performance – more so, dispersion — continues to be:


