
The party was just gathering steam, and then… Powell entered, the ultimate spoilsport, making the Fed dovish again. How long till he gets kicked off?

Q2 2021 hedge fund letters, conferences and more
The War on Debt
With Jerome Powell, Chairman of the U.S. Federal Reserve (FED), struggling to adequately define “transitory” during his press conference on Jul. 28, the market narrative has shifted from ‘hawkish FED’ to ‘dovish FED.’ And with the U.S. dollar bearing the brunt of investors’ wrath, the ‘all-clear’ sign flashed in front of the PMs. However, with post-FED rallies mainstays in the PMs’ historical record, the recent euphoria is much more semblance than substance. Thus, while Powell’s persistent patience elicits fears of financial repression, today’s economic environment lacks many of the qualities that made the gambit viable in the past.
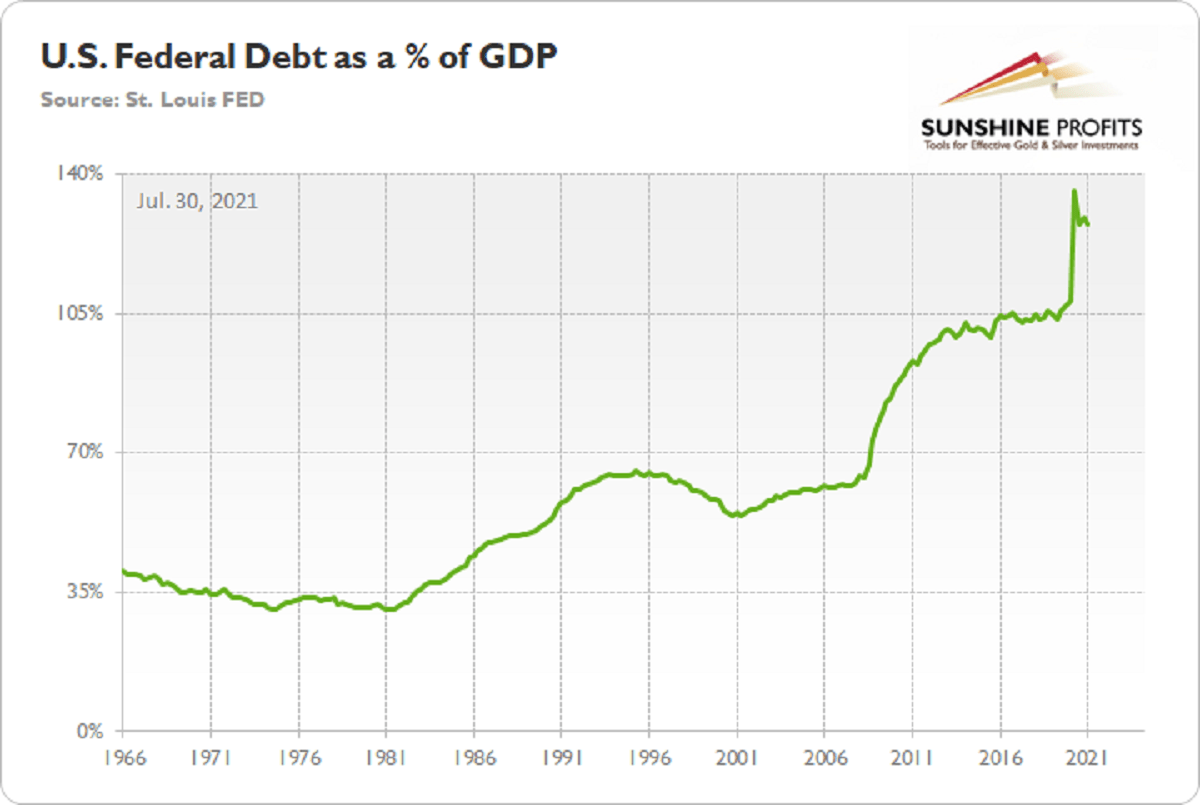
To explain, financial repression includes measures such as direct government financing (the FED prints money and lends it directly to the U.S. Treasury), interest rate caps (yield curve control) and extensive oversight of commercial banks (reserve requirements, controlling the flow of credit). In a nutshell: governments use the strategy to keep interest rates low and ensure that they can finance their debt. And with the U.S. federal debt as a percentage of GDP currently at 128% (updated on Jul. 29), some argue that’s exactly what’s happening. Moreover, with the U.S. 10-Year real yield hitting an all-time low of -1.15% on Jul. 28, is the FED simply turning back the clock to the 1940s?
To explain, during World War Two, surging inflation helped the U.S. government ‘inflate away’ its debt. Think of it like this: if an individual borrows $100 at a 2% interest rate and repays the balance in full after one year, the total outlay is $102. However, if inflation is running at 4% (negative real yield), putting that money to work should result in an asset that’s worth $104 by the end of the year. As a result, the individual nets $2 (104 – 102) due to the inflation rate exceeding the nominal interest rate. And as it relates to the present situation, if the FED keeps real yields negative, then asset price inflation and economic growth should outpace nominal interest rates and allow the U.S. government to ‘inflate away’ its debt.
However, the strategy is not without fault. For one, financial repression occurs at the expense of bondholders. And with pension funds still required to meet the guaranteed outlays for retirees, suppressing bond yields hampers their ability to match assets and liabilities without incurring more risk.
More importantly, though, the FED doesn’t control the long end of the U.S. yield curve. For one, the FED owns roughly 23% of the U.S. Treasury market, and it has a monopoly on confidence, not long-term interest rates. Second, the U.S. 10-Year Treasury yield has dropped because investors fear that the Delta variant and/or the FED’s forthcoming taper will depress the U.S. economy. And eager to front-run the potential outcome, bond investors have positioned for slower growth, lower inflation, and, eventually, a reenactment of the FED cutting interest rates.
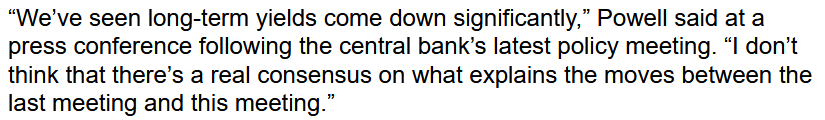
For context, even Powell himself admitted on Jul. 28 that the decline has caught him off-guard:
Source: Bloomberg
Likewise, following WW2, the U.S. government implemented structural reforms that are not present today. For example, prudent fiscal policy emerged in the late 1940s, with the government reducing spending and prioritizing debt reduction. In stark contrast, today’s U.S. government is already finalizing an infrastructure package and the federal deficit as a percentage of GDP is still growing. For context, a deficit occurs when the governments’ outlays (expenditures) exceed its tax receipts (revenues).
Please see below:
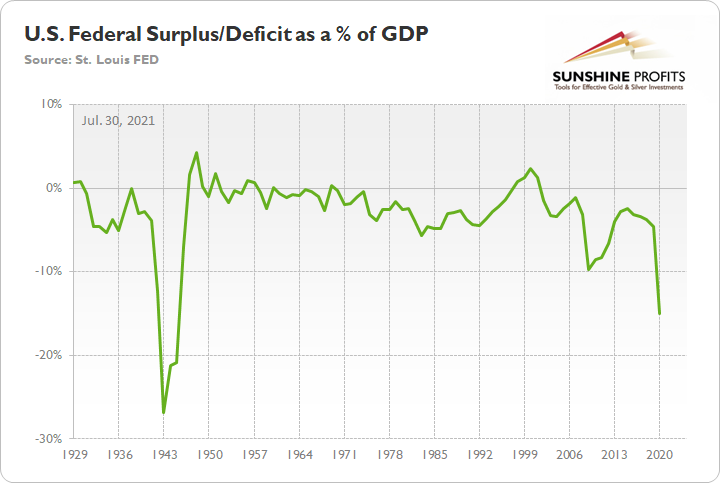
To explain, the green line above tracks the U.S. federal surplus/deficit as a percentage of GDP. If you focus on the period from 1943 to 1950, you can see that after the deficit peaked in 1943, reduced spending and strong GDP growth allowed the green line to move sharply higher. Conversely, if you analyze the right side of the chart, you can see that current spending still outpaces GDP growth (green line moving lower), and stoking inflation is unlikely to solve the problem.
U.S. 10-Year Treasury Yield Decouples... By a Lot
Circling back to the bond market, the U.S. 10-Year Treasury yield currently trades at an all-time low relative to realized inflation.
Please see below:
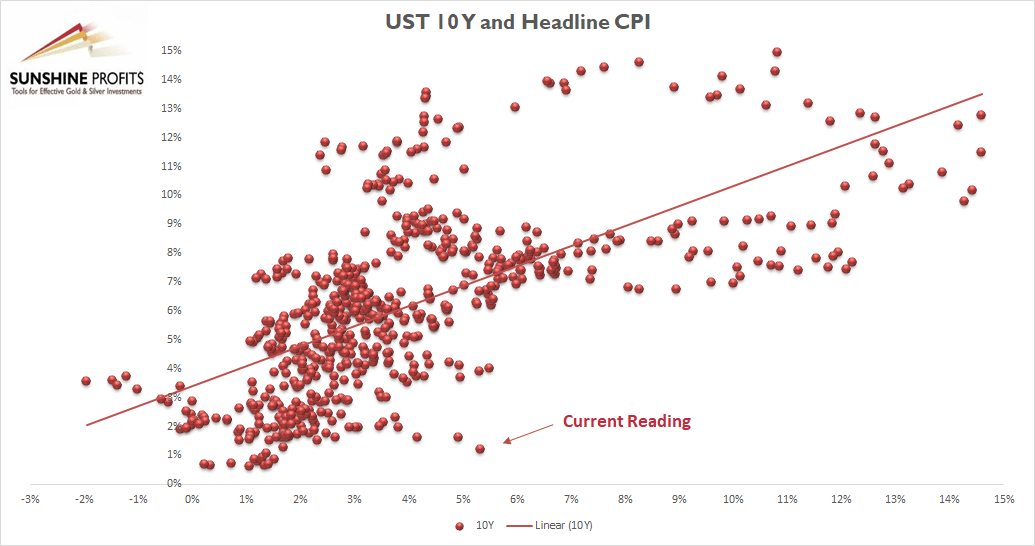
To explain, the scatterplot above depicts the relationship between the headline Consumer Price Index (CPI) and the U.S. 10-Year Treasury yield (available data dates back to 1967). For context, the headline CPI is plotted on the horizontal axis, while the U.S. 10-Year Treasury yield is plotted on the vertical axis. If you analyze the dot labeled “Current Reading,” you can see that the U.S. 10-Year Treasury yield has never been lower when the headline CPI has risen by 5% or more year-over-year (YoY). In fact, even if the headline CPI declined to the FED’s 2% YoY target, the U.S. 10-Year Treasury yield at 1.27% would still be the lowest relative reading of all time.
However, it’s important to remember that different paths can still lead to the same destination. For example, if inflation turns out to be a paper tiger, a profound decline in inflation expectations will have the same negative impact on the PMs as a sharp rise in the U.S. 10-Year Treasury yield.
Please see below:
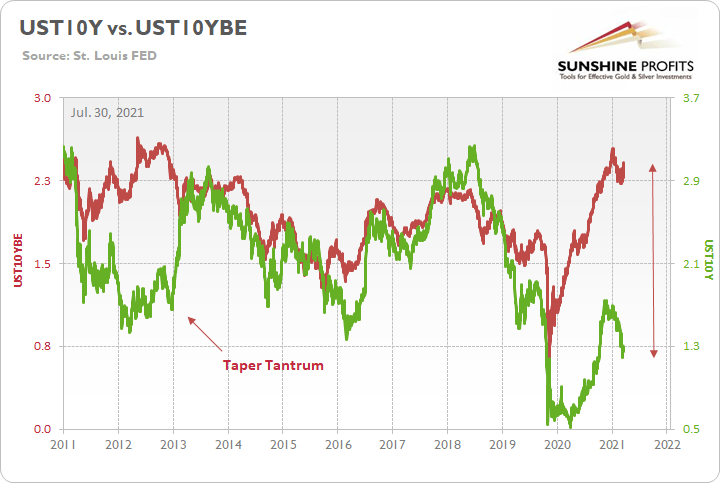
To explain, the green line above tracks the U.S. 10-Year Treasury yield, while the red line above tracks the U.S. 10-Year breakeven inflation rate. If you analyze the gap on the right side of the chart, it’s a decoupling of the ages. However, while the two lines are destined to reconnect at some point, if the red line falls off a cliff, the impact on the PMs will likely mirror the 2013 taper tantrum. For context, gold fell by more than $500 in less than six months during the event.
Finally, and most importantly, U.S. Treasury yields are only one piece of the PMs’ bearish puzzle. Knowing that one shouldn’t put all their eggs in one basket, betting the farm on the U.S. 10-Year Treasury yield would be investing malpractice. That’s why self-similar patterns, ratios, technical indicators, the relative behavior of the gold miners, the USD Index and the FED’s taper timeline are all prudently considered when forming our investment thesis.
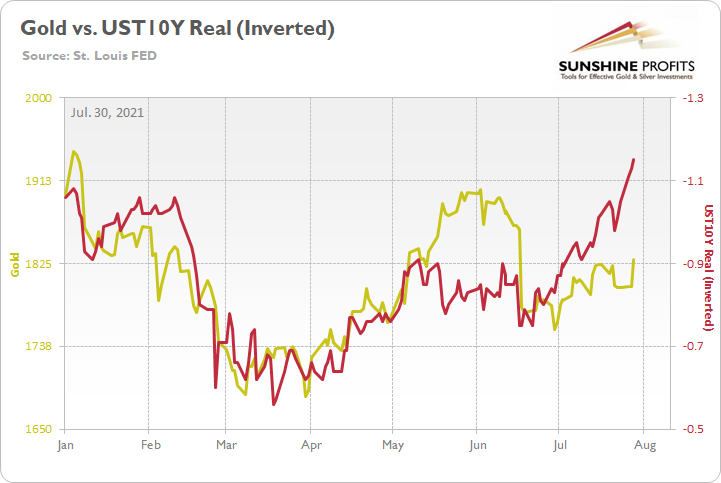
As an example, if gold had a perfect correlation with the U.S. 10-Year real yield, the yellow metal would be trading at roughly $1,940. However, with many other factors worthy of our attention, gold’s material underperformance indicates that a mosaic of headwinds undermines its medium-term outlook.
In conclusion, Powell’s party was in full swing on Jul. 29, as the PMs and the USD Index headed in opposite directions. However, with the yellow metal still confronted with a tough road ahead, the fundamental outlook remains dicey over the next few months. For example, with the all-time imbalance in the U.S. Treasury market eliciting little optimism, it took Powell’s dovish remarks to ignite the recent fervor. And with both developments likely to reverse in the coming months, the PMs’ upside catalysts may fade with the summer sun.
Thank you for reading our free analysis today. Please note that the above is just a small fraction of today’s all-encompassing Gold & Silver Trading Alert. The latter includes multiple premium details such as the targets for gold and mining stocks that could be reached in the next few weeks. If you’d like to read those premium details, we have good news for you. As soon as you sign up for our free gold newsletter, you’ll get a free 7-day no-obligation trial access to our premium Gold & Silver Trading Alerts. It’s really free – sign up today.
Przemyslaw Radomski, CFA
Founder, Editor-in-chief
Sunshine Profits: Effective Investment through Diligence & Care
All essays, research and information found above represent analyses and opinions of Przemyslaw Radomski, CFA and Sunshine Profits' associates only. As such, it may prove wrong and be subject to change without notice. Opinions and analyses are based on data available to authors of respective essays at the time of writing. Although the information provided above is based on careful research and sources that are deemed to be accurate, Przemyslaw Radomski, CFA and his associates do not guarantee the accuracy or thoroughness of the data or information reported. The opinions published above are neither an offer nor a recommendation to purchase or sell any securities. Mr. Radomski is not a Registered Securities Advisor. By reading Przemyslaw Radomski's, CFA reports you fully agree that he will not be held responsible or liable for any decisions you make regarding any information provided in these reports. Investing, trading and speculation in any financial markets may involve high risk of loss. Przemyslaw Radomski, CFA, Sunshine Profits' employees and affiliates as well as members of their families may have a short or long position in any securities, including those mentioned in any of the reports or essays, and may make additional purchases and/or sales of those securities without notice.


