
For weekend reading, Ivan Martchev, investment strategist at Navellier & Associates, offers the following commentary:
Over long periods of time, gold can be viewed as the “anti-dollar,” or more broadly as “anti-paper money,” but over an intermediate term (3-5 years) its price pattern can be quite a bit more complicated.
Q3 2022 hedge fund letters, conferences and more
Find A Qualified Financial Advisor
Finding a qualified financial advisor doesn’t have to be hard. SmartAsset’s free tool matches you with up to 3 fiduciary financial advisors in your area in 5 minutes.
Each advisor has been vetted by SmartAsset and is held to a fiduciary standard to act in your best interests.
If you’re ready to be matched with local advisors that can help you achieve your financial goals, get started now.
In the past five years, we have flipped between periods where gold was decidedly inversely correlated with the dollar and then decidedly positively correlated. The latest such positive correlation was late 2021 to early 2022. Since the middle of 2022 until now, gold has become decidedly inversely correlated with the U.S. dollar. The higher the dollar went, the lower gold went and vice versa.
On the latest downswing in the dollar, gold began its latest run.
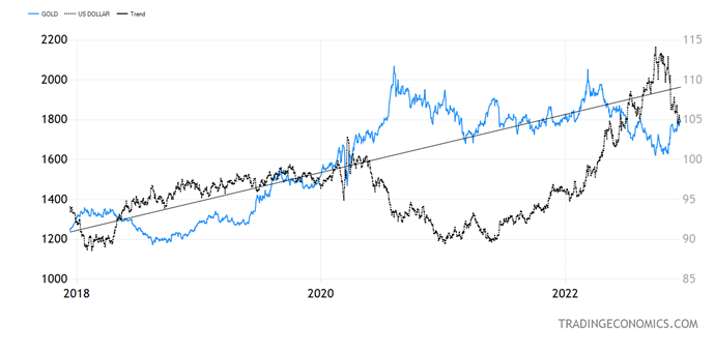
Gold’s Inverse Correlation With The U.S. Dollar
Here are two key reasons why this inverse correlation is likely to continue.
#1: I think gold bullion and the dollar are seeing the end of the Fed tightening cycle and the start of the ECB rate-raising cycle.
Since the ECB is behind the Fed, the interest rate differential between the dollar and the euro is likely to shrink, thus supporting the euro and pressuring the dollar, driving investors to the euro vs. the dollar.
What can derail this selloff is any sharp escalation of the Ukrainian conflict or a spill over into other countries, which is impossible to forecast – and I sincerely hope it does not happen.
Since all measures of the yield curve are deeply inverted, I believe the Fed should have announced a pause at their Wednesday meeting, but given Powell’s erratic behavior at FOMC pressers, this was hard to predict. Be that as it may, I think the gold market is looking further than this week’s FOMC meeting and is focusing on what is likely to happen in 2023.
#2: Inflation should decline dramatically in 2023.
The surge in deficit spending during COVID caused the current inflation. The U.S. spent as much money on COVID as it did during all of World War II, relative to the size of the U.S. economy.
The problem is that the spending in WW2 lasted five years while this time we did it in one year. That $6 trillion in COVID spending caused a surge in M2 money supply to the tune of 26.9% in February 2021. At last count (and this is monthly data) the Y-o-Y growth rate in M2 is only 1.3%.
Shorter three and six-month annualized rates of change are negative. As per the chart below, we saw the sharpest rise and sharpest fall in M2 growth in 65 years (as far as I can get M2 growth data).
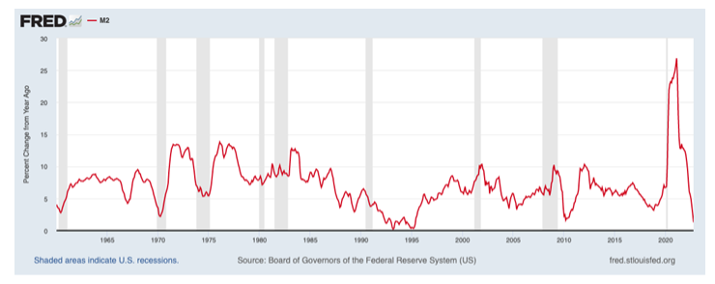
In March 1993, M2 growth got as low as 0.23%. Two years later it got down to 0.31%, after the only soft landing in recent memory was engineered by the Greenspan Fed in the mid-1990s. Still, with the fastest rate hiking cycle in history relative to the base where it started, and a yield curve the most inverted since the early 1980s, M2 growth will likely turn negative.
Here are how the M2 year-over-year growth numbers look since April, as M2 is slowly declining.
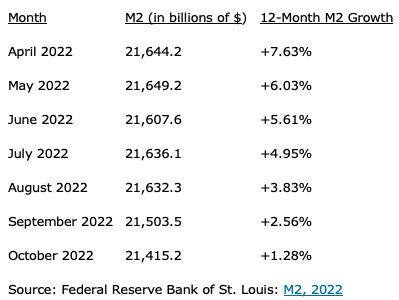
As you can see, the rate has been dropping by more than 1% per month, on average, since April, so with the yield curve getting more and more inverted and there being some lag time, we could turn negative by the end of 2022, when the data becomes available for November and December, or in early 2023.
A sharply inverted yield curve – and it is about to get more inverted on Wednesday after another 50 basis point Fed rate hike – constrains the flow of credit, which shrinks the growth of M2.
This is because the favorite “borrow short lend long” mantra of the US financial system stops working when short-term rates are above long-term rates. I think we are about to witness the first decline in M2 growth in recent history.


