
Forge First Asset Management commentary for the month ended December 31, 2019.
What a difference a year makes! During Q4 2018, the imposition of the first round of U.S. tariffs on imports from China, the cumulative impact of 200 bps of rate hikes from the Fed, and Chairman Powell’s comment that the Fed’s quantitative tightening program was on ‘auto pilot’ served to cause investors to flee from equities. Stocks took a 20% nosedive finishing down roughly 10% for 2018. A year later, Trump was cutting tariffs, the Fed had cut rates three times & since mid-September 2019 the Fed’s balance sheet had been growing at an annualized rate of 40%. Stocks were on fire, up 22% (TSX) to 35% (NASDAQ) for the year and investors chased equities into year end. Now with elevated valuation dispersion (good for ‘value’ stocks) but a modest outlook for growth (good for ‘growth’ companies), many investors are puzzled about what to do. After reviewing December and 2019 as a whole, this commentary will table a few thoughts and our bottom line on 2020.

Q4 2019 hedge fund letters, conferences and more
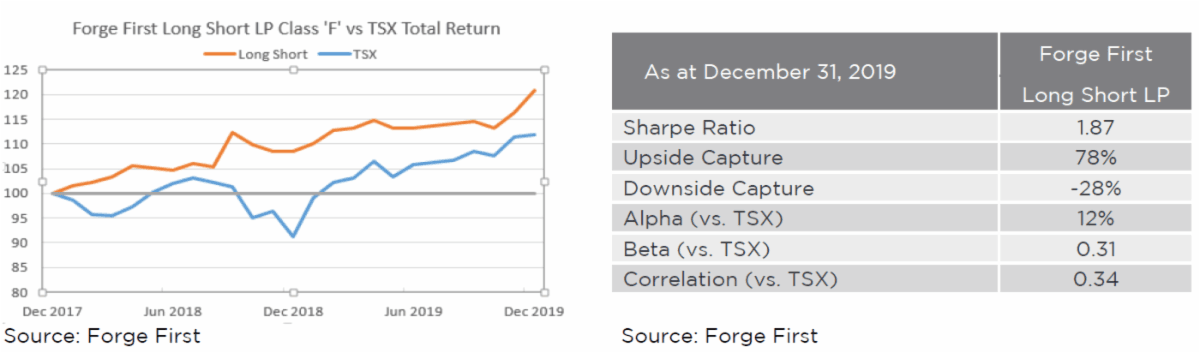
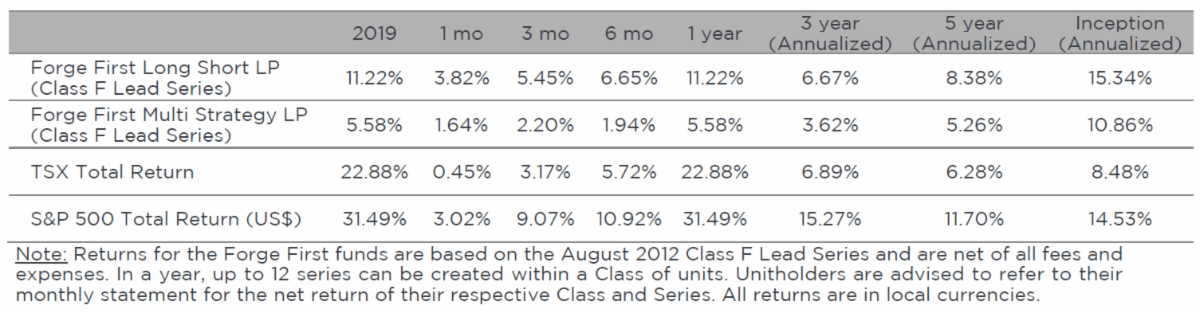
To start, we're pleased to report that December 2019 was a very strong month for our funds at Forge First. The Forge First Long Short LP Class F Lead Series printed its best month of the year to end 2019 up +11.22% net of fees. Given its +8.53% net return during 2018, the two year graph below demonstrates that our Long Short fund (orange line) has handsomely outperformed Canada's TSX (blue line), and done so with significantly less volatility. The table on the below right highlights additional statistics for the fund, specifically its 1.87 Sharpe ratio, negative downside capture of -28% and strong alpha generation, which sits at 12%. The Forge First Multi Strategy LP Class F Lead Series also enjoyed a strong finish to the year. As a result, this more conservative fund which targets a lower risk profile than Long Short, captured a +5.58% net return, after its +5.44% advance during 2018, and in line with its 5 year net CAGR of 5.26%.
During December 2019, energy and materials drove the majority of our returns, as our portfolios benefited from the early Q4 tactical repositioning of the funds that we had discussed in our October and November commentaries. Having witnessed an apparent reversal in the trend of global manufacturing indices, alongside reduced trade rhetoric and a dovish Fed, we increased the gross and net long exposure of our funds, boosted our exposure to cyclicals, shifted from owning put spreads to put options and shorted 'bond proxies'. Utilities, industrials and technology also contributed gains to the funds while ETFs, real estate and stocks in the consumer space generated modest losses.
At year-end 2019, the Long Short fund held gross and net exposures of 113% and 48% respectively. The largest net long positions were in the energy, technology, materials and industrial sectors while our collective position in ETFs was the only sector the fund was net short. Index put options represented a notional exposure of -3.7% and positions in fixed income totalled 3.6%. In contrast, our Multi Strategy fund held a combined preferred share and fixed income position of 21.7% as of December 31, 2019. In addition, this fund had a net long common equity position of 21.43%. Index put options represented a further -11.4% of notional exposure such that at yearend the gross and net exposure of this fund were 112% and 44% respectively.
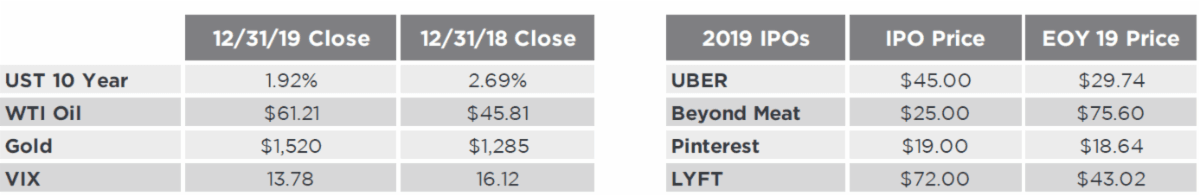
As for broader markets, 2019 turned out to be a year to own pretty much all asset classes. Closing 2018 with the yield of 2.69% shown in the table on the above left, U.S. 10 year government bonds generated great returns for investors, especially at their post-Labour Day bottoming yield of 1.46%. Oil and gold, gaining 33.6% and 18.3% respectively on the year speak to the return potential seen in commodities (ex-natural gas). Oddly in light of the strength in equity markets, 2019 turned out to be a weak year for IPOs, with 3 of the 4 shown in the table on the above right ending the year below their launch price. Of course, it's likely not a coincidence that many 'unicorns' experienced huge reversals in their valuations, with the poster child being WeWork.
Switching to public equities, other than pot stocks, all sectors on each of the TSX & S&P 500 generated solid gains. While the technology sector was the biggest gainer on both sides of the border (+50.3% in U.S. and +64.1% on the TSX), what's particularly interesting is how the graph on the below left shows that 'old' tech (blue line), specifically Apple (AAPL.US), Microsoft (MSFT.US) and Intel (INTC.US) smashed 'new' tech (white line), specifically Facebook (FB.US), Amazon (AMZN.US) and Alphabet (GOOG.US), during Q4 2019. Shifting to financials, post 2-3 years of expectations, U.S. bank stocks finally outperformed Canadian bank stocks, as seen from the right side of the 3 year graph on the below right.
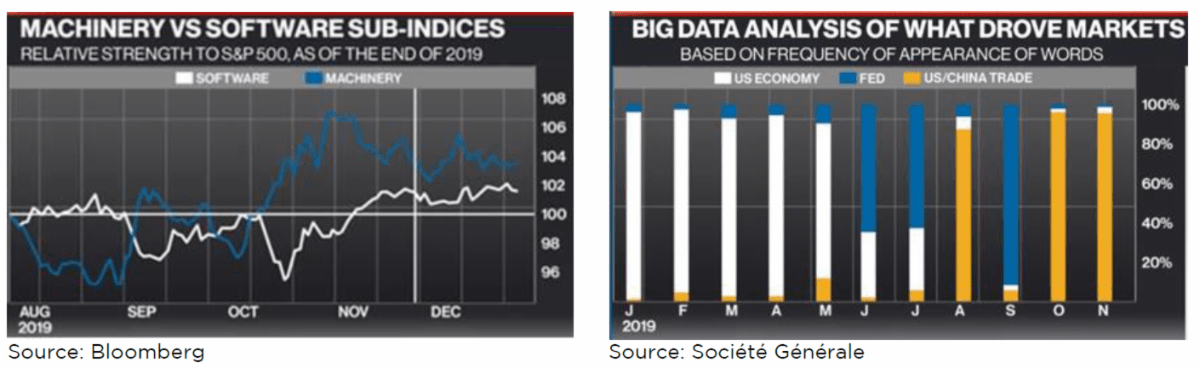
2019 was also a year which featured aggressive factor rotation as investor sentiment shifted from fears of recession early in the year to the 'risk on' mentality that began in early August. From that early August start date, the graph on the below left highlights that the relative strength of machinery stocks (blue line) to the S&P 500, a proxy for cyclical / value stocks, outperformed the relative strength of software stocks (white line) to the S&P 500, a proxy for growth / momentum, from mid-August into mid-November. Then from November 30th, the white vertical line, both sub-sectors performed in line with the S&P500, as according to Goldman Sachs, 'factor correlations were at record levels, ones achieved only twice in the last 30 years'. One perspective on what drove this factor volatility is implied by the graph on the below right. On a monthly basis, each vertical line highlights the percentage frequency one of the three keywords shown at the top of the graph appeared in the media. So while fears of a U.S. recession drove market action early in the year, by mid-year the eyes of investors had shifted to the Fed (which cut rates for the first time in late July), then on to U.S. China trade by October and November.
With unprecedented amounts of negative yielding debt (though 'just' $11T currently, down from $17T earlier in 2019), central banks around the world cutting interest rates, and numerous political uncertainties, it's no surprise that gold has performed well despite equities trading at all-time highs. The 3 year graph on the below left compares the price of bullion (blue line) against the gold stock index for the TSX (white line). Each of our funds continues to own shares in gold companies, with our largest single name exposure being Barrick Gold (ABX.CA). As for energy, oil to be more specific, we continue to own Canadian companies and short U.S. names. Our rationale for this positioning was discussed in our May commentary and its thesis remains intact. In short, we believed that the combination of the reality of full cycle economics and Wall Street's diminishing appetite to fund shale operators would cause forward expectations for growth to be trimmed substantially. This story began to play out during the latter months of 2019. In contrast, Canadian oil companies in our portfolios, such as MEG Energy (MEG.CA), Canadian Natural Resources (CNQ.CA) and Whitecap Resources (WCP.CA) are printing cash at this juncture, yet still remain cheap on strip pricing!
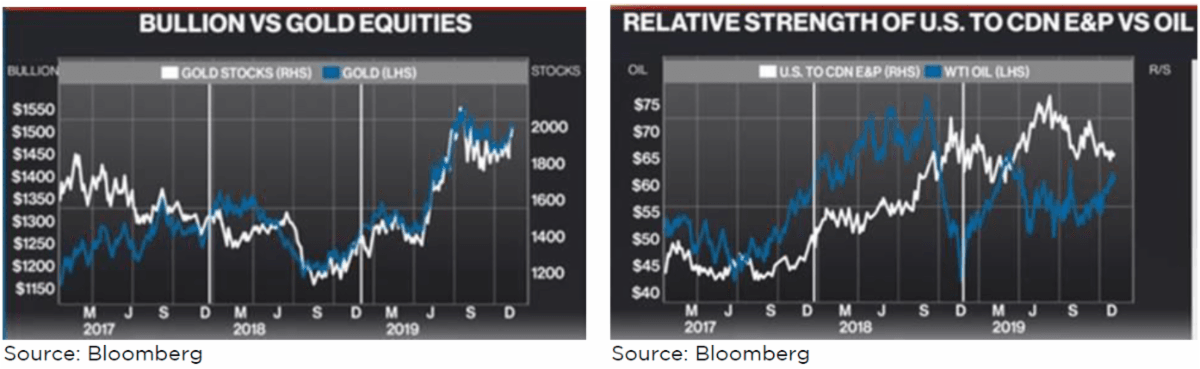
The 3 year graph on the above right compares the price of WTI oil (blue line) against the relative strength of the U.S. to Canadian E&P sector (white line). We expect the noticeable shift in performance that began in mid-2019 to continue during 2020, thanks to a continuation of the challenges facing the U.S. sector, the gradually improving sentiment towards egress availability for Canadian oil and the shareholder friendly financial statement discipline being exhibited by our investee companies.
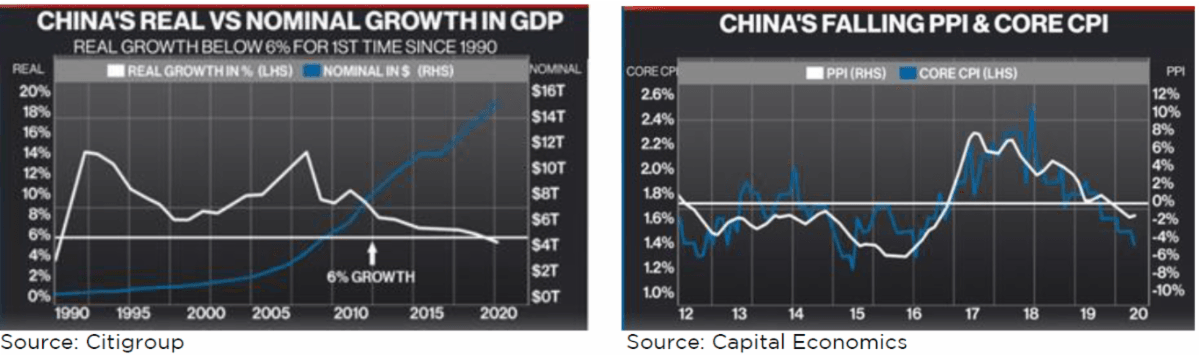
Shifting to 2020, focusing on quantifiable factors, the two most significant drivers for financial markets will be the state of the U.S. economy and what happens with the rhetoric and actions on global trade. First off we isolate these variables because the U.S. remains the 'best house on a bad street'. China's economy should continue to 'muddle along' but it will not reaccelerate. In fact, as can be seen in the graph on the below left, real GDP growth (white line on left axis) for 2020 is expected to fall below 6% for the first time in almost 30 years. Also, Beijing is cognizant of the country's financial leverage and, aside from a reduction in short term interbank rates, the government has yet to cut interest rates for fear of further stimulating its housing market, a sector in which prices remain high thanks to low inventory even though pricing strength has recently softened. While it's wrong not to positively view the recent cut in the banking system's required reserve ratio, it's important to be aware that: a) corporate defaults are rising and b) industrial sector profitability continues to fall, such that the government needs to act so as to ensure China's banks have the capital flexibility to lend. In other words, it's not about generating faster growth. As for the consumer, recent PMIs hint that employment conditions have stabilized but retail sales, especially on an inflation-adjusted basis continue to slow, especially for durable goods. Last, while food inflation is grabbing all the headlines, thanks to the roughly 170% year over year increase in the price of pork, the preferred source of animal protein, the graph on the below right shows that it's actually falling prices that are the problem for China.
Shifting to Europe, growth and inflation trends remain soft and we're far from convinced that we'll see the much discussed and hoped for significant fiscal stimulus in a timely fashion. While Macron's making decent headway at restructuring France, plus the country's less exposed to trade and manufacturing compared to other large EU nations, the outlook for Germany, the EU's largest economy, remains lousy. Meanwhile, Italy will continue to face election and fiscal uncertainty, while the Spanish economy isn't big enough to offset the aggregate drag from other countries. Across the Channel, as long as the potential for a hard Brexit exists it's tough to see upside for either the UK or EU from that situation. As a result, in assessing the policy outlook for Europe, interest rate policy will remain punitive for banks and savers and the Euro (a 58% weight in the 'DXY' index) will only rise if the U.S. economy softens enough to force the Fed to cut rates again.
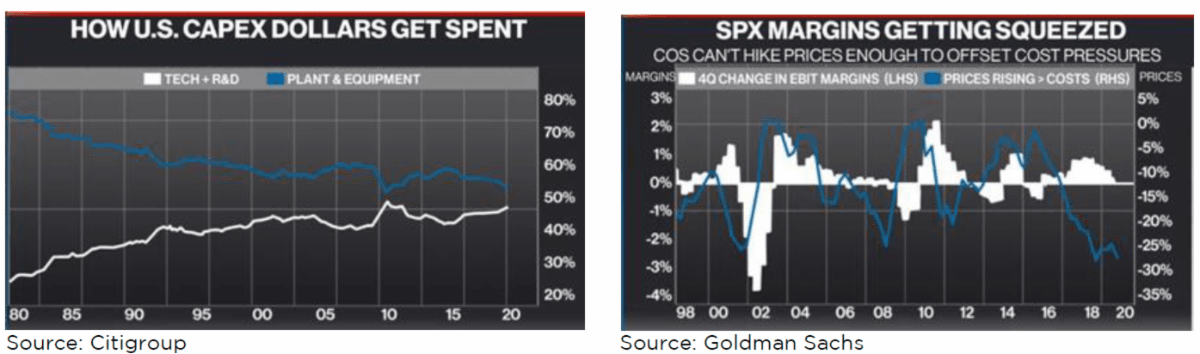
It's widely expected that U.S. growth will fall below a 2% annualized rate during Q1 of 2020. Think of the equation for GDP: consumption + government spending + investment + net trade. During 2019, consumption and government spending were the two growth drivers for the American economy. Entering 2020, after running an estimated US$1T or 4.8% of GDP fiscal deficit for F2019, the rate of change in government spending won't make much of a contribution to growth. If one can believe the implied massive increase in U.S. exports that the Chinese are expected to buy as a result of the Phase 1 trade deal, trade should deliver a positive reversal. That leaves consumption and investment as the two sources of uncertainty. Having lapped the tax cuts and boosts to minimum wage, the contribution from consumption is expected to slow, however ongoing wage hikes will ensure that this segment of the U.S. economy continues to help not just the U.S., but the 16% of the global economy that is represented by the U.S. consumer. The big question mark is investments. Housing looks poised to improve further but what about capital spending. Will Boeing (BA.US) begin manufacturing the Max 370 again? In this election year, will trade rhetoric decrease, serving to boost the currently low confidence of CEOs towards spending money. As can be seen from the graph on the below left while spending on tech and R&D is approaching 50% of total investment spending, spending on plant & equipment still constitutes the majority of dollars.
If the U.S. consumer hangs in and housing and investment strengthen then the U.S. economy will beat consensus expectations of 1.8% real GDP growth in 2020. Under this scenario, America's rate of relative growth will beat forecasts and ensure that the Fed does not cut rates again this year. This combination would likely prevent the U.S. dollar from experiencing its predicted deep dive. If the U.S. economy is weaker than expected, perhaps because manufacturing weakness spreads to the rest of the economy, the Fed would likely be forced to cut rates again and extend its balance sheet expansion program. Such an outcome would cause the U.S. dollar to experience additional declines. Whichever scenario occurs has profound implications for markets.
A rebound in manufacturing activity and easing trade tensions could support the relative performance of technology and industrial stocks. Such an improvement would also be supportive of banks. However, as shown by the 20 year graph on the above right, given the rising burden of costs increasing more than companies have been able to raise pricing (the falling blue line on the right axis), it's likely that profit margins (white line on the left axis) will fall for the second consecutive year during 2020, and a whole host of labour intensive companies could underperform. Of course there is a plethora of non-quantifiable uncertainties facing markets including numerous geopolitical events, U.S. politics, potential for heightened regulatory scrutiny of big tech and the continued rise of populism.
Here in Canada, we expect a continuation of the bi-polar nature of the Canadian economy. The largest urban markets, Toronto, Montreal and Vancouver will continue to do well, while most other parts of Canada will lag to differing degrees. Toronto, for example, will enjoy the 5th year of its structural renaissance driven by immigration and technology, which in turn supports its real estate markets. Unless we're wrong in thinking that the price for WTI oil will generally remain range bound, between the low $50s to low $60s, wells drilled will fall again in 2020. While stronger U.S. housing should help our forestry sector, much of the benefit will remain with U.S. companies while domestic mining capex is not expected to rebound significantly. Entering 2020 trading at US$0.7713, it's likely the Bank of Canada will finally cut interest rates. Collectively these items suggest that Canadian bank stocks are likely not to outperform the broader market for the second consecutive year.
As for the funds at Forge First, our portfolio construction remains 10-15% top down and 85-90% bottoms up stock picking. The macro overlay helps us identify the appropriate gross and net exposure levels for individual sectors and the overall portfolio. This macro work also enables us to identify themes. Recently we have reduced the net exposure for each fund roughly 5%. We're likely to continue to reduce the net exposure of the funds, reverting back towards the lower end of the net exposure range of the portfolios through most of 2019. It's not that we have an overtly bearish outlook, but rather that we believe dispersion could reemerge amongst sectors and the result will be a market that rewards tactical sector exposure and bottom up stock picking. Given our value focus, it pleases us to admit that we can't help but see more compelling long opportunities in value stocks at the moment, a theme that permeates through our portfolios in both the long and short books.
By the end of the year oil markets began to feel relatively well balanced and the result was that we actively reduced both oil and gas net exposure throughout December. Based on both management meetings and our analysis of the aggregate (modest) free cash flow coming from the US E&P sector we held the view that non-American oil producers in particular had a very constructive setup into both Q4 and 2020 as we expect US capex budgets are poised to contract significantly. However, from our perspective, much of the upside we had considered available in the energy trade seemed to be priced in by New Year's Eve, hence our reduction in exposure into this strength.
Subsequent to year end new political risk to supply has been introduced via the escalation of the US-Iran conflict. As a result, we plan to sit tight with our current delta adjusted net exposure to oil-based E&Ps of 10.5% in the Long Short LP and 5.2% in the Multi Strategy LP. Our emphasis continues to be on free cash flow producers. Should we see a sustained pickup in US drilling and completions activity (a logical progression given the strength in crude above $60) then we may be forced to reconsider our continued relatively bullish positioning
Our exposure to materials is largely concentrated in mining equities. Our default 5% net weight in gold equities was a solid contributor to 2019 performance and is an exposure we believe will continue to generate positive returns for our investors given: 1) the escalation of conflict(s) in the Middle East, 2) a potentially contentious and polarizing U.S. election, 3) continued central bank easing the world over 4) the potential re-emergence of fiscal stimulus around the world and 5) potentially stagnant equity market returns. Beyond gold we have begun to dip our toe into more cyclical commodities like copper and lumber, albeit only modestly for now.
Technology continues to represent a meaningful net exposure for our investors. Beyond core positions in cash cows Microsoft (MSFT.US) and Alphabet (GOOG.US), we have invested in two other verticals in the tech sector, cyber security and what I'll categorize as fintech. With the now ever-present threat of cyber-attacks we're attracted to the growth outlook for Palo Alto (PANW.US) and free cash flow generating capability of Checkpoint Software (CHKP.US).
At the behest of the soon-to-be-passed United Nation Principles for Responsible Investment (UNPRI), Goldman Sachs believes ESG-focused AUM should double to US$45 trillion this year alone. To gain exposure to this enormous yet still nascent secular trend, we own a basket of fintech 'picks n shovel' companies positioned to benefit from the explosion in ESG investing, specifically rating agencies (SPGI.US), index providers (MSCI.US) and ESG risk/factor analytics firms (MSCI.US, MORN.US).
To wrap up, a year ago we would never have guessed that financial markets would have been as strong as they ended up being during 2019. The obvious question is whether it can happen again. Our answer is it's possible but not likely. We believe the investment road of 2020 will have several detours to navigate and gridlock to surmount, resulting in a volatile year but fertile ground for a team whose funds always include a diversified short book.
Thank you for your support and your business during 2019. We look forward to continuing to offer investors an increasingly important sleeve for their portfolios as this financial and business cycle matures.
Please visit our website at www.forgefirst.com for information on our funds. Should you have any questions, please contact us.
Thank you,
Daniel Lloyd
Portfolio Manager
D: 416-597-7934
Andrew McCreath, CFA
President and CEO
D: 416-687-6771


