
This Wednesday’s Federal Reserve meeting came and went without significant impact. Indeed, interest rates held steady, as expected. The language out of Fed chair Jerome Powell’s accompanying statement was mostly unchanged from the prior March meeting.
One interesting snippet from the meeting was that according to the Fed, inflation has “moved close to its 2 percent” target. [We have discussed in the past the destructive nature of a 2 percent inflation target, and the resulting loss of 50% in purchasing power of the US dollar every 35 years. One of the most fundamental definitions of money is that it should serve as a store of value – here the Fed has implemented a policy such that the US dollar specifically does not.]
In sum, the Fed has made an “achievement” in reaching its inflation goal. This sets the stage for another interest rate hike at the upcoming June 12-13 meeting to a new target of 1.75% – 2.00% for the short-term federal funds rate. The futures market is indeed already pricing in a near-certainty of the increase in June (below, right):
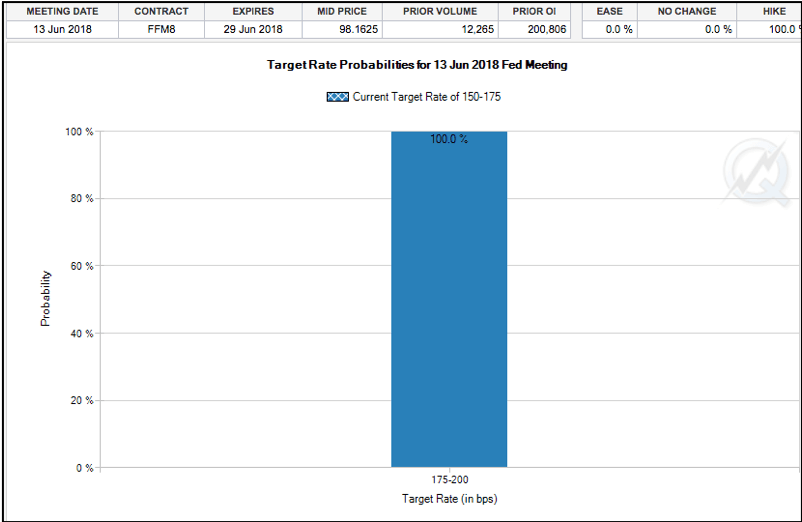
We remind new readers that the Fed has raised interest rates six times since December 2015, and gold has seen a higher associated price on five of those occasions, rising from $1,045 to $1,315 in the process. This is in complete contrast to the mainstream narrative that rising interest rates are negative for precious metals. The March interest rate hike occurred with gold bottoming at $1,305. Will the June hike see another higher gold price? We expect it will.
Gold
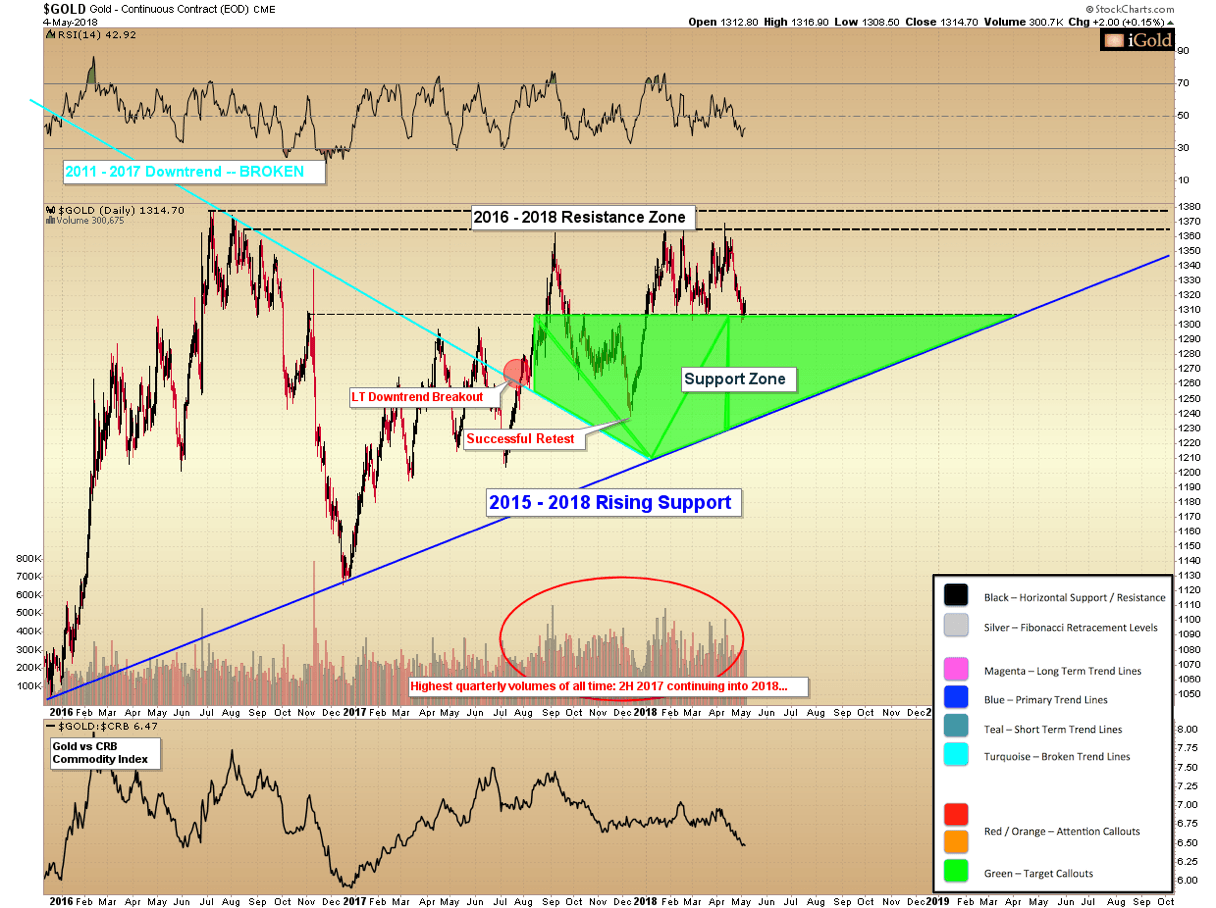
For the week, gold finished lower by nearly $9 or 0.7% to close at $1,315 as of the final trade on the New York COMEX futures exchange by Friday afternoon, which closes at 1:30 pm EST. Prices drifted higher by another $2 in the electronic access market by the end of trading at 5:00 pm. Gold is now within what is an 18-week consolidation between $1,302 – $1,369. This is officially the longest and tightest (in percentage terms) consolidation since the December 2015 bottom.
Turning to the charts, we see that the consolidation has an amplitude of $67. A break of the consolidation will result in a short-term target equal to the amplitude of the consolidation, in whichever direction the pattern resolves. Thus, a break lower results in a target of $1,235 or nearly equal to the December 2017 low, while a break higher yields a target of $1,436.
Leading Signals Turn Positive
The near-term technical situation for gold remains unchanged, although leading indicators have shifted more positive over the past week. Specifically, the GDX large-cap gold miners fund has clearly made a higher-low over the past week at 22.05, even as gold itself has made a nominal new low at $1,302 for the ongoing consolidation. When we focus on the intermediate-term, we can see that this outperformance in the mining sector now stems back to the February lows:
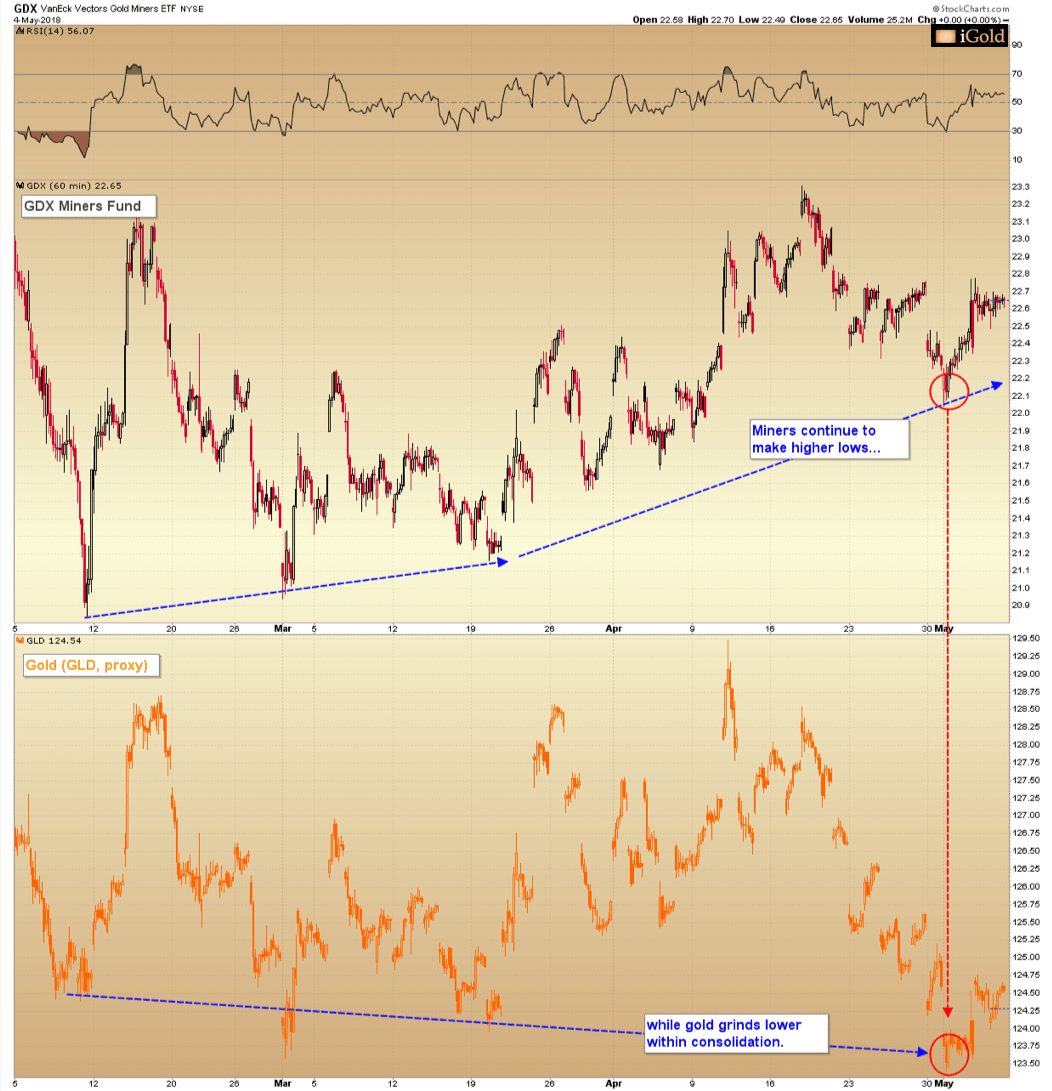
Yes, this outperformance in the miners comes after underperformance which has lasted nearly 16 months, but it is nonetheless encouraging to see this attempt by the miners to show leadership at this important juncture. One higher low does not make a trend, but it does provide a suggestion that the gold price still has an opportunity to move higher later this year and into 2019.
Back to Gold
Returning to gold itself, we can envision a scenario whereby if the present consolidation between $1,302 – $1,369 were to resolve lower, the miners may hold recent lows even as gold falls briefly back into its green support zone. Alternatively, the miners may be hinting that gold will hold its present support level and resolve higher without dipping back into the $1,200’s again. Either way, it is a small but distinct positive divergence to see the miners now outperforming for the past three months. Let us watch to see if this signal foretells a break in gold above 2016 highs over the coming months.
Christopher Aaron | Bullion Exchanges Market Analyst
Christopher Aaron has been trading in the commodity and financial markets since the early 2000’s. He began his career as an intelligence analyst for the Central Intelligence Agency, where he specialized in the creation and interpretation of pattern-of-life mapping in Afghanistan and Iraq. His strategy of blending behavioral and technical analysis has helped him and his clients to identify both long-term market cycles and short-term opportunities for profit.
This article is provided as a third party analysis and does not necessarily matches views of Bullion Exchanges and should not be considered as financial advice in any way.


