The FED allows banks to do much more than what is proper based on the “economy is still bad” narrative. What does this mean for a private investor?
Q1 2021 hedge fund letters, conferences and more
Banking on a Comeback
With the U.S. Federal Reserve (FED) releasing its annual bank stress tests on Jun. 24, Vice Chairman for Supervision Randal Quarles said that “the banking system is strongly positioned to support the ongoing recovery.” For context, the FED’s stress tests analyze the health of U.S. banks’ balance sheets and reveal how they would fare if hypothetical economic doomsdays were to occur.
And while Chairman Jerome Powell told Congress on Jun. 22 that the U.S. economy “is still a ways off,” the results of the stress tests are a contradiction. Case in point: the report revealed that since “all 23 large banks tested remained well above their risk-based minimum capital requirements […] the additional restrictions put in place during the COVID event will end .”
Translation? The FED will allow U.S. banks – like JPMorgan , Bank of America and Citigroup – to resume share buybacks and standard dividend payments (roughly $130 billion worth) as of next month.
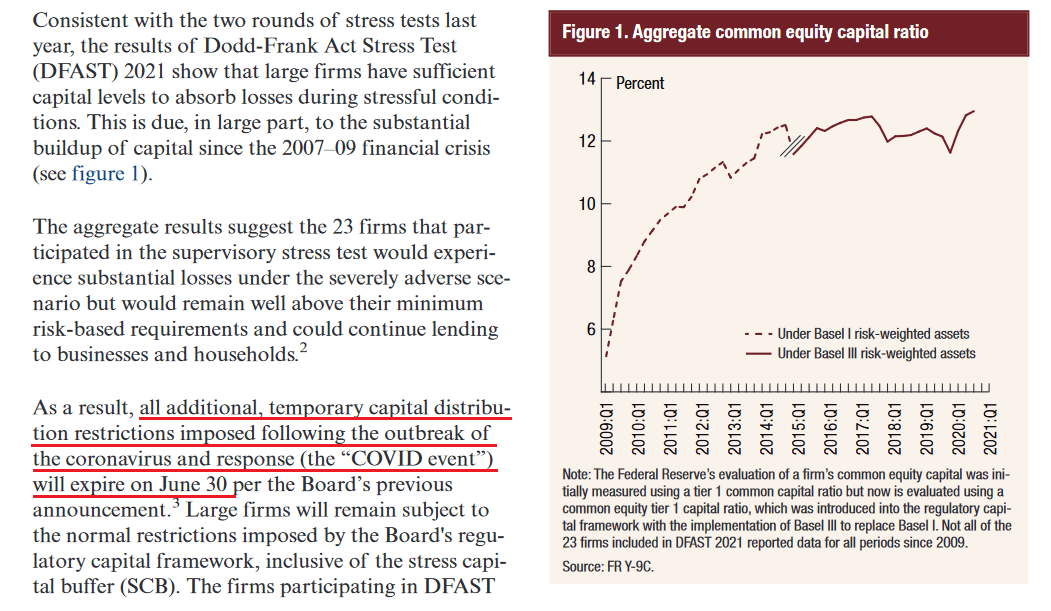
Please see below:
Source: U.S. FED
On top of that, the FED considers the following a scary situation:
“The severely adverse scenario is characterized by a severe global recession accompanied by a period of heightened stress in CRE and corporate debt markets. The U.S. unemployment rate climbs to a peak of 10-3/4 percent in the third quarter of 2022, a 4 percentage point increase relative to its fourth quarter 2020 level. Real GDP falls 4 percent from the end of the fourth quarter of 2020 to its trough in the third quarter of 2022. The decline in activity is accompanied by a lower headline consumer price index (CPI).”
However, even if this hypothetical malaise occurs, the FED believes that all 23 banks will pass the test with flying colors.
Please see below:
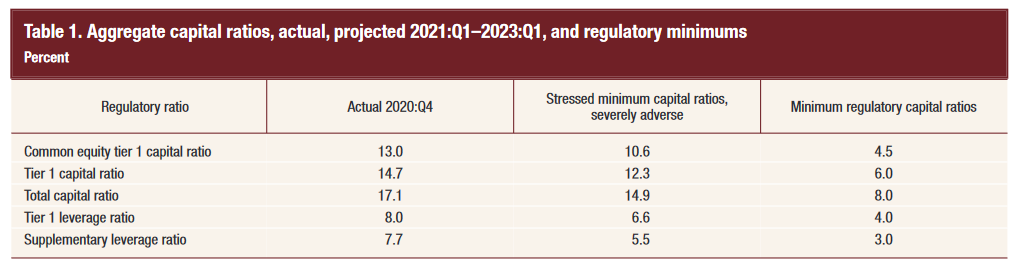
Source: U.S. FED
To explain, the third column from the left depicts the banks’ regulatory capital ratios under the “severely adverse scenario.” Moreover, if you compare the results with the fourth column from the left, you can see that even if an economic meteor strikes, participants’ ratios will still remain above their regulatory minimums. For context, common equity tier 1 capital (CET1) is the most liquid source of banks’ capital, and the CET1 ratio is used to gauge banks’ ability to absorb losses should an economic shock occur.
But why is all of this so important?
Well, if the FED was so worried about the U.S. economy, would it allow financial institutions to frivolously spend their collateral on dividends and share buybacks? Remember, U.S. banks supply credit card loans, mortgages, commercial loans and finance the sectors that were hardest hit by COVID-19 (commercial real estate, hospitality, energy, etc.). Thus, with the FED giving banks the ‘all-clear,’ it’s a sign that the U.S. economy is much stronger than the FED lets on.
In addition, The White House announced on Jun. 24 that a $1.2 trillion infrastructure deal was reached . And calling the milestone “the largest federal investment in public transit in history and the largest federal investment in passenger rail since the creation of Amtrak,” lawmakers want to cook the U.S. economy until it boils. For context, the agreement includes $579 billion of new spending with the rest being diverted from untapped coronavirus-relief funds.
Please see below:
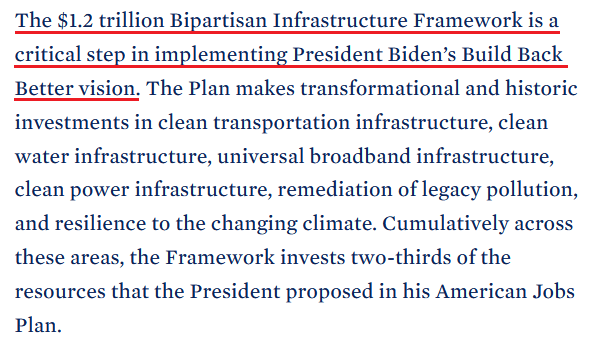
Source: The White House
More importantly, though, with U.S. lawmakers hell-bent on pushing the limits of inflation and economic growth, the ominous impulse remains bullish for the U.S. 10-Year Treasury yield and the USD Index. Regarding the latter, if U.S. GDP growth outperforms the Eurozone, the EUR/USD – which accounts for nearly 58% of the movement of the USD Index – should suffer in the process. Likewise, with the U.S. 10-Year Treasury yield materially undervalued relative to realized inflation and prospective GDP growth , unprecedented spending should put upward pressure on interest rates. Furthermore, the bullish cocktail should force the FED to taper its asset purchases in September .
To explain, while the PMs are allergic to a rising U.S. 10-Year Treasury yield, the latter doesn’t have to move for the metals to suffer. For example, following the FED’s announcement on Jun. 16, the U.S. 2-Year, 3-Year and 5-Year Treasury yields surged. And while the development flattened the U.S. yield curve – meaning that short-term interest rates rose while long-term interest rates stood pat – the PMs still suffered significant drawdowns. Thus, while the U.S. 10-Year Treasury yield remains ripe for an upward re-rating, even if it stays in consolidation mode, short-term interest rate pressures are just as ominous.
Will We See Another Inflation Surprise?
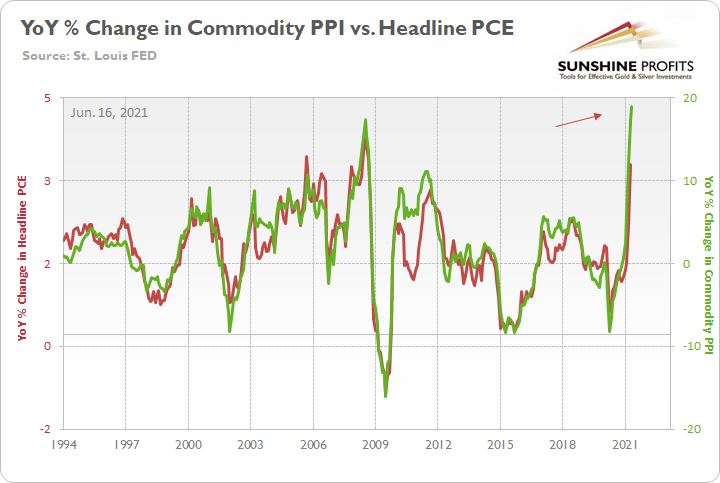
To that point, with the Personal Consumption Expenditures (PCE) Index scheduled for release today, another inflation ‘surprise’ could rattle the bond market once again. To explain, I wrote on Jun. 22:
The FED increased its year-over-year (YoY) headline PCE Index forecast from a rise of 2.40% YoY to a rise of 3.40% YoY on Jun. 16. However, with the Commodity Producer Price Index (PPI) surging by 18.98% YoY – the highest YoY percentage increase since 1974 – the wind still remains at inflation’s back. Moreover, with all signs pointing to a YoY print of roughly 4% to 4.50% on Jun. 25, the “transitory” narrative could suffer another blow on Friday.
As further evidence, the Kansas City FED released its Manufacturing Survey on Jun. 24. And with the composite index rising from 26 in May to 27 in June, Chad Wilkerson, vice president and economist at the KC FED, had this to say about the current state of affairs:
“Regional factory activity rose again in June and expectations for future activity were the highest in survey history . While the majority of firms continue to face increasing materials prices and labor shortages, many firms have also increased selling prices and capital expenditures for 2021.”
To that point, while the KC FED’s prices paid and prices received indexes declined slightly from their all-time highs, both gauges remain above their prior historical peaks.
Please see below:
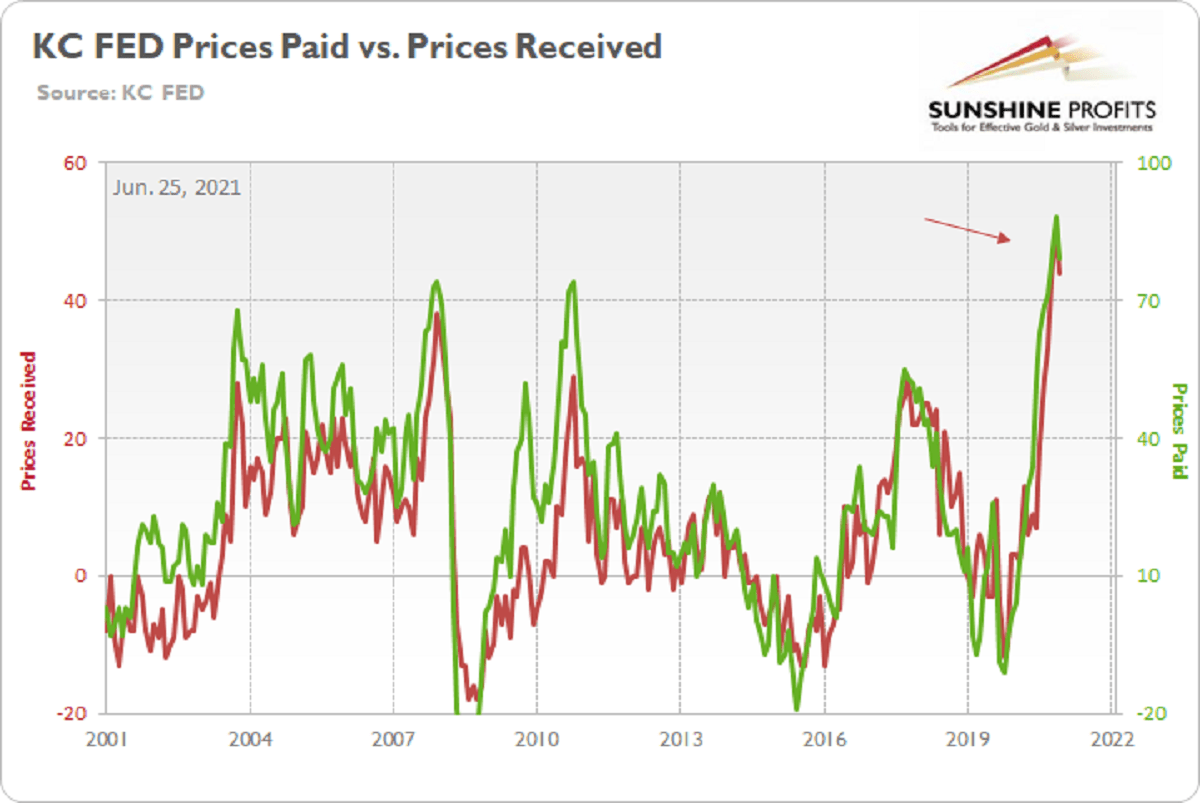
To explain, the green line above tracks the KC FED’s prices paid index, while the red line above tracks the KC FED’s prices received index. If you analyze the right side of the chart, you can see that both remain extremely elevated.
On top of that, survey respondents provided the following anecdotal evidence:
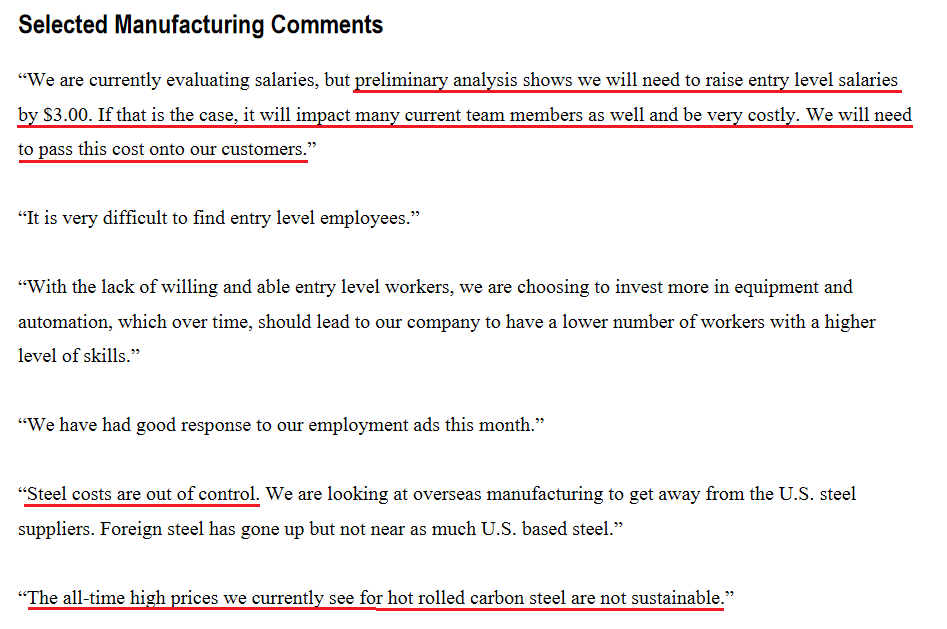
Source: KC FED
Also supportive of future economic growth, U.S. manufacturers spent $36.218 billion on machinery in May (the data was released on Jun. 24) – only a slight decrease from the all-time high of $36.364 billion set in April. And with machinery representative of long-lived assets that have high breakeven costs, the recent splurge signals that manufacturers remain optimistic about the recovery.
Please see below:
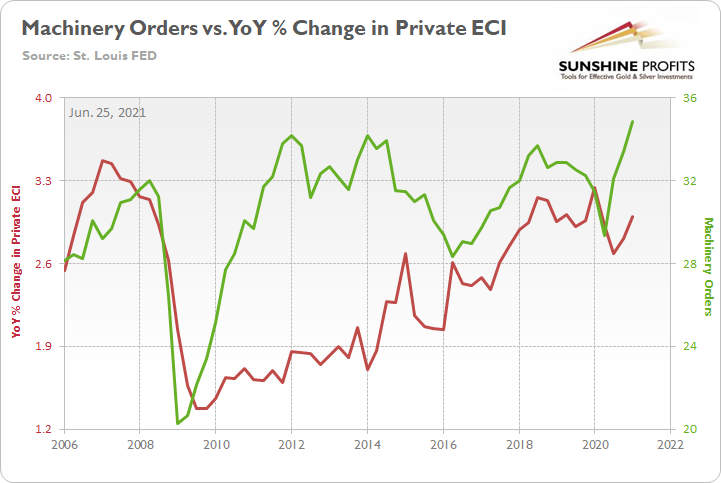
To explain, the green line above tracks manufacturers’ machinery orders, while the red line above tracks the YoY percentage change in the Private Employment Cost Index (ECI). If you analyze the relationship, you can see that when manufacturers invest in long-term equipment, wage inflation often follows. As a result, if the two lines continue their ascent, it will only increase the odds that the FED tapers in September. Forecasting more hawkish, not more dovish FED seems to be appropriate at this time.
Knock Knock? It’s China, We Want More Money
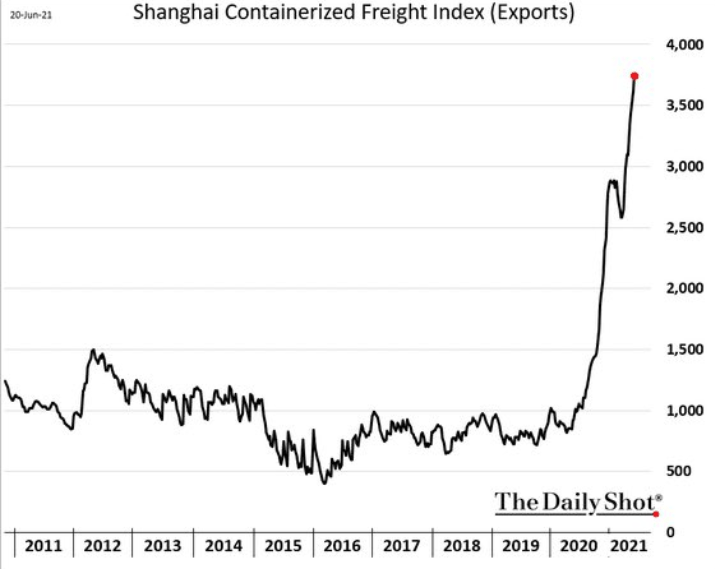
On top of that, with the U.S. goods trade balance (exports minus imports) revised to -$88.11 billion on Jun. 24, foreign production is required to stock U.S. shelves. And with the Shanghai Containerized Freight Index (the cost to ship from China) unrelenting in its parabolic rise, it’s another indicator that inflationary pressures are unlikely to abate anytime soon.
Finally, with the FED selling another $813 billion worth of reverse repurchase agreements on Jun. 24 (~$53 million below the all-time high set on Jun. 23), the liquidity drain remains on schedule.
Please see below:
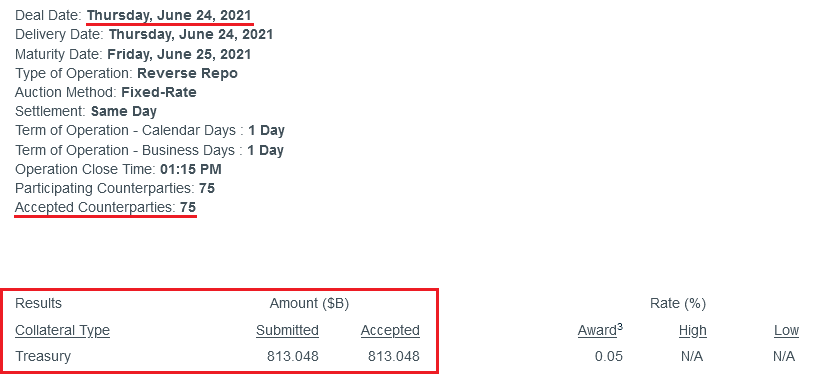
Source: NY FED
To explain the significance, I wrote previously:
A reverse repurchase agreement (repo) occurs when an institution offloads cash to the FED in exchange for a Treasury security (on an overnight or short-term basis). And with U.S. financial institutions currently flooded with excess liquidity, they’re shipping cash to the FED at an alarming rate.
More importantly, though, after the $400 billion level was breached in December 2015, the FED’s rate-hike cycle began. On top of that, the liquidity drain is at extreme odds with the FED’s QE program. For example, the FED aims to purchase a combined $120 billion worth of Treasuries and mortgage-backed securities per month. However, with daily reverse repurchase agreements averaging $520 billion since May 21, the FED has essentially negated 4.33 months’ worth of QE in the last month alone.
In conclusion, while the PMs should recover a meaningful chunk of last week’s downswing, their medium-term outlook isn’t so sanguine. With FED hawks and doves splintered down the middle, the fundamentals are firmly tilted in the former’s favor. And with inflation and U.S. GDP growth both accelerating concurrently, unemployment is the only card left for the doves to play. However, with enhanced unemployment benefits expiring in early July for roughly 30% of claimants, U.S. nonfarm payrolls should show strength in August and September. Thus, with the FED’s taper talk likely to grow louder over the next few months, the PMs may not like what they will hear.
Thank you for reading our free analysis today. Please note that the above is just a small fraction of today’s all-encompassing Gold & Silver Trading Alert. The latter includes multiple premium details such as the targets for gold and mining stocks that could be reached in the next few weeks. If you’d like to read those premium details, we have good news for you. As soon as you sign up for our free gold newsletter, you’ll get a free 7-day no-obligation trial access to our premium Gold & Silver Trading Alerts. It’s really free – sign up today.
Przemyslaw Radomski, CFA
Founder, Editor-in-chief
Sunshine Profits: Effective Investment through Diligence & Care
All essays, research and information found above represent analyses and opinions of Przemyslaw Radomski, CFA and Sunshine Profits’ associates only. As such, it may prove wrong and be subject to change without notice. Opinions and analyses are based on data available to authors of respective essays at the time of writing. Although the information provided above is based on careful research and sources that are deemed to be accurate, Przemyslaw Radomski, CFA and his associates do not guarantee the accuracy or thoroughness of the data or information reported. The opinions published above are neither an offer nor a recommendation to purchase or sell any securities. Mr. Radomski is not a Registered Securities Advisor. By reading Przemyslaw Radomski’s, CFA reports you fully agree that he will not be held responsible or liable for any decisions you make regarding any information provided in these reports. Investing, trading and speculation in any financial markets may involve high risk of loss. Przemyslaw Radomski, CFA, Sunshine Profits’ employees and affiliates as well as members of their families may have a short or long position in any securities, including those mentioned in any of the reports or essays, and may make additional purchases and/or sales of those securities without notice.


