There is a popular investment saying: “A bell is never rung at the top of a bull market.” My question is this: If euphoria is a sign of a market top, then is a bell rung near the top?

Robert Rhea, 1938: “The final leg is sometimes recognizable because excited people buy stocks simply because they go up and because other excited people are buying them.”
A scribble painting that looks like it was done by my cat (and that I would pay someone to cart away) just sold for over $110-million. Excitement?
And then there is this. Excitement?
More excitement as 4x leveraged ETFs are approved by the current administration’s SEC.
The following chart shows just how well leverage performs in large-cap stock ETFs (it is worse in higher volatilty ETFs such as in small-cap stocks). It shows the Compounded Annual Growth Rate (CAGR) of the S&P-500. So, plotting the S&P-500 between the years of 1950 and 2009:
- No leverage = very good.
- 2x leverage = almost twice as good with only slightly more than twice the risk.
- 3x leverage = only slightly better than 2x but with much more risk.
- 4x leverage = performs worse than 3x leverage and almost no better than 2x leverage but with gigantic risk. (If you use 4x leverage with small-cap stocks, then you only generate a CAGR of 2% which literally means that, over time you will lose money, not make money… it is sort of “no gain and all pain.”)
The reason is too complicated to go into here, but briefly, the price decay is caused by leveraged ETFs having to rebalance daily which causes normal volatility to lead to a continual erosion in price. So, what does the current SEC’s approval of 4x leveraged ETFs show, other than stupidity? It shows that we are approaching euphoria.
Excitement in stocks is a late-stage phenomenon that causes a steadily upward moving stock market and we are solidly in the late-stage of the current market cycle. Excitement causes the market to just keep rising toward euphoria. Excitement causes investors to just keep buying stocks. Growth becomes self-reinforcing. While there will be some market difficulty between now and then, the eventual euphoria causes a stock “melt-up” that no investor wants to miss out on.
This is a 10/17/17 screen shot from CNBC of an investment professional that I respect, Savita Subramanian of BOA. I love watching her in action; always the smartest and most patient person in the room:
Mid-October 2017 Consumer Sentiment is now at higher levels than was the euphoria at the top of the prior bull market in 2007:
MarketCycle’s proprietary (improved) take on the Hindenburg Omen (which is designed to show investor euphoria) clearly shows the recent euphoric spikes in the market (red lines). An economic-recession usually follows, sometimes still 1.5 years away from the signal date:
The market refuses to go down despite an almost historic 16 months without a normal 5% correction. Excitement?
- YES
The market refuses to go down despite chronic horrible news and constant fighting across the globe and an environment that seems to be imploding and totally dysfunctional world governments… and “Tweets” galore. Excitement?
- YES
The market very recently recovered, without a typical correction, from recognizable and quantifiable weakness in market internals (such as the ‘breadth of bullish volume’ or the ‘spreads in relative strength between high-risk and low-risk assets’). Excitement?
- YES
Money is pouring into high beta stock positions such as technology. Excitement?
- YES
Mom & Pop are starting to invest in stocks because they finally see that the bear market (that actually ended in the Spring of 2009) is now “finally absolutely over.” Excitement?
- YES
EXCITEMENT and the resultant EUPHORIA equate with the prolonged second half of the late-stage of a strongly bullish stock market which can last for over a year and which ends only when the last retail investor manages the courage to finally buy stock shares from the professionals that are still talking up the market but are secretly finally selling.
Right now, the United States rules the markets. It has the safest stock market, the strongest currency (long-term) and the safest protective asset (U.S. extended-duration Treasury-bonds). It is in the late stage, so the best current positions are in larger-sized profitable quality, momentum, low-volatility cyclical stocks (IE, not utilities), stocks that are not negatively effected by rising rates, select growth stocks (IE, IBD-50 stocks), disruptive innovation companies (yes, there is even an ETF for this that holds blockchain & bitcoin & A.I. etc.), the sectors of technology, health-care, industrials and banks, and variable-rate preferred shares.
The U.K. and Australia, Canada and South Korea(!) are all about to move into recession-like conditions. Japan helps to diversify U.S. stock market holdings and it is becoming consistently stronger (plus pro-stimulus Abe was re-elected on 10/23/17) and historically it has performed well whenever the U.S. has raised interest rates, but it is sitting right on the doorstep of North Korea; it’s likely okay but risk is obviously higher than in the United States. Brazil is becoming strong. China & India are good bets as is any country in the northern half of Europe. The problem with Europe, even though it is more reasonably valued, is that it moves in lockstep with the United States, so it doesn’t offer much in the way of diversification benefits. Equity positions can be most easily taken via ETFs which also usually prove to be more profitable than individually selected stock positions. An equity ETF is simply a bundle of individual stocks that have been grouped together for a particular reason and that, on a trading Exchange, Trade together as one Fund.
- So, what is the future of interest rates in the United States? President Trump appears to have an agenda of wanting to undo anything that President Obama did, no matter what it was, and this may progress to include (in early 2018) replacing Janet Yellen as the head of the Federal Reserve with someone (Jerome Powell?) who is more likely to keep interest rates artificially low and to allow inflation to increase; the dreams of any real estate titan. It would be a major blunder on Trump’s part to replace Yellen, but if this does happen, and if Powell is the pick, it might give a strong boost to commodities (& gold?) and Emerging Markets, both of which are already normally considered advancing late-stage assets.
So, if problems with North Korea begin to cool down, one might consider Japanese stocks (not currency hedged). And if it looks as if Jerome Powell will be nominated by President Trump, consider Emerging Market stocks (also not currency hedged) or perhaps global natural resource stocks or global mining shares. But remember that right now: The United States rules the markets.
- For possibly the next year, any fighting around North Korea would very likely be a regional conflict. North Korea may lob a missile at South Korea on occasion, but it isn’t stupid enough to actually seriously attack a U.S. strategic partner. Regional conflicts do not halt global trade, which merely trades around the region that is in conflict.
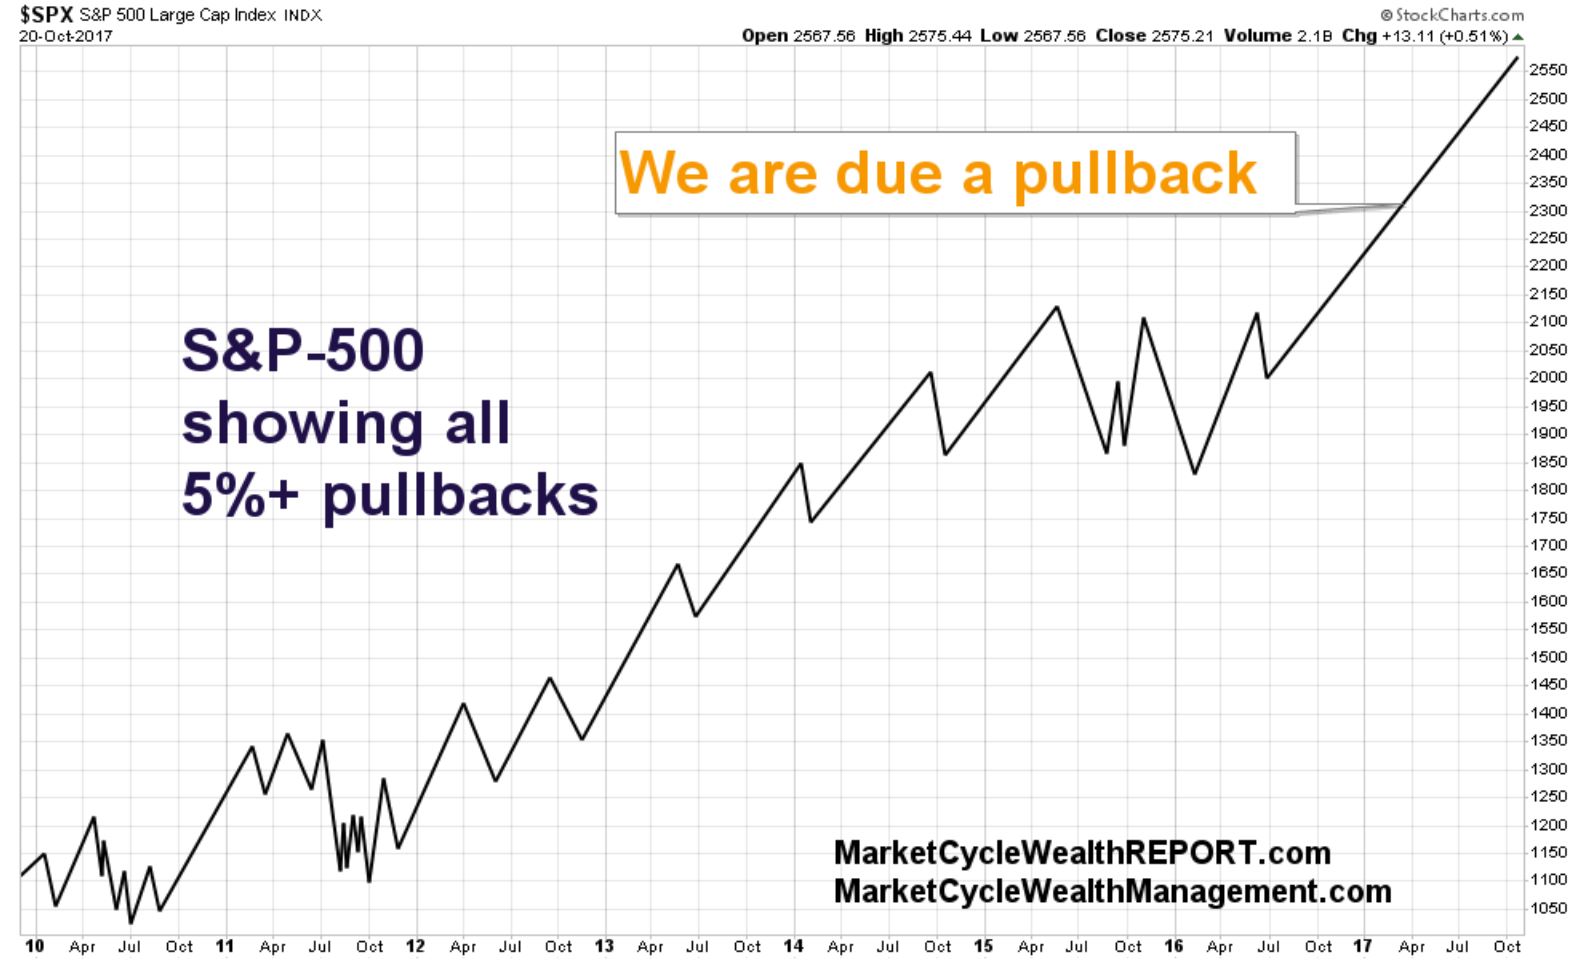
SUMMARY: Ever since April 2, 2009, two weeks from the bottom of the financial crash, MarketCycle has been saying that we’re in a cyclical bull market. We’ve been correct. Since October 1, 2011, we’ve been saying that we are ALSO in a secular bull market (making this cyclical bull even more powerful). We’ve been correct. We’re now saying that it looks as if market risk is reducing again. On 10/06/2017 MarketCycle cut its protective asset holding in half while still keeping its strong stock allocation, so as of today’s publication on 10/25/2017, we should do as well as the S&P-500 as it gains, but if the S&P falls instead, we should lose less than ½ as much, so risk is still skewed in our favor. Further, there is evidence that we just entered the early part of the “euphoric” period which only further strengthens the bull market. Excited buyers move the stock market ever higher even if earnings and Central Bank accommodation were to move the wrong way. The S&P-500 is currently near 2550 and it is slowly being pulled toward 3000 and perhaps beyond. But a pullback first?
Any near-term pullback is now more likely to be fairly shallow (5%?) and rapid and “V” shaped and over almost as soon as it begins; it would likely be difficult to buy back in at the bottom since so many traders are waiting in line to put absent money to work. It is possible that there are a series of 3% pullbacks rather than one larger one; this is called volatility and it has been (unusually) missing in action for the past year. Actual recession chances in the U.S. one month out is calculated at 0.5%, which is ridiculously low.
Sometimes the strength of this final stage lasts longer than one would think possible simply by being pushed up and held high by euphoric stock market bulls.
Thank you for reading!
Clients should always log into their accounts using the icon on the website.
Our other “members only” REPORT website can be visited via the icon on the website.
Please share via the Facebook icon below (next to the print function).
This monthly blog is free (and with no spam) via the signup on this website.
MarketCycle Wealth Management[Published on October 2, 2017… abbreviated on October 8, 2017… PORTFOLIO performance is shown below.]
RISK levels are still higher than average despite the fact that it is generally not recognized as such; market internals are still showing some weakness, although this improved during the last week of September. Higher risk levels may eventually reduce without a correction but the odds are still higher that a 5% pullback will occur before the end of the year.
Market RISK has nothing to do with news or mass killings in Las Vegas or politics or war or even with “world leaders” calling each other childish names like “Dotard” or “Little Rocket Man.” Risk has to do with either the economy or corporations losing their tailwinds, for various reasons, or from market internals weakening in response to an over-heated market needing to let off a little steam. This steam release can come in either the form of a rapid but temporary downward market correction or by a more prolonged sideways malaise… or by slow and gradual upward gains which keep grinding higher (which is what has been happening over the past couple of months).
The market has now gone over 15 months without a normal and routine 5% correction. This is very close to record territory since this is only the fourth time, in the entire history of the universe, that the stock market has gone this long without a 5% correction. Although some professionals will disagree with me on this, in my opinion this is also not a good thing. Most people are prone toward Recency Bias where they believe that what has been happening recently will continue to happen as a sort of “new normal.” But everything moves through a cycle. Markets move through a market cycle despite any temporary glitches in the pattern. So, no pullbacks during the past 15 months? This chart shows the normal zig-zagging pattern of a bull market with its normal pullbacks:
However, the S&P-500 is not too high above its 200 day-moving-average (IE, not above 8%) so the “bigger drop” may not be too severe. This means that the S&P-500 is more likely to eventually temporarily correct by 5% than it is to drop 20%. This chart shows how high or low the S&P-500 is relative to its 200 day-moving-average (percentage shown on far right = currently 5.6% above the 200). Since financial assets love their 200 day-moving-average, if they get too far above or below it, like the proverbial Prodigal Son, they rush back home to it (which is why Bitcoin will eventually crash!):
As I keep saying, we are still in a cyclical stock bull market within the confines of a Secular Bull Market. This is what the stock market looks like off of the 2009 bottom; it is still within the walls of its rising trend channel and the late stage’s final euphoric blow-off should send it higher at a more rapid rate:
AND stocks are still above their short-term rising trendline off of the more recent 2016 bottom. Chart shown since Trump’s Electoral-College win:
The bond market is also still in an extreme long-term bull market that started in the early 1980s. When this gigantic bubble eventually unwinds, this will cause the U.S. stock market to keep moving through its Secular Bull Market (that started in October of 2011) as the money flows toward stocks (over the next dozen years or more). It will also drive the value of the U.S. Dollar quite high. On this chart, the S&P-500 is shown in green and bonds are shown in red/green. Notice that both can move up together, however, whenever stocks fall hard, bonds ALWAYS move higher, protecting any stock losses. Hedging with Treasury-bonds will be more difficult in the future (as the Secular Cycle progresses) and investment managers will need to know what they are doing.
AND this: President Trump’s tax proposal, despite what the White House is saying to reporters, will drop taxes on the richest, increase them on the poorest and, after taking in the effects of eliminating the ability to write off state, local and property taxes, will ultimately increase taxes on the middle class (this last effect is not shown on this next chart). The proposed elimination of the Alternative Minimum Tax (AMT) would also help the richest Americans. For instance, for Trump’s 2005 taxes, the only tax return which the public has seen (two pages were leaked) it shows that the elimination of the AMT would have saved Trump $31.5-Million in that year alone… but in public, he wrongly states that his taxes would go up under the new plan and they obviously wouldn’t. The White House believes that the resultant increased government deficit level will be paid for via increased growth in the economy (the “Trickle Down Theory”) however, this is unlikely to happen, especially with the coming increases to the military expenditures and the apparent inability to eliminate the rampant fraud in the area of welfare. The government deficit is likely to grow by additional $-Trillions but we may not have to “pay the piper” for another dozen years:
SUMMARY: Near-term = potential higher risk of a 5% pullback; we’ve gone too long without one. Long-term = continued cyclical bull market in stocks with a likely eurhoric bullish period before the market finally tops. Near-term recession chances are less than 2% two months out, which is ridiculously low.
PORTFOLIO PERFORMANCE 2017 year to date (all three shown without a management fee):
- MarketCycle
- Buy & Hold Index (roughly 66% stocks and 33% bonds)
- Hedge Fund Performance Index
Remember that MarketCycle Wealth Management is in the business of managing your investment account using proprietary, lower-risk, advanced techniques. The low fee is a tax write-off and the first 3 months are at no charge.
Cartoon below!
Please share via the FACEBOOK icon below.
You can SUBSCRIBE to this free (no spam) monthly blog via the website.
Visit our (daily) member site via the website’s link: “Visit MarketCycle Wealth REPORT”
Article by Stephen Aust, MarketCycle Wealth Management


