The Consumer Discretionary SPDR Fund (XLY) is down around 30% YTD, the most by any sector this year. The XLY tends to underperform the market in times of economic downturn, as consumers cut excess spending into discretionary goods. Generally, when consumer sentiment declines, consumption decreases, and savings increase as consumers postpone large purchases.
The Option Demand For The Consumer Discretionary ETF
Leveraging OptionMetric’s Signed Volume product, we observed a shift in the option demand for this sector ETF from investors. IvyDB Signed Volume assigns trades as either buyer-initiated or seller-initiated based on the trade price and the bid-ask quote at the time of the trade. Trades that occur at the bid price are classified as sells, and trades at the ask price are buys.
Q2 2022 hedge fund letters, conferences and more
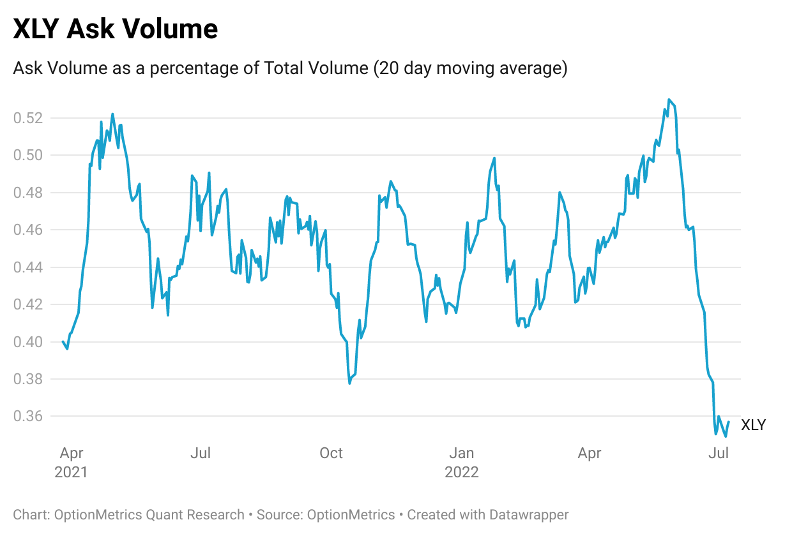
The graph below shows the percentage of transactions executed at the ask price (buys) as a percentage of total volume. Since May of this year, XLY has experienced a massive decrease in buying pressure, from 52% ask volume all the way to 36%.
When compared to the ask volume of other sectors (as shown in the table), XLY is one of the more volatile ETFs, as daily option volume is less than other sector funds.
Therefore, this drop in ask volume percentage could be chalked up as noise, however this drop is too significant to overlook.
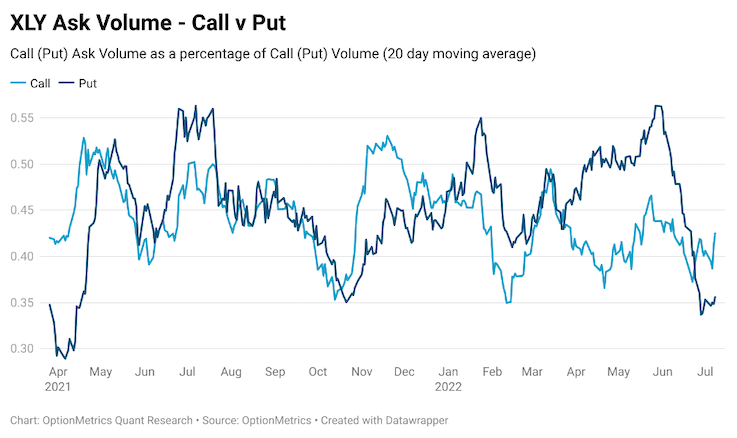
Since ask volume can consist of both call and put options, the next logical step would be to break up the volume between calls and puts to determine which one is contributing to this sharp drop.
Graph 2 indicates that the drop is a result of a decrease in put purchases (dark blue), as buying pressure for call options (light blue) remains fairly steady. Put ask volume dropped from 55% to 35% of total volume in the past couple months.
Consumer Discretionary stocks underperform the market during economic unrest; thus, investors have taken advantage of this with an increasing amount of put purchases. From November 2021 to May 2022, the number of put purchases increased from 35% to 50%. This was accompanied by a 35% drop in the XLY.
However, over the past couple of months, the decrease in put purchases below November 2021 levels can be seen as a bullish indicator, as traders are no longer betting against this sector. Why have they stopped buying puts so abruptly? One possibility is that the price of puts is overly expensive.
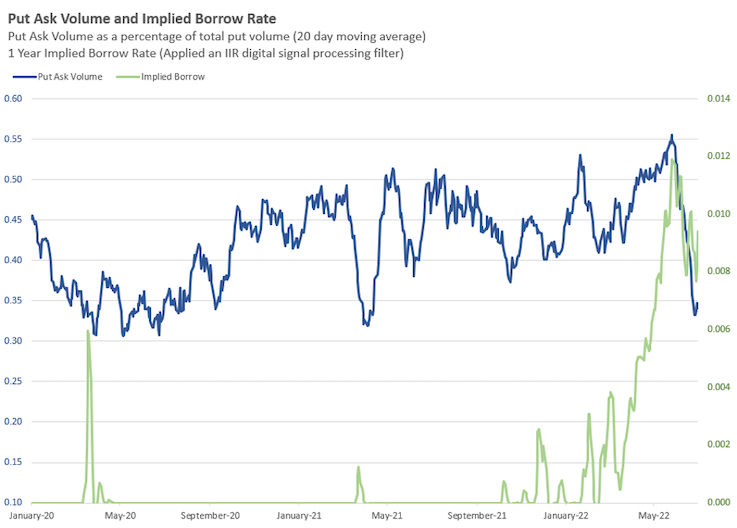
An important factor that determines put premiums is the borrow rate. This is a fee charged to cover the market makers’ costs of lending shares. If the demand to short a particular stock increases, so does the borrow rate. OptionMetrics leverages the put call parity to calculate the implied borrow rate. Graph 3 shows the implied borrow rate of XLY graphed over the ask volume for put options from the previous graph. The implied borrow rate was smoothed using a digital filter to reduce cyclical noise.
Source: OptionMetrics
Spikes in the implied borrow rate are accompanied by drops in the ask volume, mainly during the start of the pandemic and March 2021. One reason for this is that high borrow rates lead to high put premiums, since puts are an alternative to shorting a stock. High premiums are less attractive to investors, so they stop buying puts. In both instances (March 2020 and March 2021) the XLY hit a bottom, as there was less downward pressure due to the lack of put purchases.
With the same pattern happening over the past couple months, are traders calling another bottom?
Article by Anton Rotach, OptionMetrics
About the Author
Anton Rotach is a Junior Modeling Quant at OptionMetrics. He completed a Bachelor of Science in Quantitative Finance and Master of Science in Financial Analytics from Stevens Institute of Technology.


