Don’t believe all the doom and gloom surrounding the restaurant industry. Despite slowing traffic across the industry, one firm is consistently improving profitability and creating shareholder value. Because the company aligns executive compensation with ROIC, we believe this firm can continue to outperform. Cracker Barrel Old Country Store (CBRL: $157/share) is this week’s Long Idea and also on March’s Most Attractive Stocks Model Portfolio.
Cracker Barrel’s Growing Profits
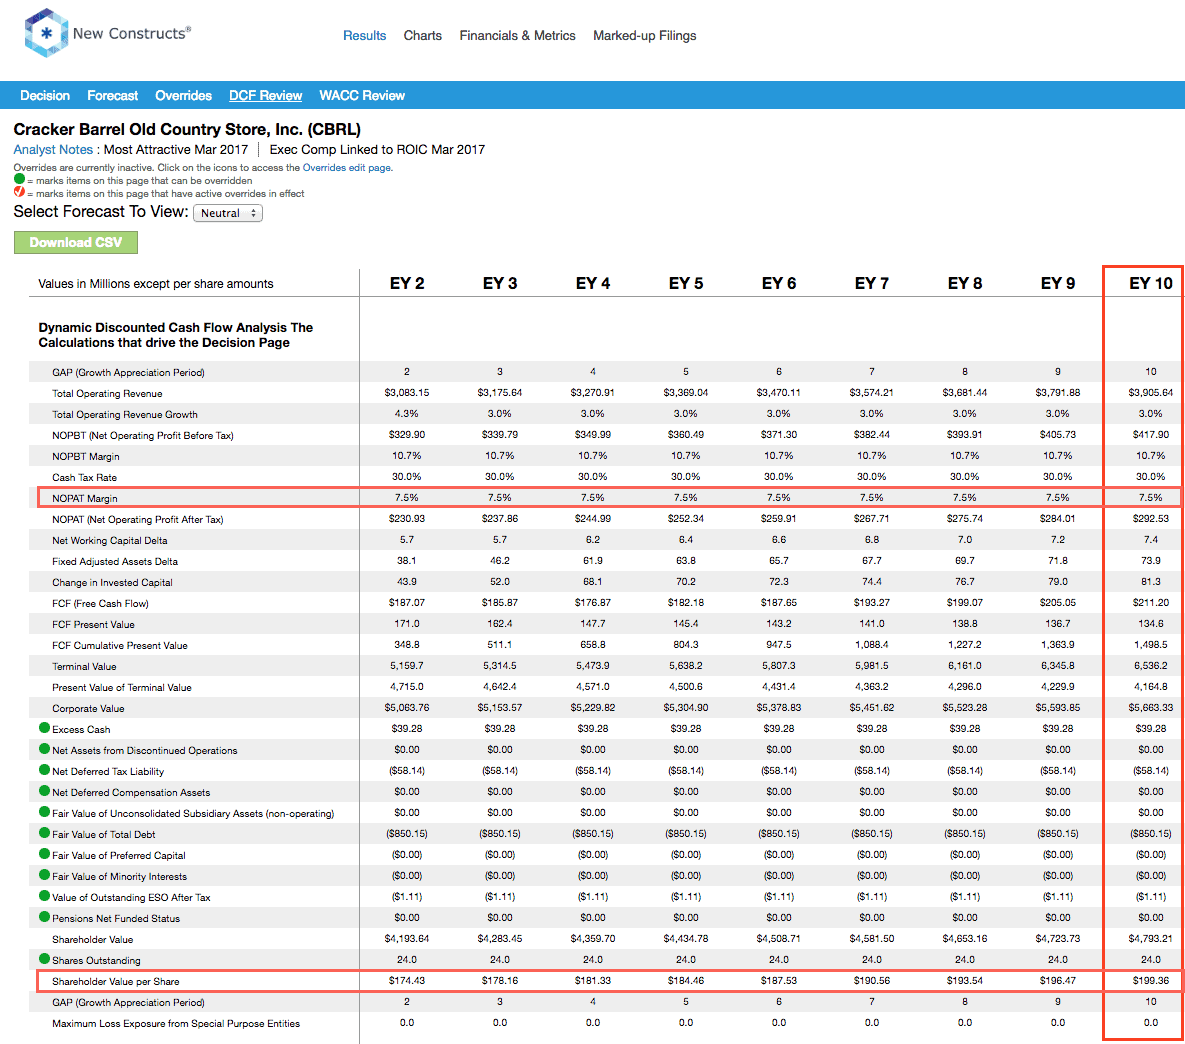
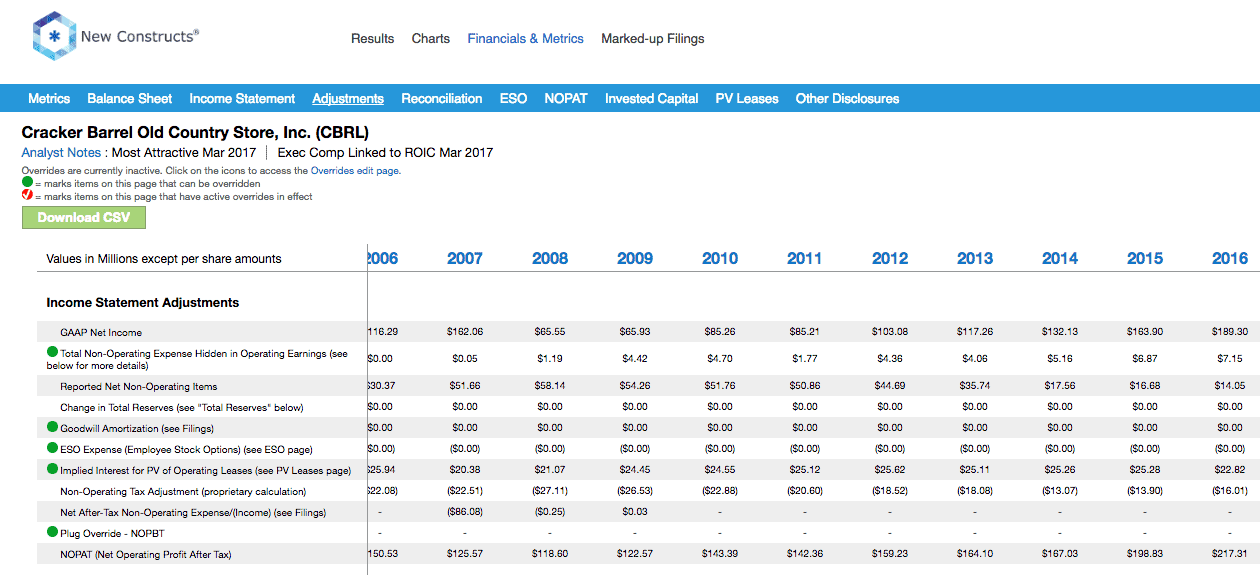
Over the past decade, Cracker Barrel Old Country Store has grown after-tax profit (NOPAT) by 4% compounded annually to $217 million in 2016. NOPAT has increased to $233 million over the last twelve months (TTM). Cracker Barrel’s NOPAT margin has improved from 6% in 2006 to 8% TTM, per Figure 1.
Figure 1: Cracker Barrel’s Profitability Since 2006
Sources: New Constructs, LLC and company filings
In addition to NOPAT growth, Cracker Barrel has generated a cumulative $886 million (23% of market cap) in free cash flow (FCF) over the past five years. Throughout the company’s history it has improved its return on invested capital (ROIC) and currently earns a 14% ROIC. Cracker Barrel’s fundamentals impress across many metrics.
Executive Compensation Plan Is Aligned With Improving ROIC
Cracker Barrel’s executive compensation plan includes base salary, annual bonuses, and long-term stock-based compensation. 50% of long-term stock based compensation is tied to successful achievement of ROIC goals over a two-year performance period. Return on invested capital has been part of CBRL’s executive compensation plan since 2011.
The focus on return on invested capital helps ensure executives continue to be good stewards of capital. Per Figure 2, CBRL’s ROIC has improved from 8% in 2006 to its current 14%. Accordingly, Cracker Barrel has also grown economic earnings from $33 million in 2006 to $145 million in 2016, or 16% compounded annually. Over the last twelve months, economic earnings have increased to $157 million.
Figure 2: Improvements In Cracker Barrel’s ROIC

Sources: New Constructs, LLC and company filings
We know from Figure 3 below that ROIC is directly correlated to changes in shareholder value. CBRL’s use of return on invested capital to measure performance ensures executives’ interests are aligned with shareholders’ interests.
Per Figure 3, ROIC explains 83% of the changes in valuation for the 41 restaurant firms we cover. Despite Cracker Barrel’s 14% ROIC, well above the 9% average of the 41 restaurant firms, the firm’s stock trades at a discount to its peers as shown by its position below the trend line in Figure 3. Given the firm’s consistently high ROIC, profit growth and shareholder-friendly executive compensation incentives, one would think the stock would garner a premium valuation.
Figure 3: ROIC Explains 83% Of Valuation for Restaurant Firms

Sources: New Constructs, LLC and company filings
High Profitability Gives Cracker Barrel A Competitive Advantage
In the highly competitive restaurant and retail industries, margins can be razor thin and price is often a firm’s most effective tool to attract customers. As a result, higher ROICs and margins can translate into competitive advantage. Per Figure 4, Cracker Barrel has the highest ROIC and one of the top margins versus peers, which include Denny’s Corporation (DENN), Darden Restaurant’s (DRI) Olive Garden and Longhorn Steakhouse, Red Robin (RRGB), Ruby Tuesday’s (RUBY), and Brinker International’s (EAT) Chili’s Bar and Grill, among others.
High margins allow Cracker Barrel to cut prices and still remain profitable. At the same time, higher margins allow Cracker Barrel to better withstand labor price pressures as minimum wages rise across the country. Less profitable firms face higher margin pressure in this environment and have less operational flexibility and resources to support growth.
Figure 4: Cracker Barrel’s Impressive Profitability

Sources: New Constructs, LLC and company filings.
Bear Concerns Assume Restaurant Industry Is Failing
For years pundits have anointed fast casual restaurants as fast food and casual dining’s biggest competitor and the cause behind poor traffic in traditional restaurants. CBRL bears will tout the growth and success of fast casual dining along with rising labor costs in an effort to discount Cracker Barrel’s future potential. However, the bear case ignores Cracker Barrel’s resilient business model throughout the rise of fast casual and the firm’s prudent cost management.
2016 was reportedly a “bad year” for restaurants, as store traffic was down industry wide and for Cracker Barrel. Unlike the rest of the industry, however, Cracker Barrel has continued to grow sales in this challenging environment. In fact, same store restaurant sales have risen for 11 consecutive quarters. Restaurant sales comprised 80% of revenue in 2016. Same store retail sales, the remaining 20% of revenues, have increased in nine of the past 11 quarters. These sale increases come on the back of rising average check prices, which have grown for 11 consecutive quarters as well. While fewer customers are visiting Cracker Barrel, they’re spending more each time they enter the store.
While sales growth is important, profit growth remains most important to creating shareholder value. Through effective cost management, such as annual cost reduction efforts and process enhancements, Cracker Barrel has consistently improved its profit margins, as noted above. Other firms in the industry, such as prior Danger Zone pick, Zoe’s Kitchen (ZOES), blamed rising wages for slimming margins. ZOES is down 30% while the S&P is up nearly 10% since our report.
Per Figure 5, though, Cracker Barrel’s labor expenses, cost of goods sold, and general and administrative costs have all fallen as a percent of revenue since 2011. Most impressive is Cracker Barrel’s ability to manage labor costs while average hourly earnings in the food services industry are rising. From 2011 to 2016, average hourly earnings rose from $10.74 to $12.75, per the Bureau of Labor Statistics. Meanwhile, CBRL’s labor costs fell from 37% of revenue to 35% of revenue over the same time. Effective cost management enables Cracker Barrel to prosper while other firms fail.
Figure 5: Cracker Barrel’s Prudent Cost Management

Sources: New Constructs, LLC and company filings.
Cracker Barrel’s valuation also undermines the bear arguments. Despite rising sales, margins, and profits, CBRL’s current valuation implies permanent profit decline, as we’ll show below.
Valuation Implies Significant Drop In Profits
CBRL is down 6% year-to-date while the S&P is up 5%, and shares are undervalued. At its current price of $157/share, CBRL has a price-to-economic book value (PEBV) ratio of 0.9. This ratio means the market expects Cracker Barrel’s NOPAT to permanently decline by 10%. This expectation seems rather pessimistic for a firm that has grown NOPAT by 4% compounded annually for the past decade.
If Cracker Barrel can maintain 2016 NOPAT margins of 8% and grow NOPAT by 3% compounded annually for the next decade, the stock is worth $199/share today – a 28% upside. This scenario assumes CBRL can grow revenue by consensus estimates in 2017 (1.5%) and 2018 (4.3%), and 3% each year thereafter. Given the company’s ability to grow sales & profits amidst falling traffic, CBRL could easily meet or even surpass these expectations simply by finding new ways to attract customers into their restaurants. Add in the 2.9% dividend yield and its clear why CBRL is on this month’s Most Attractive Stocks Model Portfolio and could be an excellent portfolio addition.
Buy Back Plus Dividend Could Yield Over 3%
In 2016, Cracker Barrel repurchased nearly $15 million worth of stock. As of 2Q17 the company has $25 million remaining under its current authorization but has not repurchased any stock through the first six months of the company’s fiscal 2017. If Cracker Barrel were to keep its repurchase activity consistent with 2016, the remaining authorization will last just under two years, and the firm would repurchase a total of $15 million per year. A repurchase of this size is 0.4% of the current market cap. When combined, Cracker Barrel’s 0.4% repurchase yield and 2.9% dividend yield offer investors a total potential yield of 3.3%
CBRL’s Geographic Mix Could Lead to Outperformance
National Restaurant Association projects restaurant sales, across the nation, to grow 4.3% in 2017. 60% of Cracker Barrel’s stores are in regions where the National Research Association estimates sales growth to be at or above average: the South Atlantic, East South Central, and Mountain regions.
Cracker Barrel is well positioned to grow faster than the national average. Add in effective cost management, and CBRL has the potential to beat both top and bottom line expectations.
Beating bottom line expectations has boosted the stock significantly in the past. When Cracker Barrel reported company 1Q17 EPS above consensus, the stock rose 11% over the following three weeks. In 3Q16, when Cracker Barrel also surpassed consensus EPS estimates, the stock rose 12% in the following week.
With new initiatives such as an upcoming billboard campaign aimed at driving traffic, exclusive merchandise in its retail stores, and new product offerings around the holidays, CBRL could be poised for another beat and subsequent increase in valuation.
In the meantime, investors in this stock carry very low valuation risk and are rewarded with a potential 3.3% yield when combining the 2.9% dividend yield with the 0.4% share repurchase yield.
Insider Trends Minimal While Short Interest Shows Market Pessimism
Over the past 12 months, insiders have purchased 95 thousand shares and sold 81 thousand shares for a net effect of 14 thousand insider shares purchased. These purchases represent less than 1% of shares outstanding. Additionally, short interest sits at 4 million shares, or 18% of shares outstanding. It would appear the market is buying into the fear of weak restaurant sales despite Cracker Barrel’s track record of profitability.
Impact of Footnotes Adjustments and Forensic Accounting
Our robo-analyst technology enables us to perform forensic accounting with scale and provide the research needed to fulfill fiduciary duties. In order to derive the true recurring cash flows, an accurate invested capital, and an accurate shareholder value, we made the following adjustments to Cracker Barrel’s 2016 10-K:
Income Statement: we made $60 million of adjustments, with a net effect of removing $28 million in non-operating expense (1% of revenue). We removed $16 million in non-operating income and $44 million in non-operating expenses. You can see all the adjustments made to CBRL’s income statement here.
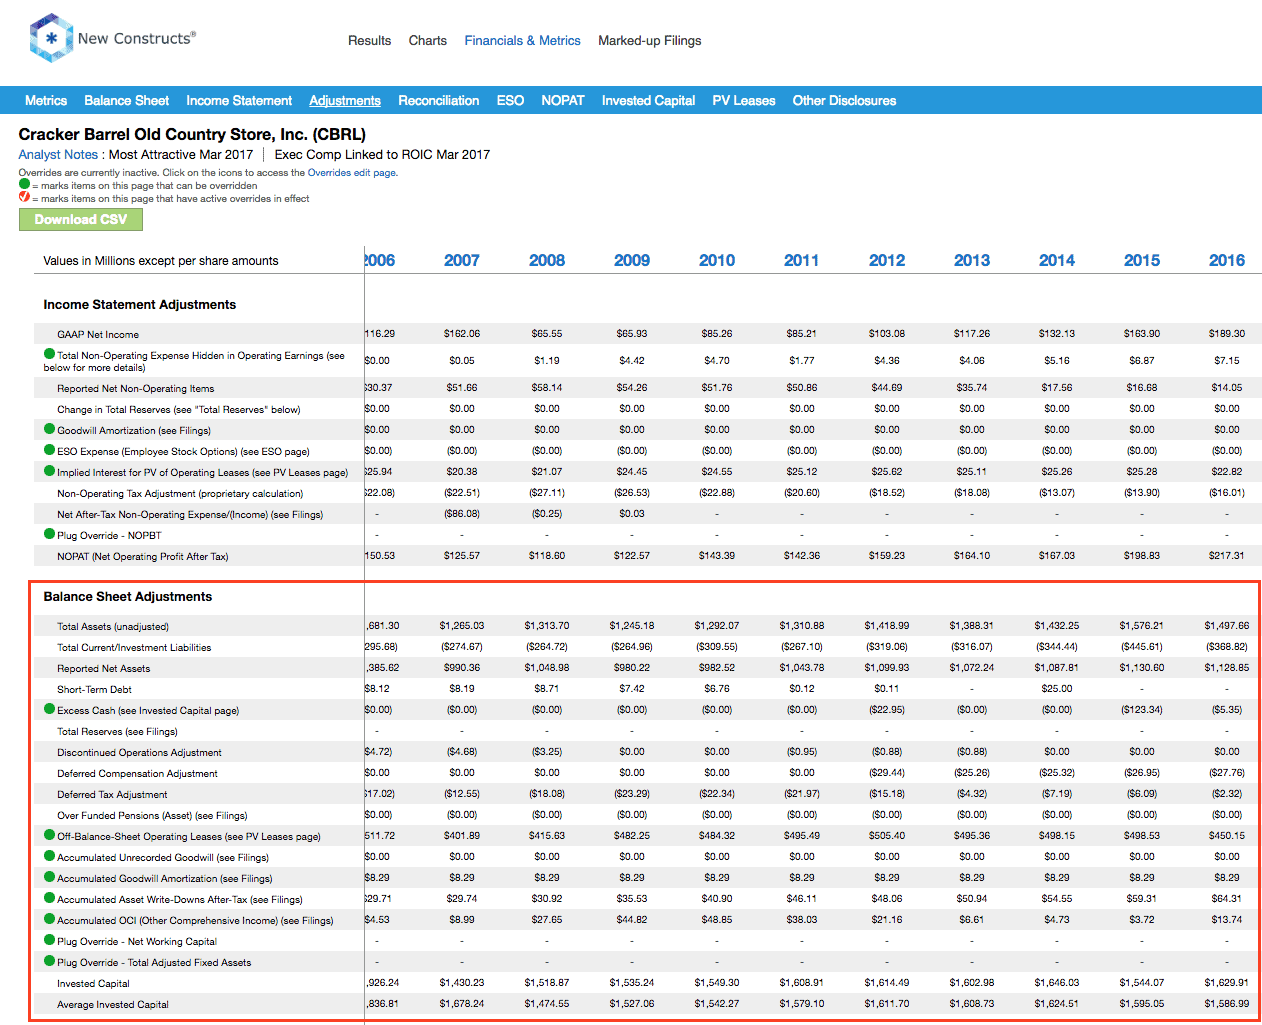
Balance Sheet: we made $614 million of adjustments to calculate invested capital with a net increase of $458 million. The largest adjustment was $450 million due to operating leases. This adjustment represented 40% of reported net assets. You can see all the adjustments made to CBRL’s balance sheet here.
Valuation: we made $948 million of adjustments with a net effect of decreasing shareholder value by $870 million. Apart from total debt, which includes the operating leases noted above, one of the notable adjustments was $39 million in excess cash. This adjustment represents 1% of Cracker Barrel’s market cap. Despite the net decrease in shareholder value, CBRL remains undervalued.
Attractive Funds That Hold CBRL
The following funds receive our Attractive-or-better rating and allocate significantly to Cracker Barrel.
- First Trust RBA Quality Income ETF (QINC) – 2.9% allocation and Attractive rating
- Ivy Mid Cap Income Opportunities Fund (IVOIX) – 2.8% allocation and Attractive rating
- Jensen Quality Value Fund (JNVIX) – 1.4% allocation and Very Attractive rating.
This article originally published on March 29, 2017.
Disclosure: David Trainer and Kyle Guske II receive no compensation to write about any specific stock, style, or theme.
Article by Kyle Guske II, New Constructs


