
Comparing U.S. Federal Spending with Revenue
In 2021, the U.S. government spent $6.8 trillion on various expenditures and government-aided programs. Where was this money spent, and how much was covered by taxpayers’ dollars?
This graphic by Truman Du shows a breakdown of U.S. federal spending in 2021, as well as a breakdown of where the money came from, using data from USAspending.gov.
Q2 2022 hedge fund letters, conferences and more
Money Comes and Goes
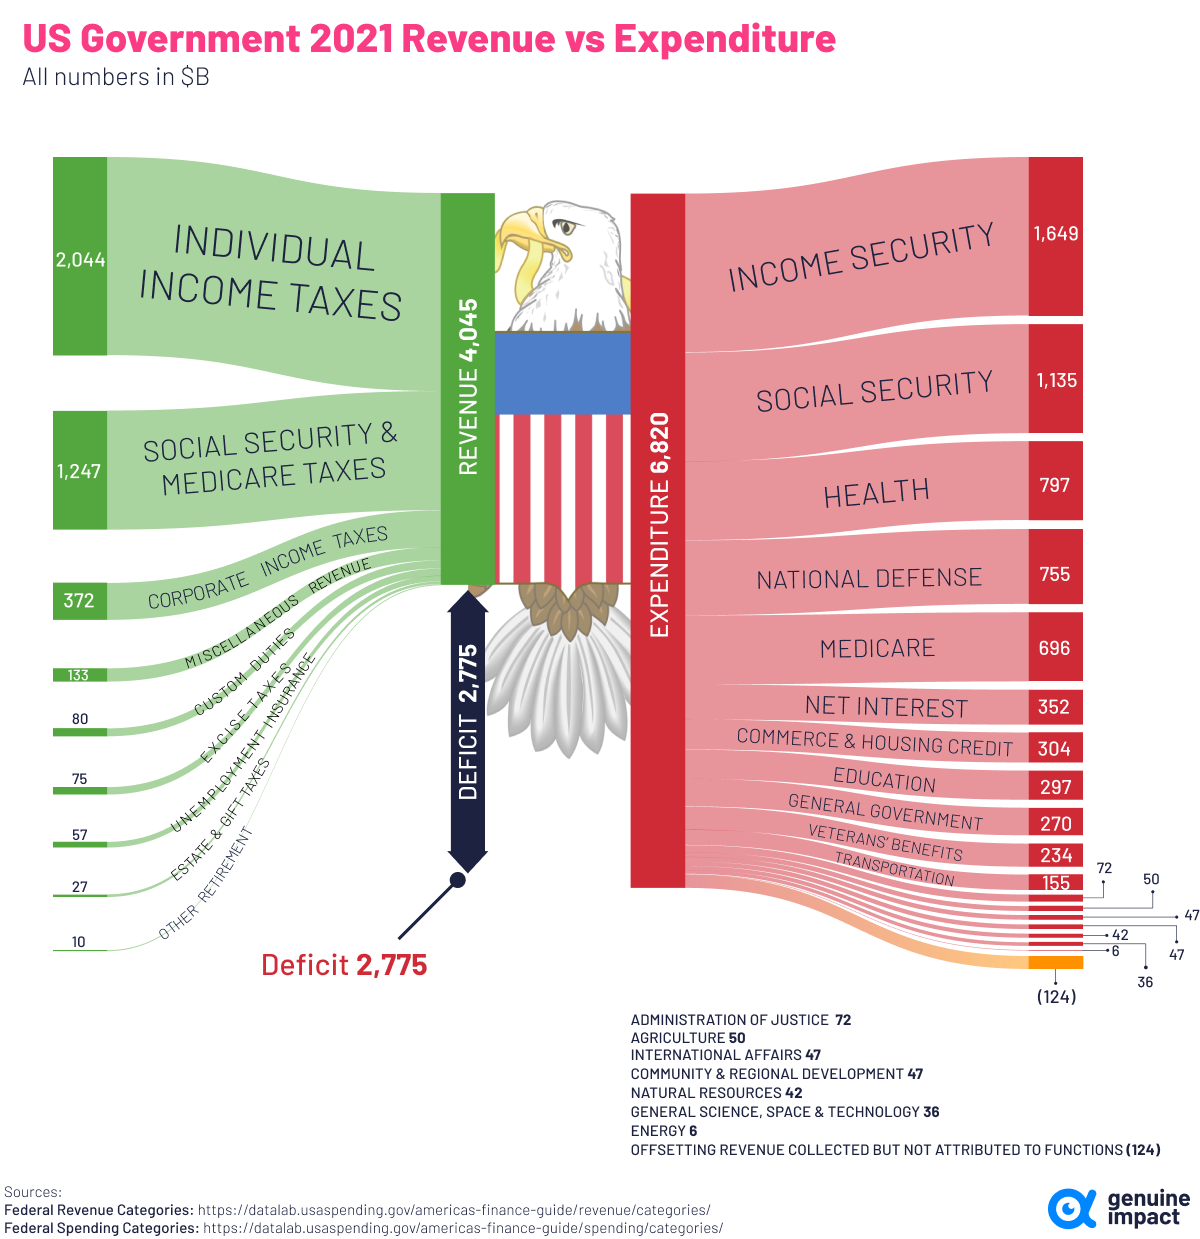
In 2021, U.S. government revenue totaled more than $4 trillion. About half of it came from individual income taxes, while about 30% came from Social Security and Medicare taxes.
Here’s a full breakdown of revenue sources in 2021:
| U.S. Government Revenue Source | 2021 Amount ($B) |
| Individual income taxes | $2,044 |
| Social security and medicare taxes | $1,247 |
| Corporate income taxes | $372 |
| Miscellaneous revenue | $133 |
| Custom duties | $80 |
| Excise taxes | $75 |
| Unemployment insurance | $57 |
| Estate and gift taxes | $27 |
| Other retirement | $10 |
| Total | $4,045 |
Despite the trillions in revenue generated, like most years, U.S. federal spending was higher in 2021, which put the federal government in a budget deficit of $2.7 trillion.
This was the second highest deficit on record, down from a peak of $3.1 trillion in 2020 during the height of the global pandemic.
After income and Social Security spending, health was the third-largest expenditure in 2021. Here’s a look at the full breakdown, and where spending was allocated last year:
| U.S. Government Spending Category | 2021 Amount ($B) |
| Income security | $1,649 |
| Social security | $1,135 |
| Health | $797 |
| National defense | $755 |
| Medicare | $697 |
| Net interest | $352 |
| Commerce and housing credit | $304 |
| Education | $297 |
| General government | $270 |
| Veterans benefits | $234 |
| Total | $6,820 |
PreviousNext
Spending is expected to curb further in 2022. According to the non-partisan Congressional Budget Office via AP News, the 2022 deficit is projected to drop to $1.15 trillion and will continue to decrease for the next three years.
U.S. National Debt
In March 2021, U.S. national debt reached an all-time high of $28 trillion. That includes intragovernmental holdings, which is about $6 trillion of debt owed within the government itself.
While overall debt is rising, the cost of servicing this debt has actually dropped in recent years thanks to record low interest rates.
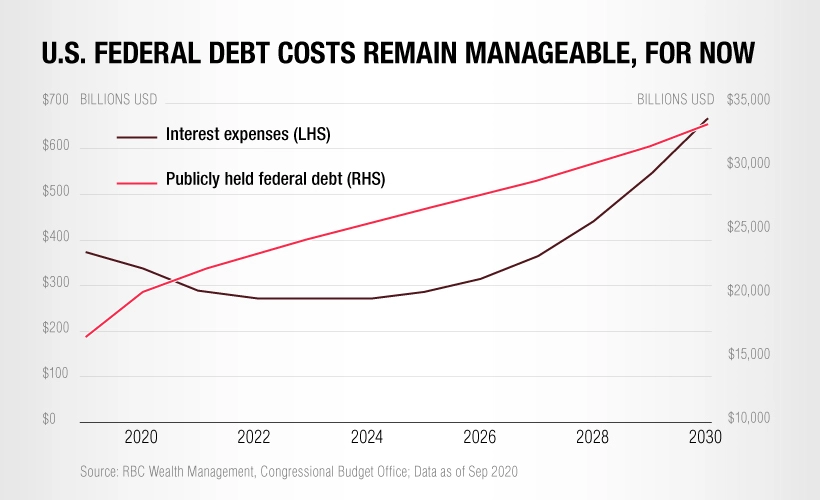
However, with interest rates on the rise again this year, servicing the existing national debt is becoming more expensive.
And eventually, when it comes time for the U.S. government to refinance its loans, a greater portion of the federal budget will need to be allocated to servicing debt, which will put a squeeze on other areas of spending.
Article by Truman Du, Visual Capitalist


