
Active investment managers made a comeback in 2017 when around half of actively managed US mutual funds managed to beat their benchmark for the year.
It looks as if actively managed mutual funds are on track to beat this performance for 2017 according to Bank of America’s latest US mutual fund performance update.
For the month to January 31, 69% of mutual funds reportedly beat their benchmarks with the average fund outperforming by 53 basis points. This is the highest monthly hit rate in 6 years and the second highest hit rate in Bank of America’s data going back to 2009. What’s more, active funds managed to achieve this performance in what was the best month for equities since March 2016.

69% Of Active investment managers Outperform In January
On the whole, two sectors accounted for the bulk of active funds’ returns. Overweight positioning in tech and discretionary certainly helped as these two sectors were the market’s best performing for January. Meanwhile, active managers’ most underweight sectors, which just happened to be staples, telecom, real estate and utilities were the markets worst performing sectors as rising rates pressured high dividend yields and sparked an investor sell-off.
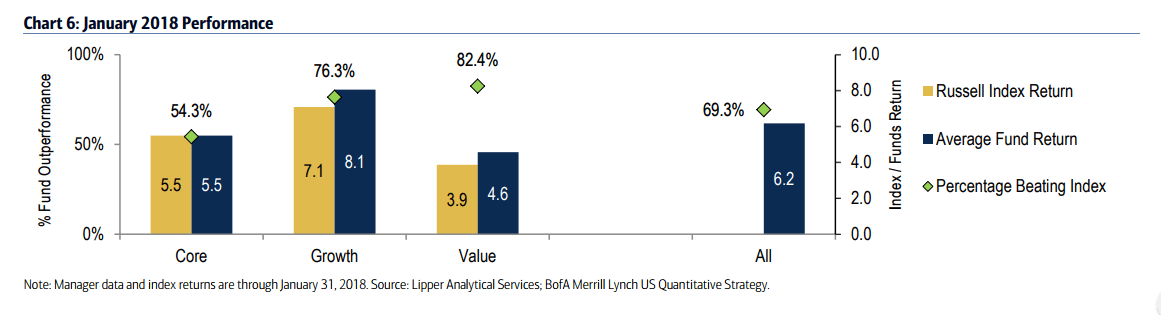
Investors in value funds fared even better than growth investors during January. 76% of growth managers outperform during January according to Bank of America with an average return of 8.1% compared to 7.1% for the Russell 1000 Growth Index -- the highest hit rate in more than two years and the most robust relative performance since 2012.
However, value funds did even better with 82% outperforming during January and averaging an 80% hit rate for the last 12 months, that's compared to just 44% for growth managers. Interestingly, in the small-cap space, the opposite was true. The average hit rate for small-cap managers during January was 55% with growth managers achieving a hit rate of 64% and value managers hitting 53%.
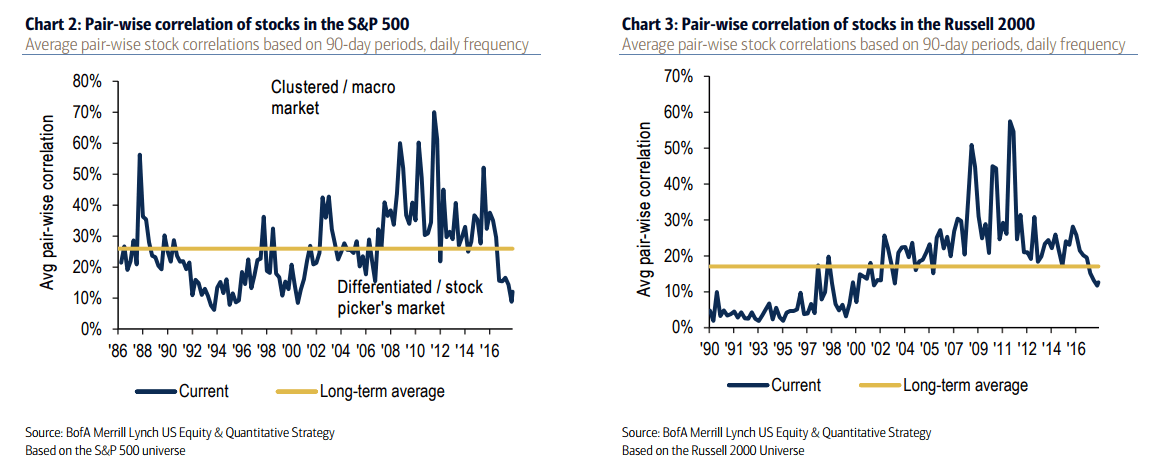
Stock pickers have been having a better time of it recently because pairwise correlation of stocks in the S&P 500 have dropped to lows not seen since the turn of the century. The average pairwise correlation of stocks in the S&P 500 has fallen to a low of around 10%, compared to a high of nearly 70% printed in 2012 and a long-term average of approximately 25%. The average pairwise correlation of stocks in the Russell 2000 has dropped to around 15%, below its long-term average of just under 20%.
.............
2017 was one of the best years for active investment managers since the financial crisis according to a report from Bank of America.
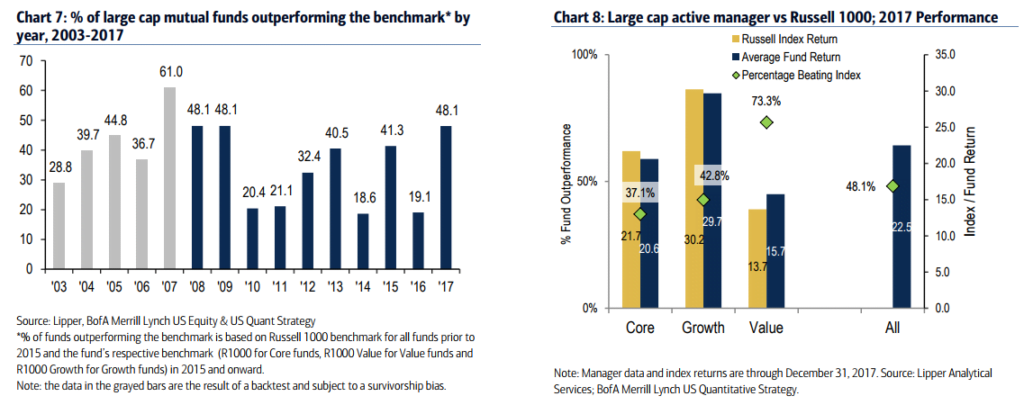
According to BoA's findings, during 2017, 48% of active managers outperformed their benchmarks thanks to the favorable stock picking environment. This is the highest percentage of outperformers in eight years and is up significantly from the only 19% who outperformed in 2016.
The last time such a large percentage of active managers outperformed their benchmarks was in 2008 and 2009. In both years, 48% of the group outperformed.

Active Investment Managers: Well Positioned
Active managers benefitted from several favorable tailwinds last year, which helped them beat the market according to BoA's findings.
Key to the outperformance was an overweight position in Tech. Large-cap funds hit record overweights in Tech several times last year, and Tech overtook Discretionary as the most crowded sector. Tech went on to be the S&P 500's best performing sector for the year accounting for 38% of the index's gain for the year. Fund managers also increased their bias towards higher Growth stocks, with holdings’ average long-term growth rates at 14% vs. 12% for the S&P 500 index. 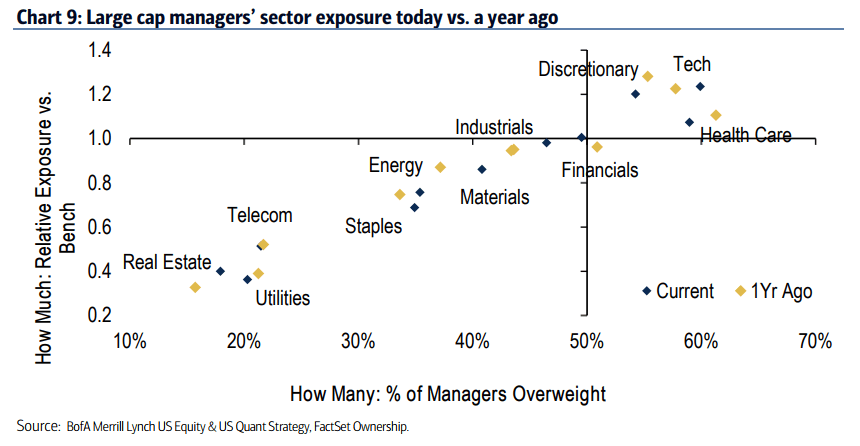
As well as correct positioning, active investment managers also benefitted from low correlations. According to BoA's figures, average pair-wise correlations of stocks in the S&P 500 is currently at the lowest level since 1994. That being said, dispersion in returns for large caps remains below its long-term average and leaves less room for alpha. Interestingly, in contrast to the last several years, crowded stocks by active funds outperformed neglected stocks by active funds last year (+3% vs. -10%).
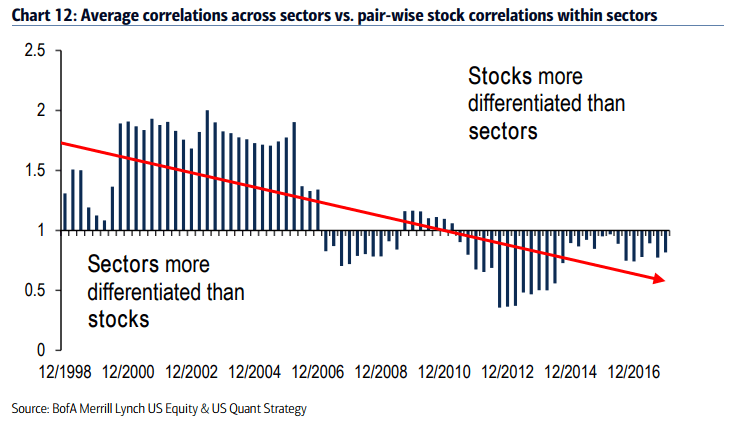
In fact, as it turns out, for stock pickers it was more important to pick sectors rather than stocks throughout the year, a trend that's been emerging for the past decade. As BoA notes:
"Average correlations across sectors have historically been higher than the pair-wise stock correlations within sectors. But possibly driven by sector ETF trading, this trend has reversed over time, and today, picking the right sectors may be more important than the right pair trades within sectors."
Active investment managers had a relatively good (compared to the last five years) year in aggregate, and so did hedge funds. BoA's numbers showed that last year, Hedge Fund Indices returned 7.8%, which is still far below the S&P 500's total return of 21.8% but a marked performance on last year. Equity Long/Short funds were the best performers producing an overall average gain of 12.5%.
Data from hedge fund researcher Eurekahedge shows that for 2017 as a whole, global hedge funds were up 8.24%, while underlying markets as represented by the MSCI World Index returned 17.55% over the same period. Equity long-biased hedge funds were the star performers for 2017 yielding 16.8%, while long volatility and tail risk funds have ended at the bottom of the league tables down 11.0% and 13.9% respectively.
These positive performance figures rekindled investor interest in the industry. Eurekahedge's data shows that the hedge fund industry grew by $188.2 billion in 2017, of which $94.7 billion came from investor allocations and $93.5 billion was performance driven. In 2016, investors pulled an estimated $55.1 billion from the industry.


