Stephen B. Blumenthal
Chairman & CEO
CMG Capital Management Group, Inc.
“We’ve had a lot of QE and we are not sure if it works.”
– Former Dallas Fed President, Richard Fisher (Source)
One of the best reads for me this week came from the creative pen of Danielle DiMartino Booth. She was an analyst at the Dallas Federal Reserve for Richard Fisher and, boy, do I admire her wit and moxie.
In what may be one of my all-time favorite reads, Danielle titled the piece The Bond Market: Beware of Junkyard Dogs. Danielle brilliantly connects singer-songwriter Jim Croce’s passion for junkyards and his love for cars to the sad fundamental state of the high yield junk bond market. Croce’s junkyard obsession lead to his hit song “Bad Bad Leroy Brown.” Do you remember it?
Well the South side of Chicago
Is the baddest part of town
And if you go down there
You better just beware
Of a man named Leroy Brown
And it’s bad, bad Leroy Brown
The baddest man in the whole damned town
Badder than old King Kong
And meaner than a junkyard dog
Well, being that I’m a high yield junk bond guy, Danielle’s piece caught my attention. Maybe because I’m in Chicago this week, maybe because my dad was a big Jim Croce fan (I can just picture the vinyl album cover), maybe because Croce strolled a number of Philadelphia junkyards, but mostly because of the following chart courtesy of the St. Louis Fed.

The chart tracks the delinquency rate on commercial and industrial loans from all commercial banks on a percent change from the prior year (blue line). It then compares that change to Bank of America/Merrill Lynch US High Yield spread (red line). The spread is simply the current yield minus the comparable yield for a safe investment, like U.S. Treasurys, that has a similar maturity. If the average maturity is five years on the ML HY Index, then the spread is that yield less the five-year Treasury yield.
But don’t get hung up on that. What this chart is telling us is that over time, when delinquencies increase, we see an increase in high yield bond yields. Makes sense, as investors flee the risk they sell. More sellers than buyers causes prices to decline and yields to rise. In 2008, as high yield bond prices collapsed, the yield on high yield bonds rose from 6% to over 20%. What a great buying opportunity that presented. I believe another such opportunity is on the horizon.
Ok, back to the chart. Notice how closely the red line (yields) tracks the blue line (bank loan delinquencies). Also, look at the recent separation (far right). What this is showing is that something has to give. Fundamentals are breaking down. If higher quality and highly collateralized bank loans are seeing a spike in delinquencies, can you imagine what might be going on beneath the surface for little collateralized high yield junk bonds? Defaults are going to rise.
From Danielle DiMartino Booth:
As for high yield bond analysts, they aren’t exactly known for catchy turns of phrase. However, in recent weeks, they’ve shed the dry and donned the dramatic, as you’ll soon see. Such is the overheated state of the junk bond market this sweltering summer.
In his latest missive, Deutsche Bank’s Oleg Melentyev, arguably the best-in-class high yield analyst among his sell-side peers, warned of the perils of investing in this “frenzied market.”
Legendary high yield investor Marty Fridson shares Melentyev’s concerns and has for some time. By his best estimate, high yield was already in “extreme overvaluation” territory on June 30th, defined as being one standard deviation above fair value. Flash forward two weeks, and he calculates that the standard deviation has doubled.
(A quick Statistics 101 refresher: standard deviation tells you how tightly clustered or wide-of-the-center individual components of a given data set are from their mean. Remember the grade bell curve the engineering undergrads blew in business school? When all of the test scores came in on top of each other, the bell curve was super steep; when there was vast divergence, the bell curve was low and wide.)
…In the event your eyes have rolled into the back of your head, listen up! This is important folks, your sweet grandparents could well own junk bonds in their desperate need to generate yield on their atrophying retirement funds!
With that preamble posited, on July 15th the option-adjusted spread on Bank of America Merrill Lynch’s High Yield Index was 542 basis points. That compares to 621 bps on June 30th. The lower the spread, the less extra compensation investors are demanding for taking on the added risk of being exposed to, well, junky bonds.
Of the compression in spreads, an incredulous Fridson could only characterize the overvaluation which begat more overvaluation as, “more staggering.”
I’ve been tactically trading high yield bonds since 1991. It is a trend following trading strategy — disciplined and rules based. Trade into high yield funds on uptrends, move to short-term Treasury bills on downtrends.
In a few hours, I will present at a large advisor conference. I’m going to try to do my best to explain what is going on and what it means for their clients’ portfolios. For example, let’s say that your client has 15% allocated to high yields. If defaults rise, as I suspect, the collateral and promises from the borrower to pay the bond loan back offer the investor little chance of recovery. I expect a 50% price decline during the next recession. That is good news, not bad – unless one is caught on the wrong side of the trade.
If you have 15% of your money in high yield bonds, expect a 7.5% hit to your overall portfolio depending on the speed of the decline. Declines of this nature tend to happen quickly (over days and months – not years).
Now, if you are in a trend following trading strategy with an experienced manager or you have the guts and conviction to follow a process, then you are smelling great opportunity here. Sidestepping the vast majority of the decline will enable you to trade back in at much lower prices and much higher yields to maturity.
Interest rates are near record lows with the 10-year Treasury at 1.50%. Bonds offer little support to help drive return in a portfolio. Equity market valuations are ultra-high, signaling low 2% to 4% returns, before inflation, over the coming 10 years. Seventy-five percent of the money will be in the hands of pre-retirees and retirees by 2020 (according to BlackRock research). I don’t believe that investors will be content looking at their account statements when interest rates rise and another major correction kicks their portfolio in the pants. But there are ways to make money should what I expect to unfold occurs.
At dinner last night, one of our advisor clients came up to me and was complimentary but critical of OMR. His comments were helpful to me and, if you are a client, I hope helpful for you. I attempt to answer his question below. If you are not a client, please feel free to skip the section called What OMR Means as it Relates to Our Strategies and Your Clients’ Portfolios.
But do take a look at the interest rate section. You will find a great chart. It details the return and risk (gain vs. loss) that will occur based on the movement in interest rates. Feel free to share with your clients. The Fed wants inflation and higher interest rates. So far they have been unsuccessful in their efforts. The chart quantifies the potential gains and losses. Not perfect but pretty close. I hope you find it helpful.
Grab that coffee and dive in.
? If you are not signed up to receive my weekly On My Radar e-newsletter, you can subscribe here. ?
Included in this week’s On My Radar:
- The Problem with Ultra-low Interest Rates (Profit-Loss Chart)
- Beware of Junkyard Dogs – Danielle DiMartino Booth
- What OMR Means as it Relates to Our Strategies and Your Clients’ Portfolios
- Concluding Thought on the Direction of Interest Rates
- Trade Signals – Investor Sentiment Reflects Extreme Optimism
The Problem with Ultra-low Interest Rates (Profit-Loss Chart)
From the BlackRock Blog:
What gives? If the economy is getting better, why are yields still stuck near all-time lows? A combination of factors are contributing, including:
- Low growth
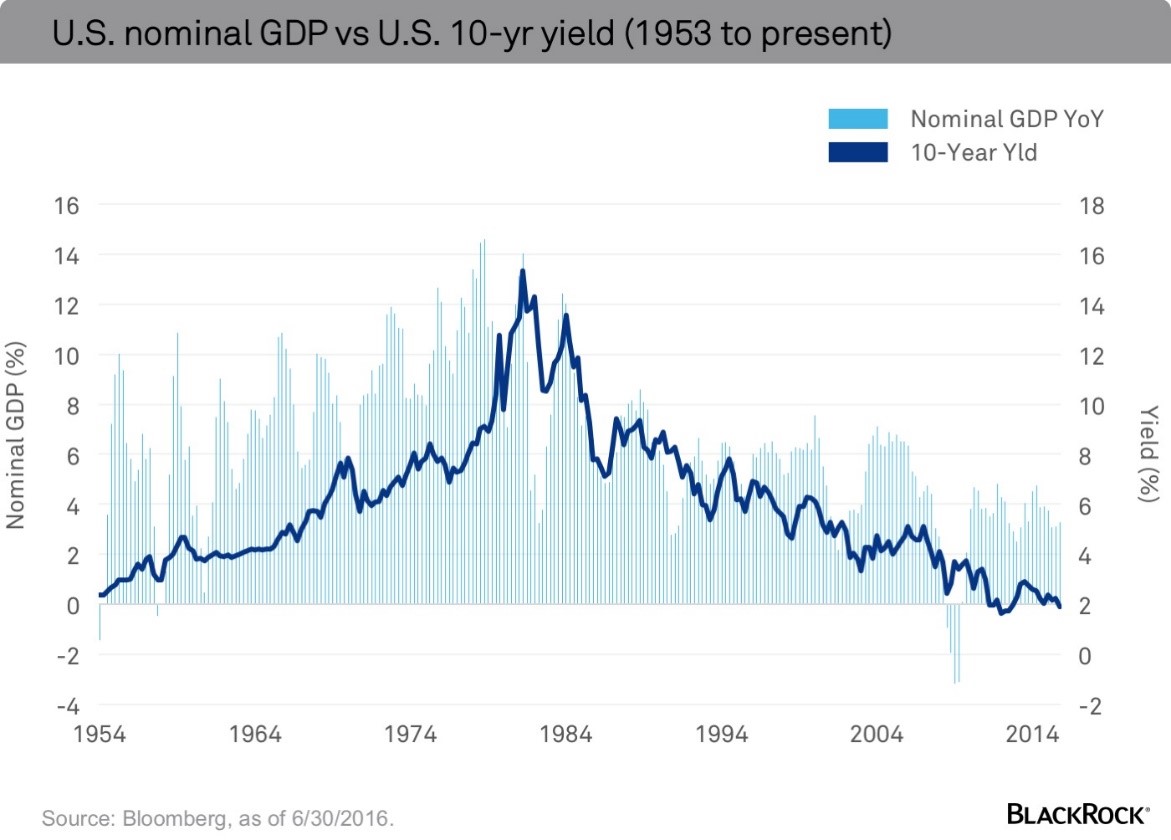
The simplest explanation is that low rates are a function of slow growth and low inflation, or more succinctly low nominal GDP (NGDP). Over the past half-century the level of NGDP has explained roughly 30% of the variation in long-term rates, according to Bloomberg data. If you look at the chart below, NGDP is currently close to 3%, a historical low, suggesting rates should also be low. However, based on current levels one would expect the yield on a 10-year Treasury bond to be around 4.25%. That would still actually be low by historical standards; clearly something other than low growth is impacting rates.
- Federal Reserve policy
Slow growth has led the Federal Reserve (Fed) to engineer and maintain a policy of extraordinarily low short-term rates. While the expansion is already one of the oldest on record, the U.S. central bank has barely started the process of normalizing rates. With U.S. short-term rates still stuck near zero and the Fed’s balance sheet bloated relative to the pre-crisis norm, bond yields are low by design. Still, it should be noted that if the historical relationship between the Fed Funds rate and the 10-year held, interest rates would be closer to 2.75% rather than 1.50%. (Emphasis mine.)
- The rest of the world looks far worse
Neither the level of nominal growth nor Fed policy fully explain today’s bond yields. Instead, part of the answer lies outside of the United States. Over $10 trillion of sovereign debt currently trades with a negative nominal yield, as Bloomberg data shows. In the context of a global bond market, then, U.S. Treasuries appear to be a bargain.
There are other factors at work as well: a dearth of bonds, which is a function of both lower deficits and slower accumulation of credit by households, regulatory changes in the wake of the financial crisis and an aging population. The longer-term nature of these suggests ongoing pressure on yields.
By Russ Koesterich, CFA, Head of Asset Allocation for BlackRock’s Global Allocation Fund. Source: BlackRock, Inc.
This next chart is an updated version of a chart I have shared with you before. It shows what the risk and reward looks like based on movements in interest rates.
Here is how you read it: the orange box shows yield on the 10-year Treasury note at 1.40%. That is where they were on July 11, 2016. The 30-year Treasury bond yield was at 2.25% that same day (bottom half of chart). The red circles and arrow show the percentage loss should rates rise 1% to 2.4% and then another 1% to 3.4% for 10-year Treasury exposure and what similar 1% means to the 30-year Treasury bond investor.
The green circles and arrow show the gains should rates move lower. You can imagine why investors are still buying negative yielding bonds in Germany. They believe they might go even lower (deeper into the negative territory).
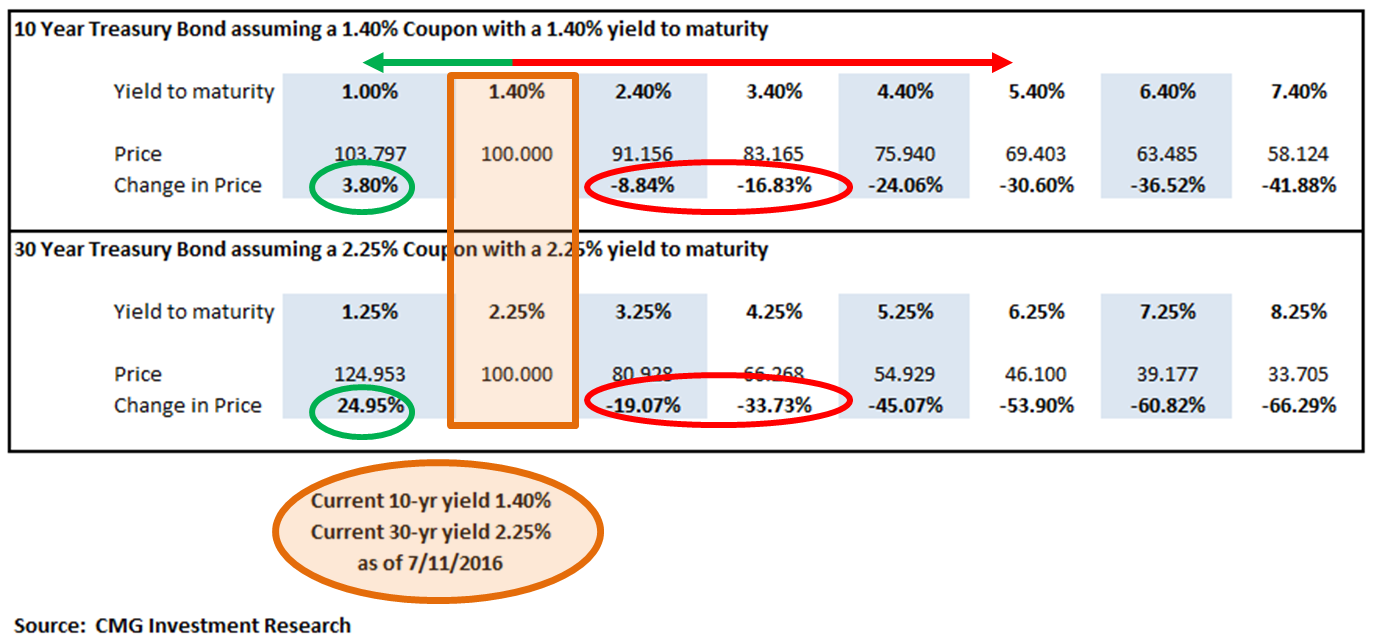
Sign me up for that 24.95% gain in Treasury bonds. That’s the bet. Alternatively, it could go the other way if the Fed wins the creating inflation game. Earning 2.25% is bad enough over 30 years, but earning 2.25% with inflation at or north of 2.25% is a pension manager’s nightmare. And maybe your and my nightmare if we find ourselves on the wrong side of the trade. We have to avoid the losses that will be experienced should the 30-year yield climb to 4.25% or higher.
Koesterich concluded his blog post:
Still, should economic data continue to improve, rates are likely to grind higher. And given the historically high duration on most bond indexes, even a modest rise in rates will impose some unpleasant losses on bond holders. But considering the surreal state of the global bond market, there is probably a limit to how far U.S. rates can rise. This low rate environment will be with us for some time to come.
I’m in the lower-for-longer camp but that fight lines up against an impressive force (global central bankers seeking to create inflation). I’m watching the Zweig Bond Model for clues about the cyclical trend in rates. The greatest bubble of all bubbles is in the bond market – stay tactical and unconstrained with your fixed income exposure.
The latest inflation data shows a year-over-year rate of inflation at 1%. Let’s keep a close watch.
The Bond Market: Beware of Junkyard Dogs, by Danielle DiMartino Booth
I’m a “cut to the chase” kind of guy. My head clicks, doesn’t matter, doesn’t matter, matters! I think I can thank my mama for that trait, though I’m well aware how my impatience pains my staff. I know — more therapy (for me not them).
With that thought in mind, I encourage you to read Danielle’s outstanding piece. You can find the link here. Following are some important (these “matter”) bullet points:
- “In his latest note to clients, (Deutsche Bank’s Oleg Melentyev) ratchets up his expectations for HY (high yield) defaults to rise this year beyond his worst case initial scenario – and it ain’t just an energy story.
- At this point, we have little doubt that our original forecast of a 4% ex-commodity HY default rate will be met by late 2016/early 2017.
- Moreover, we think there are now enough reasons to believe that defaults could rise to 5%, ex-commodities, sometime over the next year or so.
- Coupled with our 20% commodity HY default rate forecast, we are looking at 7.25% aggregate default rate sometime around mid-2017.”
In the event you’ve fallen off Planet Earth in recent weeks, the global corporate default count, as in companies reneging on their promises to make good on those coupon payments, is at the highest level since 2009. And if your memory’s eye has erased 2009 to prevent permanent scarring, the economy was in a full meltdown state back then.
- Let’s get this straight. Defaults are going through the roof and investors are flocking to the sector in record numbers? And how.
- Moody’s Tiina Siilaberg keeps an eagle’s eye on the concessions investors give to issuers in the form of protections they don’t demand. They’re called ‘covenants,’ which Investopedia defines as, “designed to protect the interests of both parties. Restrictive covenants forbid the issuer from undertaking certain activities; positive covenants require the issuer to meet specific requirements.”
- By Siilaberg’s latest tally, covenant protections are at their weakest level in recorded history. To translate, investors’ collective interests are as vulnerable as they’ve ever been. Though the leveraged loan market remains open for business, Siilaberg is apprehensive about what’s just over the horizon given stretched valuations.
- “Issuance in the high yield bond market is still relatively weak compared to historic levels,” Siilaberg said. “I worry, though, because refinancing risk for many lower-rated issuers is close to an all-time high.”
- The culprit? That would be a delusional reliance on what Melentyev refers to as, “the new narrative,” and “its apparent reliance on (a) strong monetary response.” Unconventional monetary policy is delivering, “little tangible benefit.”
Overreaching central bankers are in fact doing more harm than good at this juncture. Though small investors may not be wise to the damage being wrought, veterans of financial market warfare are weary to the point of exhaustion.
The endless waiting for Godot has apparently worn their resolve down to near nothing…with good reason. For all of central bankers’ Herculean efforts, expectations that U.S. job losses will accelerate are at a two-year high while households’ prospects for the economy over the next year have fallen to a two-year low.
- Pride will surely precede the fall of the orthodoxy of today’s accepted monetary policy framework. But at what cost?
- “Everyone in the world needs yield and nothing else matters,” Melentyev laments. “This has never ended in any sort of a problem before, so we can all go back to sleep.” And what happens when we’re abruptly shaken from our slumber?
- Recognizing the painfully obvious, Voya’s Cavanaugh observed, “This isn’t a really normal environment.”
Thank you Chair Yellen & Co. for rendering snarling, lawn mower toting junk bond dogs cute and cuddly critters to retirees on fixed incomes.”
Thank you Danielle, your writing is awesome.
What OMR Means as it Relates to Our Strategies and Your Clients’ Portfolios
Stocks are likely to gain 2% to 4% over the coming 10 years. Bonds will gain just 1.5%. Both of those estimated returns are before inflation. The average investor has no idea.
With 75 percent of the money in the hands of pre-retirees and retirees by 2020, I don’t believe that money has the tolerance to weather the next -50% storm. This time, bonds may not smooth the fall.
I think there is a great opportunity for the risk-minded advisor. I believe the most important lesson to learn, in all of investing, is to understand how compound interest works. Avoiding meaningful loss is more important than capturing maximum gain. To that end, please read the educational piece I wrote, The Merciless Mathematics of Loss. Please share it with your clients.
If a portfolio declines 20%, a subsequent return of 25% is required to get back to even. If it declines 50%, a 100% subsequent return is required. The 75% great tech bubble correction? 300% and 15 years to get back to even.
The pre-retiree and retiree does not have that amount of time. They are more likely, not less, to make poor emotion-based decisions.
While I outline my macro view, if you are invested in our CMG Opportunistic All Asset Strategy, you may find that we are invested in stock ETFs even though I’m bearish on equity market returns for the next 10 years. That doesn’t mean I’m bearish over the next few months. The Strategy is a rules-based way that compares various ETFs against each other and positions to the ETFs showing the strongest relative price strength. It is flexible in approach and can move to fixed income ETFs or cash to get defensive. I share a current holding pie chart each week in Trade Signals.
If you are invested in our CMG Managed High Yield Bond Program, you’ll see that we are invested in high yield bond funds today. Yes, I am bearish on the outlook for high yield bonds, but “the trend is your friend” as they say and right now the trend is higher so we are invested. Of course, we’re diligently watching the trend in the event of a change in course.
These are just two examples of risks that can be included in a portfolio. They are flexible in nature; both look to generate growth, but with a disciplined approach to preserve principal. I believe portfolios should include a number of such return and risk drivers and portfolios that diversify between experienced managers with risk-minded processes will do better over the next number of years. If you are part of that 75% of pre-retirement or retirement capital, 60/40 is in trouble — both the fixed income (ultra-low yields) and equity (high valuations) components.
The next correction will create much better return opportunities unless one gets run over on the way to that opportunity. Until then, overweight to risk-minded investment strategies. We hope you consider some of ours.
Concluding Thought on the Direction of Interest Rates
As it relates to the short-term direction in rates, put me in the Lacy Hunt camp.
Elevated debt levels are producing poor business conditions worldwide. According to the Netherlands Bureau of Economic Policy Analysis’s (NBEPA) World Trade Monitor, the year-over-year change of the three-month average in the value of goods that crossed international borders has been hovering around 0% for the last six months. This is a dramatic slowdown from the 4.5% average growth rate registered since the end of the 2009 recession. Moreover, the last six months constitutes the weakest period since the recession. United States exports and imports confirm this deteriorating trend. In the latest twelve months, real U.S. exports and imports both contracted 1.6%. Such declines could only reflect a predominance of fragile global conditions and confirmation that the world lacks an engine of growth.
With slowing nominal economic growth, Treasury bond yields are likely to continue working lower. Stressed conditions in major overseas economies have pushed 10- and 30-year government bond yields in Japan, Germany, France, and many other European countries much lower than in the United States. In fact, the 10-year yield has turned negative in both Japan and Germany.
Foreign investors will continue to be attracted to long-term U.S. Treasury bond yields. Investment in Treasury bonds should also have further appeal to domestic investors, as the second quarter likely marks the high point of economic performance this year. The slowdown ahead will cut the already weak nominal growth trajectory. Consequently, with the normal lag, the annual inflation rate, which most importantly impacts 30-year treasury yields, should begin to turn down as the year moves to a close.
Click here to read Hoisington’s Quarterly letter.
And then there are these guys buying up bonds (next chart). Interesting times.
Lower rates may help the 60/40 investors a bit longer; however, 2.25% only goes so far and the risk of loss when rates move higher is exponentially greater when your starting place is at 5,000-year interest rate lows. Imagine telling your client he didn’t perform too well because his supposed safe investment bucket (bonds) lost 33% to 45%. Thirty years of declining yields has him looking the other way.
This environment calls for different thinking. The CMG Managed High Yield Bond Program has us invested in high yield bond funds and the Zweig Bond Model signals an investment in longer-term dated high quality bond funds and ETFs. When the trend changes, we would suggest shortening exposure to a short-term ETF like BIL. Now, more than any other time in my 32-year plus career, we should, as the great Henry Kravis advises, “Always worry about what you could lose on the downside.” Trend following can help.
As a quick aside, I just finished a short education piece titled Trend Following Works! There are hundreds of academic studies covering many markets over multiple years. The paper highlights some of those studies. And we’ve been doing it in real life since the early 1990s. Send an email to [email protected] if you’d like a copy. We’ll send it to you next week.
Trade Signals – Investor Sentiment Reflects Extreme Optimism (Posted 07-20-2016)
Click through to find the most recent Trade Signals. My favorite weight of evidence indicator, the CMG NDR Large Cap Momentum Index, remains in a sell signal. Trade Signals is posted each Wednesday. Here is a link to the Trade Signals blog page.
Personal Note
As I’m finishing today’s OMR, I’m somewhere over Ohio on my return flight home from Chicago. Chicago is a beautiful city and one of my favorites. Brianna is coming in from New York for dinner and the plan is to fire up the grill. I pretty much man the grill and claim the credit, but I shouldn’t, it is Susan’s prep that makes it taste so good. A cold Ballast Point IPA awaits.
Early tomorrow, I’m heading to Penn State and will be joining with 50 of my Phi Psi fraternity brothers for a rerun of the Phi Psi 500. We are celebrating 30 years since its last run. The 500 was a 1.1 mile beer drinking race. Six bar stops along the route with a downing of a glass of beer at each stop. 25 cents per beer, my friend. Those days are gone.
Picture 40,000 people (mostly students and alumni) lining the streets watching 2,000 runners, mostly dressed in costumes and mostly very happy, run the race. A chug of a beer at each of the six stops. As you can imagine, the downtown business association shut it down. We raised $35,000 for charity my graduating year in 1983. Penthouse Magazine ranked it the top college social event in the country. I can tell you it was really great fun. But don’t tell my kids! Seems like yesterday. Hope I recognize most of my friends.
Susan and I along with kids are heading to Lake George for a long weekend at the end of the month. We’ll be invading (because there are eight of us) Jim and Maureen’s beautiful house. It sits right on the lake and Uncle Jim is loaded up with all of the water toys and Susan’s super fun mom will be flying in. A cousin party awaits. Hopefully Brie can get a few days off from work. Can’t wait.
Some needed downtime in August is planned. As they say here in Philadelphia, we will be heading “down the shore.”
Wishing you and your family a wonderful weekend!
If you find the “On My Radar” weekly research letter helpful, please tell a friend … they can sign up for the letter by clicking the “subscribe here” link that follows:
? If you are not signed up to receive my weekly On My Radar e-newsletter, you can subscribe here. ?
With kind regards,
Steve
Stephen B. Blumenthal
Chairman & CEO
CMG Capital Management Group, Inc.
Stephen Blumenthal founded CMG Capital Management Group in 1992 and serves today as its Chairman and CEO. Steve authors a free weekly e-letter entitled, On My Radar. Steve shares his views on macroeconomic research, valuations, portfolio construction, asset allocation and risk management.
The objective of the letter is to provide our investment advisors clients and professional investment managers with unique and relevant information that can be incorporated into their investment process to enhance performance and client communication.
Click here to receive his free weekly e-letter.


