I remain short DTO (read the prospectus on it, they’ll will tell you it is). It is a flawed ETF and the risk to oil prices now are a price spike, not a collapse. The global economy is accelerating and with it will demand, the middle east has been relatively peaceful (how long can that last?), OPEC is extending production cuts and rig counts, while up over 2016 are have been essentially flat for 2017 despite the rise in oil prices.
[REITs]“Davidson” submits:
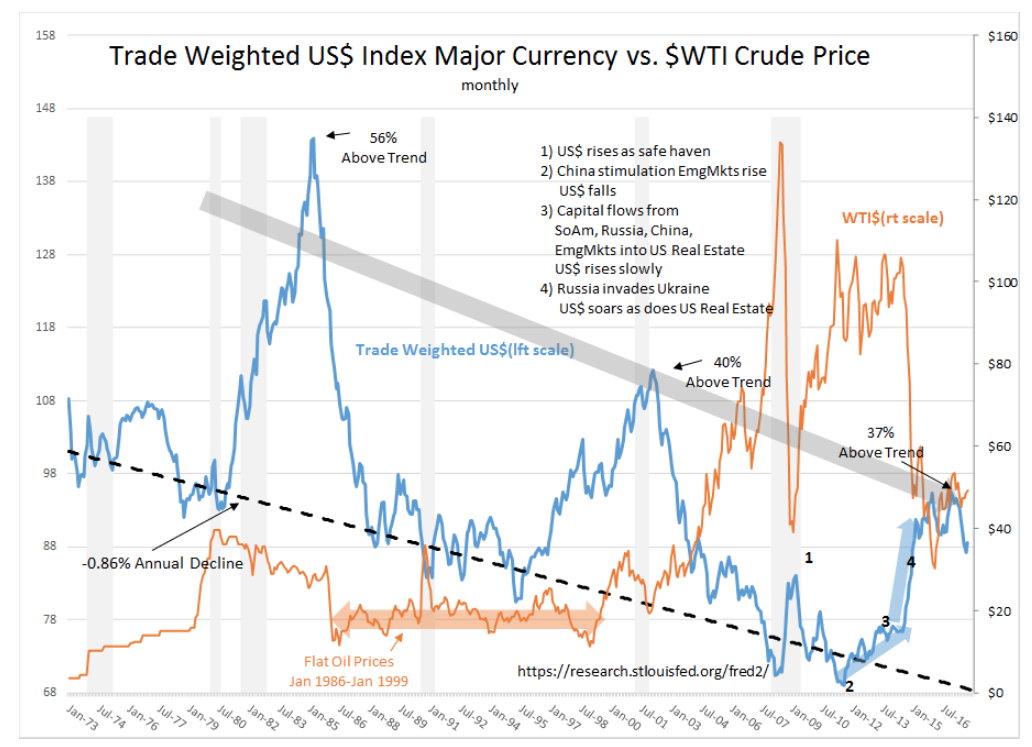
Oil pricing has long been held to indicate Supply/Demand balance. Rising prices have, since 2003, been incorporated into trading algorithms indicated both higher demand and rising economic activity with falling prices indicating the reverse. Algorithms have also incorporated an inverse pricing relationship with the US$. Since 2003, the US$ inverse relationship has been dominant. This has been so even with the general belief that prices reflected immediate changes in Supply/Demand. When oil prices fell sharply in 2014, this was in response to Russia’s invasion of Ukraine (4) and a sharp rise in the US$ as global capital sought safe havens in Europe and US assets with US$ dominated assets being favored. The net/net of this capital shift was a period of US$ strength which collapsed global commodity prices, drove US and European Sovereign debt to lowest rates in 5,000yrs and drove the prices of urban real estate to historically high levels. The Trade Weighted US$ Index Major Currency vs. $WTI Crude Price chart from Jan 1973 highlights these events. Oil traders have not incorporated this perspective and continue to see daily prices as reflecting Supply/Demand when the pricing factors are far more complex.
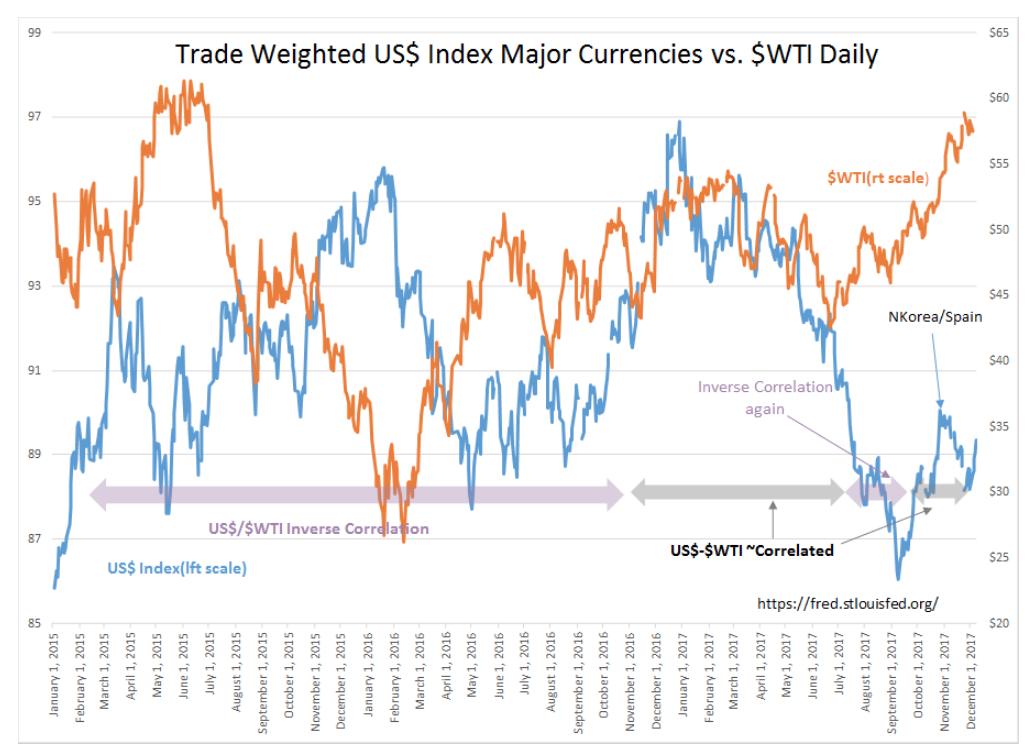
The daily data from Jan 2015 indicate the recent periods when $WTI is correlated inversely with the US$ and periods when it has not been. Since roughly October 2016, the algorithmic inverse $WTI/US$ relationship has been on and off. There was a period of fear of disruption of global trading relationships with the result of the US Presidential Election, the US$ rose sharply in Dec 2016 to its highest level since July 2003. As immediate disruption became less of an issue, the US$ retreated. The WTI$/US$ lost the inverse correlation as investors entered limbo and reassessed the potential of the new administration’s policies. The inverse correlation was briefly reestablished July 2017-Sept 2017, then both US$ and WTI$ began to rise in tandem as threats of conflict with North Korea and then political disruptions in Spain’s Catalonia region threatened the European Union drove capital to the US. Since November 2017, Spain’s political issues have subsided, but North Korea is back in the news once again producing another slight rise in the US$. Investors seek the US$ whenever global issues threaten capital.
It important to note that the $WTI broke its inverse correlation to the US$ in August 2017. $WTI has continued rising since even with continued and wide-spread predictions by commodity traders that excess supply, an ‘Oil Glut’, continues as far into the future as the eye can see. The rise in $WTI and the relationship to the US$ is shown in the daily data.
The question to be asked is “Why is $WTI no longer shifting inversely with the US$?”
It may be that the actual Supply/Demand as opposed to the perceived “Supply/Demand” is emerging. Energy supply/demand is complex and requires long-term perspective. Companies and countries think in terms of 20yr+ contracts when thinking of the capital requirements, associated infrastructure and permitting. Oil and gas flows to consumers are dictated by demand. Energy companies must at all times balance their pace of discovery, production and use of capital against forecasted demand and technological advances. Demand has varied with shifts in the US$, government environmental policies, manufacturing and end-consumer efficiencies, market psychology, natural disasters and global political events. It is a heady mix against which companies must gear themselves to operate profitably long-term. In spite of a very complex set of inputs, energy demand grows with global economic expansion. This growth even with new and more efficient technology has been roughly 1.5%-2% annually.
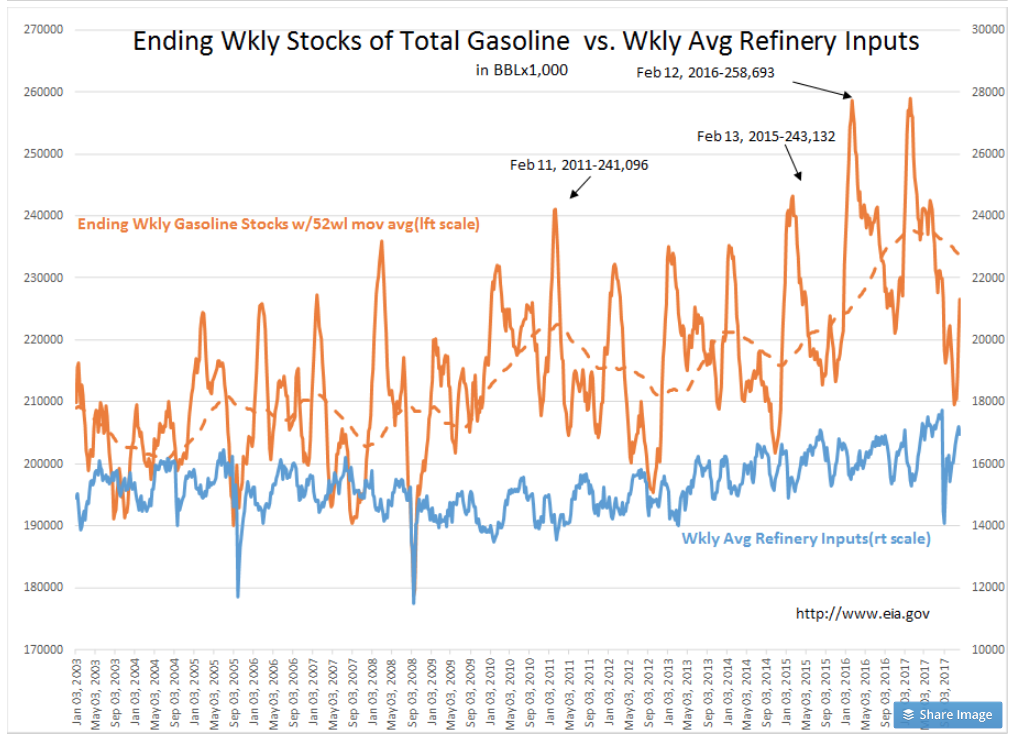
The US response to global growth has been increased refinery capacity, a ramp in US Oil Production and a significant ramp (600% from 2010) in Refined Petroleum Product Exports. With crude exports now permitted, the US has also raised crude exports to the 2mill BBL/Day range. With the rise in US Production, a period of inventory building to 30day refinery supply has occurred the past few years. Most traders have taken this as a sign of relentless and self-destructive over production. That the inventory rise has been simply a rise needed to smooth out delivery requirements of refined products has not been a consideration of commodity traders. Why such inventory is required is now apparent with the recent bout of hurricanes in the US Gulf region. Hurricanes disrupted crude supply and production of refined products but demand continued unabated. Today’s crude inventories are 92mil BBLs less that levels of March 2017. Gasoline stocks dropped to 3yr lows. Recent hurricanes had substantial impact on inventories when refineries, production and imports were impacted but demand for refined products continued.
Global energy demand has continued to rise and may even be accelerating with the current global economic expansion. Demand does not slow for weather related events. The facts are that adverse weather is more likely to raise demand in the efforts to cleanup and repair damage. The more destructive the weather, the more energy required to recover. For industries with constant demand, a certain level of inventories are required to meet weather related and seasonal shutdown needs. Looking at the current relative levels of crude and gasoline inventories, it appears the industry is greatly under-inventoried vs recent levels. $WTI has risen since July 2017. This $WTI price rise has occurred against the inverse correlation to shifts in the US$. In my opinion, the need in the US market to rebuild inventories to previous levels is causing prices to rise. I think basic Supply/Demand is now dominating $WTI as the major factor.
In my opinion, the current rise in $WTI reflects the US need to rebuild inventories for smooth operations. $WTI should continue to rise in spite of most trader’s belief of an “Oil Glut”.


