
S&P 500 took advantage of Thursday‘s technicals, rode Apple Inc (NASDAQ:AAPL) coattails, and shook off positive NFPs while ignoring prior one‘s downward revision. The weak internals though haven‘t changed – it‘s about where this weaker short squeeze (weaker than the preceding one) runs out.
Out of these four levels given, I consider the area up to 4,188 as most realistic (followed by 4,209 – and that‘s true unless market breadth takes a dramatic turn for the better – not what I view as a viable scenario.
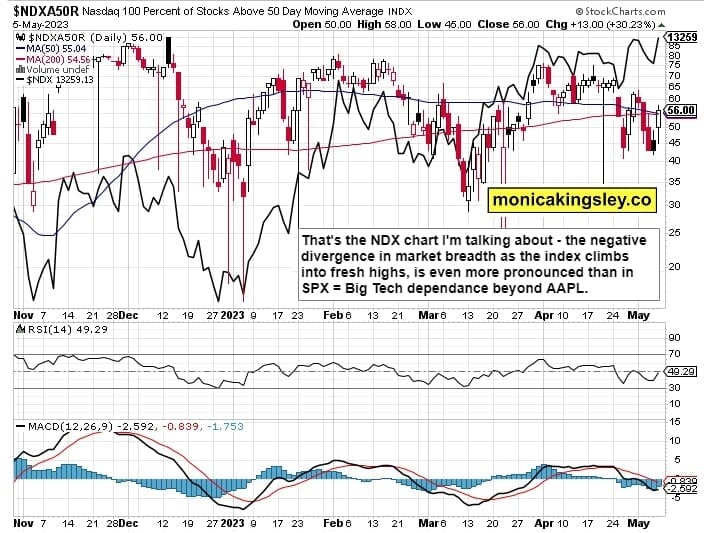
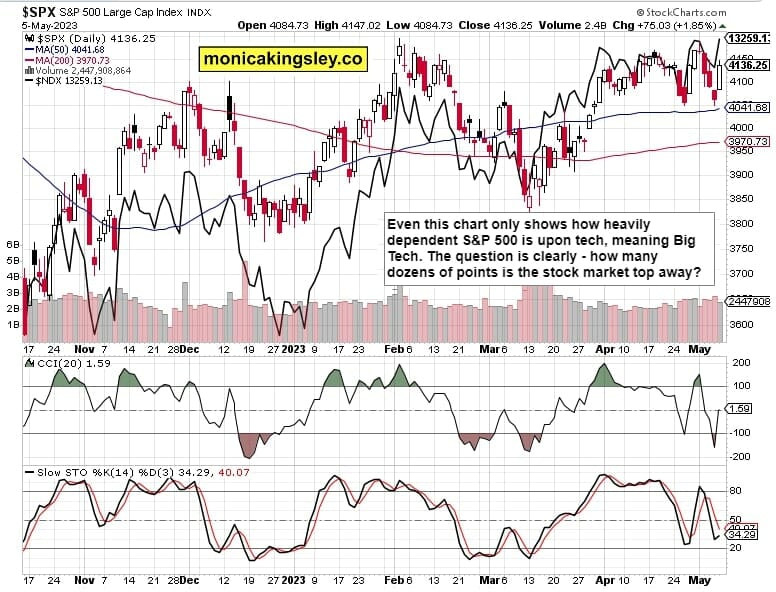
Similar chart for S&P 500 isn‘t as badly looking, but also contains a bearish divergence – one that has long been in the making. This run higher from Oct lows has been losing breath for months.
And little wonder, given that the key banking (and credit) situation hasn‘t changed with respect to deposits and T-Bill rates – and there is no prospect of these drivers to go away. The Fed is still raising rates (Jun is a live month) and shrinking its balance sheet while the greatest disconnect (between what Powell says and what the bond market demands and expects would do, which is at least 3 or rather 4 rate cuts as early as Sep), TGA is too low, and the Treasury needs to roll over $7T of debt this year alone.
LEIs are still pointing lower – don‘t be misled by the false dawn in PMIs, real estate, or the relatively resilient job market and corporate earnings.
For all the continuing disinflation, the progress in core inflation isn‘t good enough to justify declaring victory and going home – Powell had been clearly saying. Sustainable stock market bottom simply aren‘t made when LEIs are still declining or when the Fed is staying the tightening course with all that means for banking profitability.
The real question is not if we have a soft landing (shallow and short recession), but how long and deep is the recession going to actually be. As for its arrival, I‘m sticking to Q3 2023.
Yield curve is still inverted, meaning banks can‘t make easily money (short-term liabilities while long-term assets – and this differential is inverted), therefore on top of the easy money depositors can make in T-Bills or money market funds, KRE and XLF don‘t face an easy ride in the weeks and months ahead as deposits are declining in banks both big and small, yet the megabanks have better ability to withstand the stress (the stress of high short-term yields).
And then there is commercial real estate that will keep on declining still deeper, and regionals are especially exposed.
The Fed will find little reason to relent in its restrictive stance with Wednesday‘s CPI report – I think the yearly headline figure would come at 5.1% vs. 5.0% expected, but the core one would surprise to the upside (at possibly even 0.5% vs. 0.3% expected).
Thursday‘s PPI would probably underwhelm, and come only a bit above zero, and the core PPI as well. Unemployment claims at 250K seem as a correct expectation, but Friday‘s consumer confidence can easily come at 64.
If I had to pick one day when the stock market sellers would arrive most meaningfully, it would be Wednesday thanks to the lagging CPI indicator.
And what would that do to Treasury yields? Big picture, after reaching a generational top in summer 2020, the great bond bull market that started in the early 1980s, is over – yields have broken to the upside and we‘re in a secular bond bear market now, but I think this year would still mark consolidation and not a non-stop spurt to higher yields resuming – the 10-y (currently at 3.43%) has good odds of closing the year at 3.30%.
Once the Fed stops raising rates and pauses, the deterioration in economic prospects would would put a floor beneath Treasuries (and the high yields on the short end would retreat a bit, making for a more usual shape of the yield curve).
Simply put, we‘re living in a decade of generally rising rates, and commodities and precious metals supercycles that are merely getting started. In early Dec 2022, I covered some of the fine opportunities identified.
Keep enjoying the lively Twitter feed via keeping my tab open at all times (notifications on aren’t enough) – combine with Telegram that always delivers my extra intraday calls (head off to Twitter to talk to me there), but getting the key daily analytics right into your mailbox is the bedrock.
So, make sure you‘re signed up for the free newsletter and make use of both Twitter and Telegram – benefit and find out why I’m the most blocked market analyst and trader on Twitter.
Let‘s move right into the charts (all courtesy of www.stockcharts.com) – today‘s full scale article contains 6 of them.
S&P 500 and Nasdaq Outlook
While tech is thanks to Big Tech rising, mounting signs of narrowing breadth elsewhere, would overpower S&P 500 as much as the weak seasonality of “Sell in May and go away”. No matter whether stocks remain in the 4,1xx or make it to the 4,2xx, the air is thinning up there, and key risk-on sectors haven‘t thus far demonstrated more than a “compulsory” rebound off their respective Thursday‘s local supports reached.
4,078 break is the ultimate bearish objective to give them the clear upper hand (midweek?), and start ushering passive indexing readjustments aka broader synchronized selling.
Thank you for having read today‘s free analysis, which is a small part of my site‘s daily premium Monica’s Trading Signals covering all the markets you’re used to (stocks, bonds, gold, silver, miners, oil, copper, cryptos), and of the daily premium Monica’s Stock Signals presenting stocks and bonds only. Both publications feature real-time trade calls and intraday updates.
While at my site, you can subscribe to the free Monica‘s Insider Club for instant publishing notifications and other content useful for making your own trade moves.
Turn notifications on, and have my Twitter profile (tweets only) opened in a fresh tab so as not to miss a thing – such as extra intraday opportunities. Thanks for all your support that makes this great ride possible!
Thank you,
Monica Kingsley
Stock Trading Signals
Gold Trading Signals
Oil Trading Signals
Copper Trading Signals
Bitcoin Trading Signals
All essays, research and information represent analyses and opinions of Monica Kingsley that are based on available and latest data. Despite careful research and best efforts, it may prove wrong and be subject to change with or without notice.
Monica Kingsley does not guarantee the accuracy or thoroughness of the data or information reported. Her content serves educational purposes and should not be relied upon as advice or construed as providing recommendations of any kind.
Futures, stocks and options are financial instruments not suitable for every investor. Please be advised that you invest at your own risk. Monica Kingsley is not a Registered Securities Advisor. By reading her writings, you agree that she will not be held responsible or liable for any decisions you make.
Investing, trading and speculating in financial markets may involve high risk of loss. Monica Kingsley may have a short or long position in any securities, including those mentioned in her writings, and may make additional purchases and/or sales of those securities without notice.


