On My Radar: A Cyclical Bear Market (Here’s Why)January 15, 2016
By Steve Blumenthal, CMG
The speed at which stocks have dropped 10% (defined as a correction) two times in a short period of time has happened just three times in the last 100 years. 1927, 2000 and 2008.
This from Art Cashin yesterday, “Jason Goepfert, the outstanding pilot of SentimenTrader dug into his incredibly extensive files to uncover a rather rare condition. He noted that the indices have had two 10% corrections in a rather short span. That has only happened three times in the last 100 years. Unfortunately, those occurrences were in 1929, 2000 and 2008. As you may recall, those were not particularly good years for the bulls.”
A bear market is defined as a decline of 20% or more. They happen. Part of the game. Most investors can overcome a 20% decline (needing a subsequent 25% return to get back to even). Overcoming larger declines, like 2008 and 2000, require larger recovery gains and that can take years. Overcoming a -50% decline requires a subsequent gain of 100%. Overcoming a -75% loss requires a 300% return. See the Merciless Math of Loss. Lets hope we don’t see a 1929, 2000 or 2008 like meltdown.
Today, I share with you a chart that has done an excellent job at predicting bear markets. Simply, when the majority of stocks in the S&P 500 Index decline by more than 20% (meaning most stocks are in a defined bear market), the larger index decline follows.
Through Wednesday, 49.8% of the 500 constituents were down more than 20% while the S&P 500 Index was down just 11%. After today’s market beating, I believe we have entered a new cyclical bear market. I hope you’ll find the data interesting. Check it out below.
My two cents remains the same: Hedge that equity exposure and overweight liquid alternatives. We want to be in a position to pick up bargains when the valuations become attractive. Not yet there. Further, I share a few ideas below and set some price targets for the S&P 500.
? If you are not signed up to receive my weekly On My Radar e-newsletter, you can subscribe here. ?
Included in this week’s On My Radar:
- S&P 500 – A Cyclical Bear Market (Here’s Why)
- The High-Yield Bond Market and Margin Debt
- Liquid Strategies for Both Up and Down Markets
- Trade Signals – The Weight of Evidence Remains Bearish
- Personal Note – NYC, Barron’s, Florida and some sage advice from an unknown professor
S&P 500 – A Cyclical Bear Market (Here’s Why)
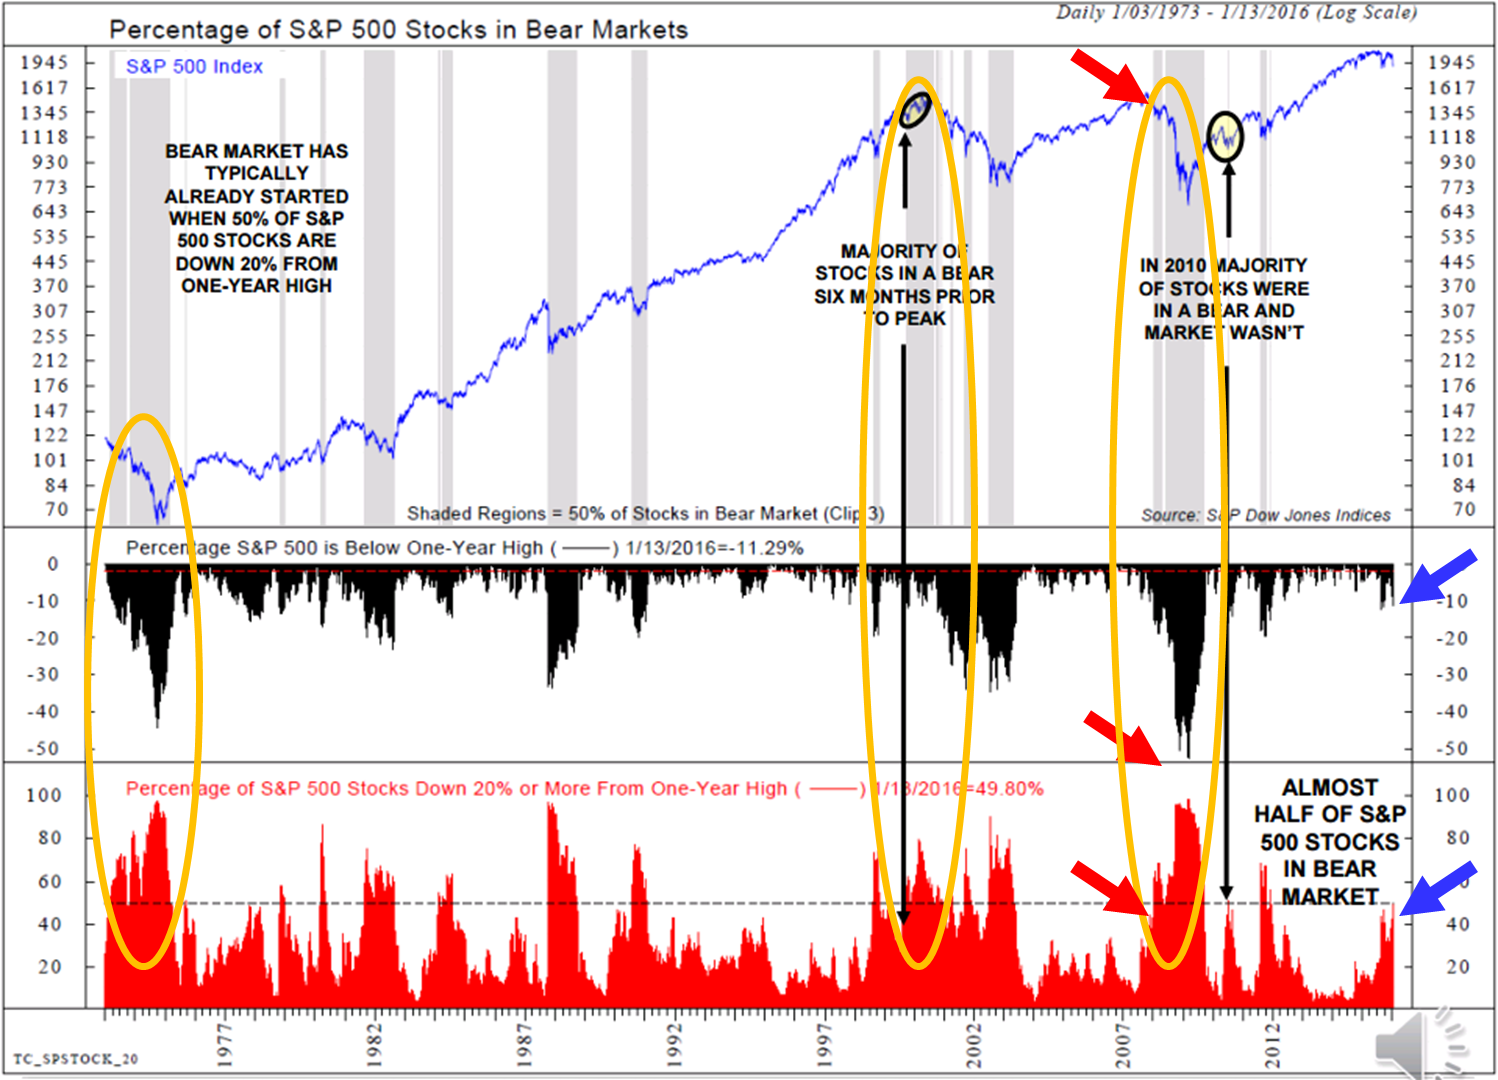
Typically, when you get 50% of the stocks down more than 20% (definition of a bear market), a bear market has already started.
50% of the stocks in the S&P 500 Index are down more than 20%. In all past incidences, except for two, the S&P 500 was already in a bear market.
One exception was in the late 1990’s. From the point at which more than 50% of the S&P 500 stocks were down over 20%, the S&P 500 continued to gain another 16%; however, six months later, we were in one of the worst bear markets in history.
The other exception was in 2010, when more than 50% of the stocks were down more than 20% from their one-year high. In that instance, we did not see a bear market. So let’s call it just one exception.
Here is the chart (data). Let me see if I can make some sense out of it for you.
- A bear market has typically already started when 50% of the S&P 500 stocks are down more than 20%. On Wednesday, 49.8% of the stocks were down more than 20%.
- The grey shaded areas show the beginning at points in time more than 50% of the stocks were down more than 20%. Note three red arrows in early 2008.
- Yellow oval circles example several periods.
- The two exceptions are 1999 and 2010. Though we know what ultimately followed 1999. 2010 stands the only exception. So when you see this much deterioration in the underlying constituents, you generally get a bear market.
- The market was down 11.29% from its high at Wednesday’s market close. It rallied nicely yesterday gaining nearly 1.5%. It is lower today.
- What we want to avoid are the large declines. My advice is to use rallies to fully hedge your equity exposure and/or reduce exposure to stocks. Here is the chart. Shoot me a note if you have any questions reading it. Put your geek goggles on.
See important disclosures below. CMG, NDR
High-Yield Bond Market and Margin Debt
HYG and JNK are the two biggest junk-bond ETFs. Both are down nearly 2% today and trading at six-and-a-half-year lows.
High-yield and equities are good forward economic indicators. Last week I showed two recession watch charts. One is a global recession probability model with an 85% accuracy rate, reflecting that the bulk of the globe is in recession today (no guarantees of course). The second chart shows the probability of U.S. recession. It too has a good track record. Here is another look at the U.S. chart.
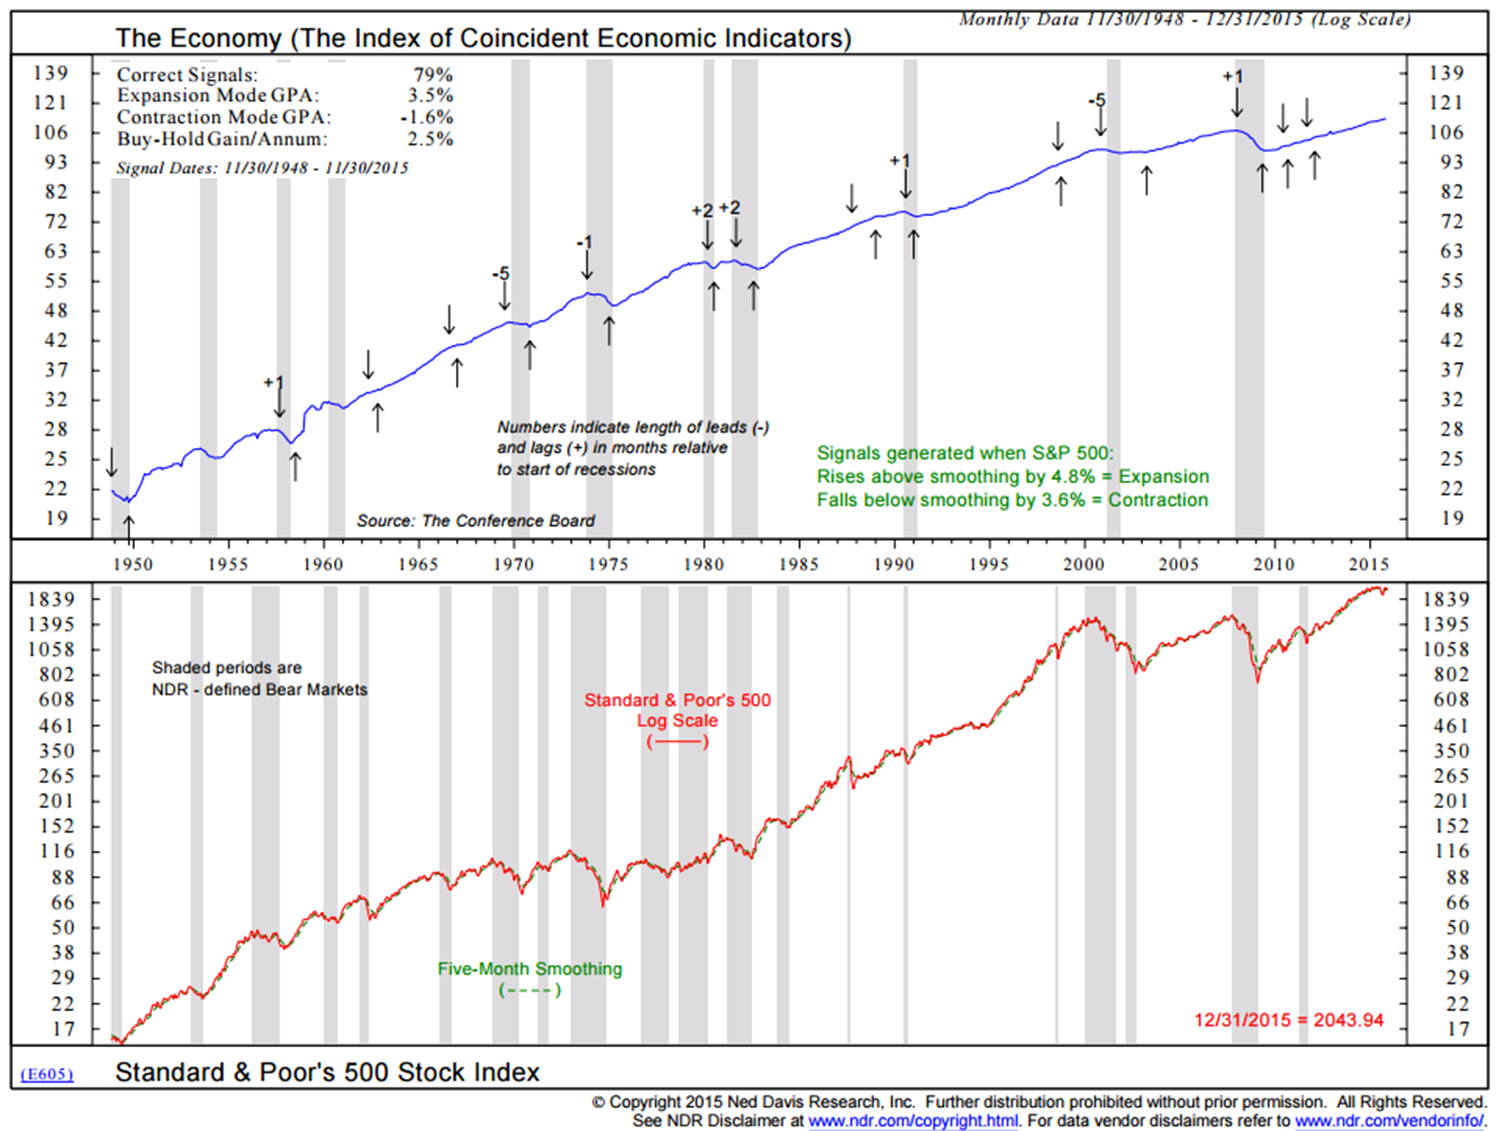
The process has done a good job at getting in front of recession start. Not perfect but valuable with a 79% accuracy rate. Needed is a 3.6% decline below its Five-Month Smoothing to trigger a probable recession ahead. The S&P 500 Index is now 9% below its Five-Month Smoothing. Since this process looks at month-end data, we’ll have to wait until January 30 to see if it triggers. With two weeks to go well need a strong market rebound to avoid a recession signal.
The reason we should watch out for recessions is that the largest equity market declines happen in recessions.
Margin debt:
Margin debt remains a concern. Market declines tend to be much more severe when margin debt is high. This is when investors either buy more stock on margin (leveraging up their risk) or borrow money out of their brokerage accounts essentially doing the same thing.
If you deposited $100,000 in a stock account and bought $200,000 worth of stock, a 20% decline in the market is a loss of $40,000 on your $200,000 leveraged investment. That means your actual account value less the money you borrowed is worth $60,000 ($100,000 – $40,000). It is at about this time that margin calls kick in. An investor either ponies up more money or the brokerage firm begins to force sell the stock. A 50% decline in the market on $200,000 is a $100,000 loss. Subtract that from your original investment of $100,000 and you are at zero.
Thus, high margin debt and cyclical bear markets do not mix. Forced selling begets more forced selling and it is why stock market corrections seem to happen quickly. As you look at the next chart, note the high level of margin debt today and also note the level of margin debt after the corrections in 1987 and 2000. Interestingly, it stays fairly high following the 2008 market melt-down.
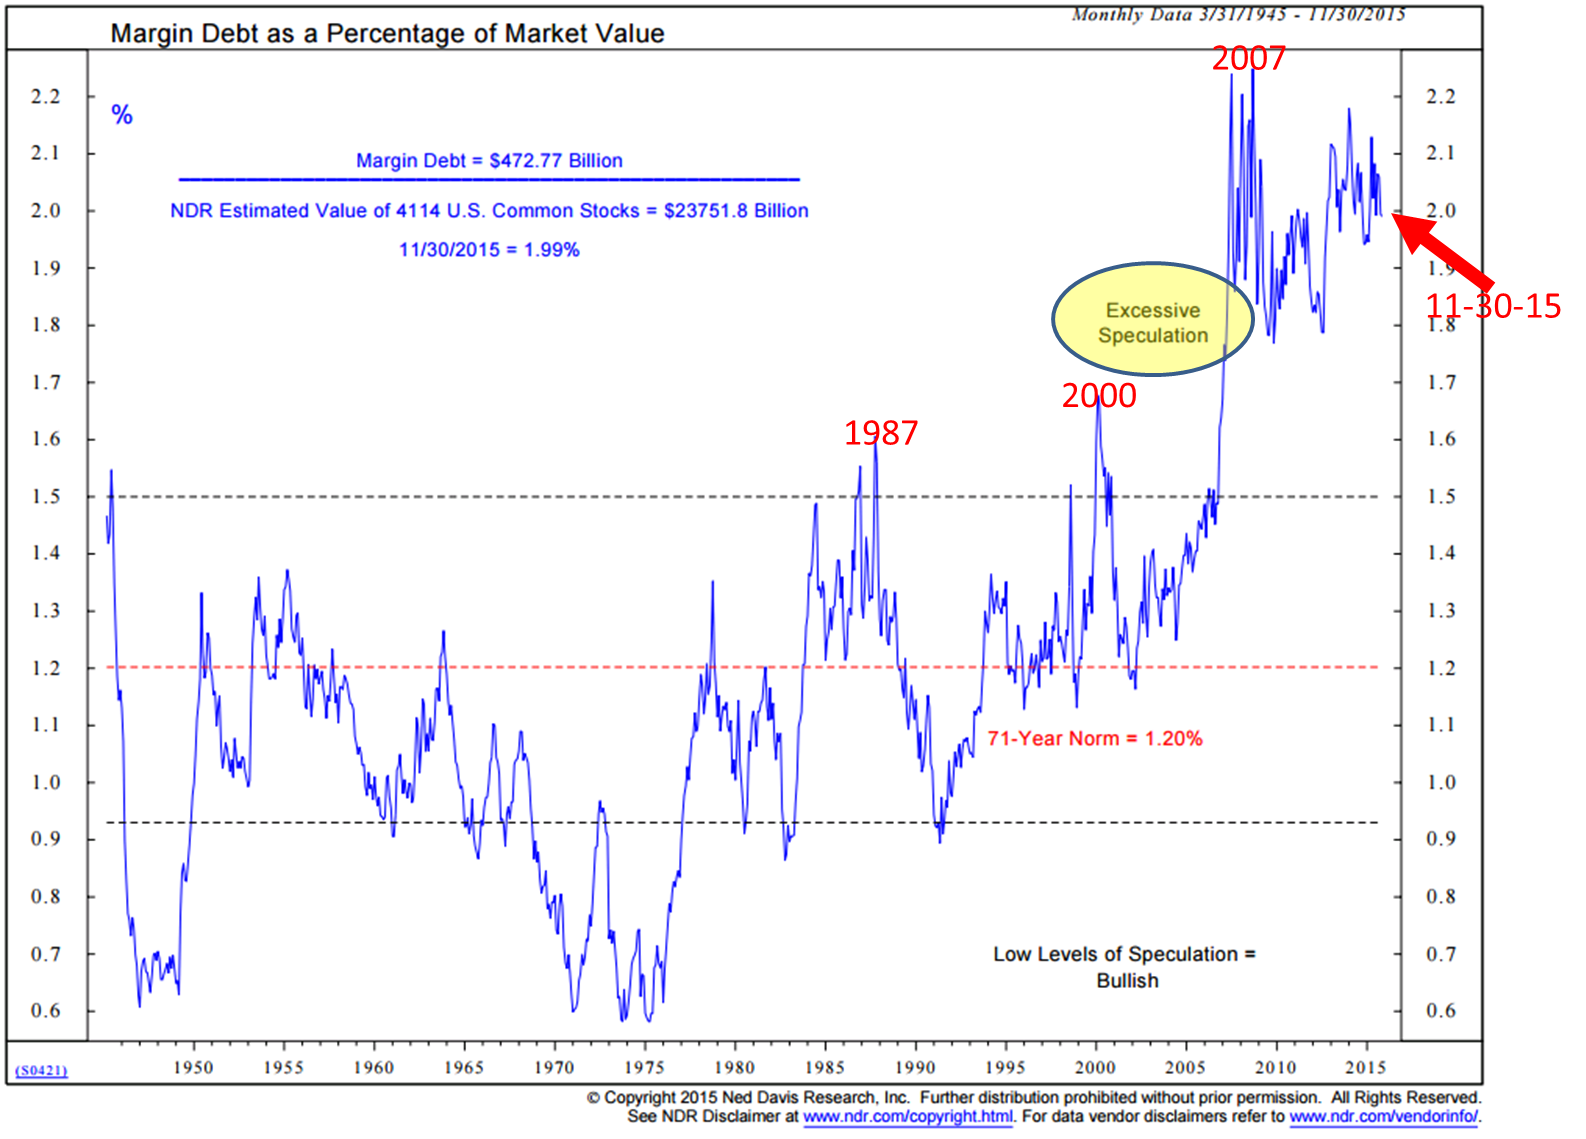
We should keep a close eye out for the unwinding of margin debt. It may be when we start to get interested in over-weighting equities again.
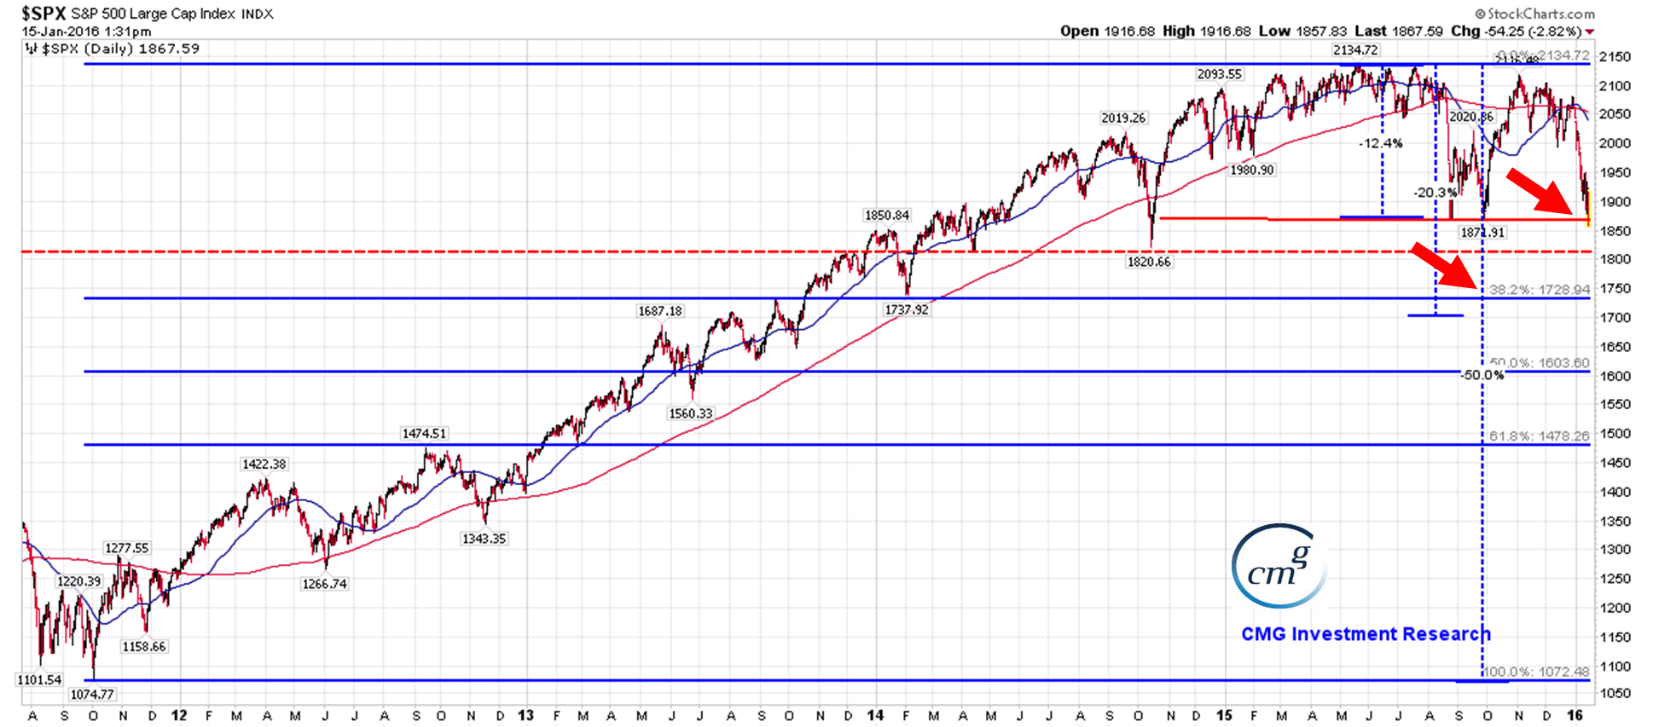
Price Targets
The important level’s of support are marked by the two red arrows. We are testing the 1850-1860 level today (top red arrow). If that breaks, then expect a move first to 1820 (the September 2014 low). Further, the second red arrow marks support at 1729. That represents a 38.2% Fibonacci retracement from the 2011 low to the 2015 high. It would represent a near 20% correction from the high. A probable target.
We are at a support level where we should see a recovery bounce higher. We’ll see.
Liquid Strategies for Both Up and Down Markets
Our mutual fund line-up has never been stronger. I am pleased with the performance of several of our funds in this difficult market. Please note that due to various mutual fund regulations, I cannot express the details in this piece though I wish I could.
The idea with liquid alternative funds (defined as anything other than traditional buy-and-hold) is that they have the ability to make money in a way that is not dependent on the stock and bond market being in a bullish up trend. The idea is that some investment strategies have the ability to generate returns that are non-correlating to your traditional investment holdings. In this way, when combined together with your more traditional holdings, they may serve as a good diversifier and may help to smooth your overall return stream.
Please give Linda Cianci (610-989-9090 extension 140) a call or reply to this email to set up a call with one of our team members.
Global macro, managed futures, long/short equity are some examples of the types of strategies to consider. There are a number of strategies that are doing well right now. To better understand the types of liquid strategies to consider and how you might put them in your portfolio, see “Correlation, Diversification and Investment Success”.
As a quick aside, we see a move to safer asset positioning across most of our tactical strategies. Our High-Yield Bond Program moved back to cash (and/or T-Bills) this past Tuesday (risk off) and our Tactical All Asset Strategy is seeing the strongest relative price leadership in high quality bonds, the utility sector, gold and cash. We traded out of a technology fund on Wednesday and into a high quality bond fund. Just two of eleven portfolio positions are in high vol equity funds. Our CMG Ned Davis Research Large Cap Momentum/Market Breadth Index has been in a sell/market neutral signal since June 30, 2015.
Trade Signals – The Weight of Evidence Remains Bearish
By Steve Blumenthal
January 13, 2015
Included in this week’s Trade Signals:
Equity Trade Signals:
- CMG NDR Large Cap Momentum Index: Sell Signal – Bearish for Equities
- Long-term Trend (13/34-Week EMA) on the S&P 500 Index: Sell Signal — Bearish for Equities
- Volume Demand is greater than Volume Supply: Sell Signal – Bearish for Equities
- NDR Big Mo: See note below.
Investor Sentiment Indicators:
- NDR Crowd Sentiment Poll: Extreme Pessimism (short-term Bullish for Equities)
- Daily Trading Sentiment Composite: Extreme Pessimism (short-term Bullish for Equities)
Fixed Income Trade Signals:
- The Zweig Bond Model: Buy Signal
- High-Yield Model: Sell Signal
Economic Indicators:
- Don’t Fight the Tape or the Fed: Indicator Reading = -1 (Bearish for Equities)
- Global Recession Watch Indicator – High Global Recession Risk
- U.S. Recession Watch Indicator – Low U.S. Recession Risk
Click here for the link to the full Trade Signals (updated charts and commentary).
Personal note – NYC, Barron’s, Florida and some sage advice from an unknown professor.
In my view, the market remains over-valued, over-bought and there now exists a bit less conviction. Europe has now declined back to the level at which QE was launched. I expect some form of central bank response and that may once again goose the markets higher but recession is probable in the near future and cycles can’t be avoided. I think we see -20% on the indices and maybe soon. More than that or less than that depends on policy response. And that part of the equation remains a mess. Stay patient, risk focused and broadly diversified.
NYC is up next. I have a video interview with Barron’s next Tuesday and a few meetings in the afternoon. Susan’s birthday is next Wednesday and we plan on a dinner out (Sushi) in the city. Florida follows shortly thereafter. I’m attending and speaking at the Inside ETFs conference in Florida on January 24-27. I’ll be sharing my thoughts on gold. Here is a link to the speaker line up and agenda. Please reach out to me by email if you are going to be there. I’d love to grab a coffee.
Following the Inside ETFs conference, on January 28, I’ll be in Venus, Florida (just south of Sarasota) meeting with the research team at Ned Davis Research. That should be fun.

Beer with a few friends:
“A professor stood before his philosophy class and had some items in front of him. When the class began, he wordlessly picked up a very large and empty mayonnaise jar and proceeded to fill it with golf balls. He then asked the students if the jar was full. They agreed that it was.
The professor then picked up a box of pebbles and poured them into the jar. He shook the jar lightly. The pebbles rolled into the open areas between the golf balls. He then asked the students again if the jar was full. They agreed it was.
The professor next picked up a box of sand and poured it into the jar. Of course, the sand filled up everything else. He asked once more if the jar was full. The students responded with a unanimous ‘yes.’
The professor then produced two Beers from under the table and poured the entire contents into the jar effectively filling the empty space between the sand. The students laughed.
‘Now,’ said the professor as the laughter subsided, ‘I want you to recognize that this jar represents your life. The golf balls are the important things—your family, your children, your health, your friends and your favorite passions—and if everything else was lost and only they remained, your life would still be full. The pebbles are the other things that matter like your job, your house and your car. The sand is everything else—the small stuff.
‘If you put the sand into the jar first,’ he continued, ‘there is no room for the pebbles or the golf balls. The same goes for life.
If you spend all your time and energy on the small stuff you will never have room for the things that are important to you.
Pay attention to the things that are critical to your happiness.
Spend time with your children. Spend time with your parents. Visit with grandparents. Take your spouse out to dinner. Play another 18. There will always be time to clean the house and mow the lawn.
Take care of the golf balls first—the things that really matter. Set your priorities. The rest is just sand.
One of the students raised her hand and inquired what the Beer represented. The professor smiled and said, ‘I’m glad you asked.’ The Beer just shows you that no matter how full your life may seem, there’s always room for a couple of Beers with a friend.” Source
Here is a toast to you, your family and a couple of cold beers with your friends.
Have a great weekend!
With kind regards,
Steve
Stephen B. Blumenthal
Chairman & CEO
CMG Capital Management Group, Inc.
Stephen Blumenthal founded CMG Capital Management Group in 1992 and serves today as its Chairman, CEO and CIO. Steve authors a free weekly e-letter entitled, On My Radar. The letter is designed to bring clarity on the economy, interest rates, valuations and market trend and what that all means in regards to investment opportunities and portfolio positioning. Click here to receive his free weekly e-letter.
Social Media Links:
CMG is committed to setting a high standard for ETF strategists. And we’re passionate about educating advisors and investors about tactical investing. We launched CMG AdvisorCentral a year ago to share our knowledge of tactical investing and managing a successful advisory practice.
You can sign up for weekly updates to AdvisorCentral here. If you’re looking for the CMG White Paper Understanding Tactical Investment Strategies, you can find that here.
AdvisorCentral is being updated with new educational resources we look forward to sharing with you. You can always connect with CMG on Twitter at @askcmg and follow our LinkedIn Showcase page devoted to tactical investing.
A Note on Investment Process:
From an investment management perspective, I’ve followed, managed and written about trend following and investor sentiment for many years. I find that reviewing various sentiment, trend and other historically valuable rules based indicators each week helps me to stay balanced and disciplined in allocating to the various risk sets that are included within a broadly diversified total portfolio solution.
My objective is to position in line with the equity and fixed income market’s primary trends. I believe risk management is paramount in a long-term investment process. When to hedge, when to become more aggressive, etc.
Trade Signals History: Trade Signals started after a colleague asked me if I could share my thoughts (Trade Signals) with him. A number of years ago, I found that putting pen to paper has really helped me in my investment management process and I hope that this research is of value to you in your investment process.
Provided are several links to learn more about the use of options:
For hedging, I favor a collared option approach (writing out-of-the-money covered calls and buying out-of-the-money put options) as a relatively inexpensive way to risk protect your long-term focused equity portfolio exposure. Also, consider buying deep out-of-the-money put options for risk protection.
Please note the comments at the bottom of this Trade Signals discussing a collared option strategy to hedge equity exposure using investor sentiment extremes is a guide to entry and exit. Go to www.CBOE.com to learn more. Hire an experienced advisor to help you. Never write naked option positions. We do not offer options strategies at CMG.
Several other links:
http://www.theoptionsguide.com/the-collar-strategy.aspx
https://www.trademonster.com/marketing/upcomingWebinarEvents.action?src=TRADA2&PC=TRADA2&gclid=CKna3Puu6rwCFTRo7AodRiQAlw


