
Submitted by Stephen Jones, – see the full study at SSRN
Earnings of the overall market are typically viewed in the same perspective as earnings of individual companies. Conflicts between these perceptions are revealed with the use of Kalecki’s profit function to reveal the identification of negative characteristics with macro earnings, introduce the concept of “macro-earnings negativity”, and demonstrate the theoretical and statistical superiority of MV/GDP valuation measure versus earnings-based measures. Based on the MV/GDP metric, a multi-variable forecasting model is developed which utilizes both new and prior-researched variables, the most effective of which is a demographic measure. The resulting composite model is statistically superior to popular metrics, and, relative to popular benchmarks, forecasts considerably lower returns for the coming decade.
1. The Questionable Use of Earnings as an Indicator of Stock Market Value
Earnings are generally considered a significant, if not primary, benefit of equity ownership. From an individual company, or micro, perspective, such is typically the case. However, what is rarely considered is that macro-level earnings, or earnings of the overall market, have a negative component. Here, we seek to identify and explain this “macro-earnings negativity”.
Q4 hedge fund letters, conference, scoops etc
Our identification and explanation of “macro-earnings negativity” focuses on the use of broad, market-level earnings to value the equity market. Currently, the most popular equity market valuation metric is P/E10 (sometimes called CAPE), a measure of the value of the stock market relative to its earnings over the prior 10 years. The measure, created by Yale professor and Nobel-prize winner Robert J. Shiller, gained popularity in 2000 by the publication of Shiller’s Irrational Exuberance, which proposed the P/E10 measure. Also, well received was Andrew Smithers’ and Stephen Wright’s book Valuing Wall Street, which supported “Tobin’s q”, a measure of the market’s price to its book value, introduced in 1969 by Nobel laureate James Tobin. Each of the above books’ 2000 forecast correctly foretold poor equity returns over the coming decade, and propelled their proposed ratios into prominence. Of the two metrics, however, the most common is P/E10, the earnings-based measure. Despite evidence that Tobin’s q is simpler and more effective (see, Harney, Tower, 2003), there is still a strong preference for P/E10’s earnings-based measure. This preference appears to be due to the belief that earnings are the most important factor behind owning a specific equity, and that the sum of historical combined individual (micro) company earnings is the best indicator of future macro earnings.
John Campbell and Robert Shiller first popularized P/E10 in Valuation Ratios and the Long-Run Stock Market Outlook (1998). Although their earnings-based equity valuation model possessed good predictive ability, and their 1998 and 2001 forecasts for poor market returns over the coming ten years were largely correct, our research into earnings factors on a macro level reveals a conflict with using historical collective individual corporate earnings as an indicator of future macro earnings. Moreover, significant increases in government and personal debt since the 1998 popularization of P/E10 have resulted in this conflict being more obvious and more important than ever.
2. The Preference for Earnings-Based Measures
Despite efforts to identify methods to forecast equity returns, conspicuously uncommon is a variable whose predictive abilities are much stronger than earnings-based measures: Market Value1/Gross Domestic Product2 (MV/GDP). Proving a scarcity of coverage is difficult, but MV/GDP is not even mentioned in any of the following research:
- “Valuation Ratios and the Long-Run Stock Market Outlook,” by Campbell and Shiller (1999 and 2001).
- “Forecasting Stock Returns,” an extensive review of forecasting strategies, by Rapach and Zhou (2012).
- “A Comprehensive Look at the Empirical Performance of Equity Premium Prediction,” by Welch and Goyal (2008). This award-winning article, which “comprehensively reexamines the performance of variables that have been suggested by the academic literature to be good predictors of the equity premium,” does not include MV/GDP.
- “Predicting Excess Stock Returns Out of Sample: Can Anything Beat the Historical Average?” This study of at least 12 “standard predictor variables” does not include MV/GDP.
In summary, there is no academic study, to our knowledge, that researches MV/GDP as a variable to forecast equity returns. The investment community has used MV/GDP, but rarely, despite Warren Buffet’s claim that “it is probably the best single measure of where valuations stand at any given moment.”3 No study of the popularity of market valuation variables appears available, but several analyses have pointed out the overwhelming popularity of P/E ratios4,5,6,7. We found only one study of market valuation measures based on their degree of popularity, and it did not list MV/GDP among its six metrics5. Additional evidence of MV/GDP’s lack of popularity is that the variable is rarely even mentioned in the more popular, non-academic coverage of market valuation measures. For example, it was not in Vanguard’s 2012 study, “Forecasting Stock Returns: What Signals Matter, and What Do They Say Now?”, which tried “to assess the predictive powers of more than a dozen metrics.” And, in their August 2013 Strategy Snippet (Subramanian, 2013), Bank of America Merrill Lynch reported on “the 15 valuation metrics we analyze;” none of which were MV/GDP. The omission of MV/GDP, and, moreover, the lack (to our knowledge) of criticism for the omissions, is evidence that MV/GDP is not considered to be as popular or widely accepted. Respect for the measure has marginally improved since this paper was first written in 2013.
Given MV/GDP’s strong forecasting ability, it is difficult to determine why it isn’t used more often. Of course, one could justifiably argue that brokerages want to avoid the measure’s bearish forecasts, as bullish forecasts both provide customers what they want to hear as well as end up boosting the brokerages’ bottom lines. As Bill Gross (2015) notes, “…it never serves their business interests to forecast a decline in the product they sell.” Another logical reason for the measure’s absence from research, and for its unpopularity in the investment world, is a perception that the variable lacks theoretical justification as a forecaster of equity returns. Such a lack of theoretical justification would raise concerns of a spurious relationship between market value and GDP, and thus discourage its use as a forecasting variable. Another potential argument against the measure is that large fluctuations in the proportions of private vs. public company ownership could distort the accuracy of this measure. In markets with low or fluctuating proportions of private vs. public company ownership, this latter argument may be a valid criticism; however, in the U.S. market, with a fairly consistently high percentage of pubic versus private companies, this is not a significant factor. Therefore, the primary theoretical reason behind not using the MV/GDP measure appears to be a concern that the factor lacks proper theoretical justification. Many of these arguments apply to Tobin’s q, whose popularity exceeds MV/GDP, but lags PE/10. Depending on the time period used, and even on the version of government accounting used to define GDP and the overall book market value of the equity market (the denominator in Tobin’s q), the relative effectiveness of the two measures varies; however, MV/GDP is used here, as it is most suitability to support the justification of “macro-earnings negativity.”
2.1. Verifying a Variable’s Theoretical Fundamentals
Our response to concerns that MV/GDP lacks theoretical justification begins with a comparison between the theoretical justifications of PE10 and MV/GDP. Our findings will both reject the theoretical support of P/E10 and ironically conclude-due to macro-earnings negativity-that, because it is not an earnings based measure, MV/GDP is a better indicator of true future earnings and has, therefore, stronger theoretical justification. Section 3 first explains how P/E10, proposed as a measure to value the entire market, was founded on the principles of evaluating individual equities. We next expose a conflict in valuing the overall market on the same principles of valuing individual equities by revealing how the earnings processes of individual companies differ significantly from those of the overall market. Evidence is then presented which suggests that PE/10 largely obtains its predictive power (relative to the one-year P/E) from the strengths of the MV/GDP ratio, and then reveals how and why MV/GDP is a better measure, both theoretically and statistically, of recurring earnings. Kalecki’s profit equation is introduced in this argument, with the purpose of, first, identifying the sources of macro earnings and revealing additional differences between macro and micro earnings. Second, we reveal how these sources of macro earnings experience non-fundamental and non-sustainable fluctuations, and then explain the importance of adjusting for these fluctuations to derive a more fundamental or permanent measure of earnings. An adjustment process is then introduced which normalizes the factors in Kalecki’s identity based on historical averages. These “normalized” earnings, calculated as a basis of GDP, are shown to equate to MV/GDP, therefore indicating that MV/GDP is a better theoretical “P/E” measure. With the use of out- of-sample testing, we then show that MV/GDP has, from a statistical perspective, also been most accurate at forecasting future real 10-year market returns. The section concludes by addressing the causality issue in Kalecki’s equation.
Using historical data, we then explain, clarify and confirm the theoretical support presented earlier. Section 4 concludes with a comparison of MV/GDP to the price/sales metric as well as introduces further important implications which, though unnecessary for the composite model, are informative. Likewise, statistics showing the recent record imbalances of global debt levels indicate that our conclusions are also applicable to the other global developed equity markets.
2.2. Development of a Composite Model
Section 5 introduces the development of a composite model to forecast future real 10-year equity returns. Though not original, the use of a composite model is uncommon, despite an abundance of individual forecasting variables. The model is based on the MV/GDP metric, and is improved significantly with a unique inclusion of a demographic metric. Further improvements come from the addition of both newly-developed and prior-researched variables. Historical evidence suggests that the resulting model’s ability to forecast future real equity returns is significantly better than any model we are aware of.
This research not only provides a better measure for forecasting equity returns, but, as it does so, clarifies the nature of macro earnings and their relationship with public and private debt, corporate investments, dividends, and other economic variables. This understanding of the relationship of macro earnings to economic variables, combined with the composite model’s forecast for real equity returns over the coming decade, indicates that the current economic environment is in a unique, if not dangerous, situation. Although this uniqueness makes forecasting more difficult, from a timeliness perspective it is worth noting that the model’s current forecast is calling for market returns over the next 10 years to be significantly lower than those of other models.
3. Evidence of Differences Between Micro and Macro Markets
John Campbell and Robert Shiller most prominently proposed the P/E10 measure in Valuation Ratios and the Long-Run Stock Market Outlook, in 1998, as well as in an update in 2001. Although their P/E10 measure, which they named CAPE, did well at forecasting a sub-par market performance over the following decade, our research into earnings factors on a market-wide (macro) level reveals a conflict with associating the significance of individual corporate (micro) earnings with the significance of macro earnings, and explains how the theoretical justification behind P/E10’s macro (overall equity market) based earnings is mistakenly founded on micro (individual equity) theory.
In valuing the market, it has been common, historically, to apply the same methods used in valuing individual securities. Campbell and Shiller’s development of P/E10 is an example of this. In “Valuation Ratios and the Long-Run Stock Market Outlook: An Update” (2001) Campbell and Shiller wrote:
“A clearer picture of stock market variation emerges if one averages earnings over several years. Benjamin Graham and David Dodd, in their now famous 1934 textbook Security Analysis, said that for purposes of examining valuation ratios, one should use an average of earnings of “not less than five years, preferably seven or ten years” (p. 452). Following their advice we smooth earnings by taking an average of real earnings over the past ten years” (p. 6-7).
This quote from Graham and Dodd was taken from their analysis of individual securities; however, Cambell and Shiller are using it to justify their approach to the overall market, and functions as theoretical justification of their P/E10 measure. Interestingly, years earlier, Campbell and Shiller (1988b) had noted that the thirty-year moving average earnings-price ratio performed much better than the 10-year measure at forecasting future equity market returns. The 30-year measure explained 57% of the variance of ten- year real forward returns; however, the ten-year moving average ratio only explained 40% of the variance. The obvious inclination would be to use the ratio with the higher predictive ability; however, without theoretical justification, models lack validity, and are unlikely to be any better predictors of future events than spurious indicators, such as which league wins the Super Bowl8 (this topic of spurious relationships is covered again in the discussion of the MV/GDP ratio). There is no theoretical justification for a measure having 30 years of earnings; however, Campbell and Shiller thought they found theoretical justification for the P/E10 measure in Graham and Dodd’s methodology for valuing individual securities. Therefore, without questioning the theoretical differences between earnings of an individual company and earnings of the overall market, Campbell and Shiller’s model—along with most of the investment community— values the overall market with methods used to value individual securities. However, the following perspectives reveal that there are very different, even conflicting, fundamental differences between micro and macro earnings.
3.1. Earnings Impacts from a Transactions Perspective
One may think that the impact of a single transaction on an individual company would be comparable to the impact of the same transaction upon all the companies in the market. However, such is not the case, and evidence suggests that the earnings process of corporations from a macro perspective is very different, and in many ways even oppositional to, the earnings process of an individual company. For example: If an individual company were to reduce redundant staff by 10%, that company’s costs would generally fall by the amount of staff cuts, and earnings may well increase by the amount of staff cuts. However, if the whole market were to cut staff by 10%, such a cut would also result in a comparable cut to personal incomes and, as a result, to a comparable reduction to overall (macro) spending for the economy and, therefore, to revenues for corporations. Therefore, if the market in general were to cut staff by 10%, such cuts would unlikely benefit earnings of the overall market, or at least the overall earnings gains per company would be significantly smaller. Similarly, if an individual company were to make an investment in a long-term asset, such an investment would have little to no near-term impact on earnings, and have a comparable negative impact on cash flow. However, if all companies were to make a similarly sized investment in a long-term asset, such investments would generally lead to similar increases in near- term earnings of all companies and have little significant impact on cash flow. These examples show that the same activities applied to both micro and macro situations can produce dramatically different, and even negative, results.
3.2. Earnings Impacts from an Accounting Perspective
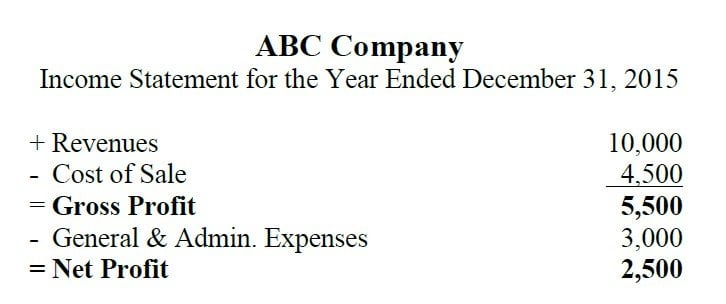
The process of deriving the earnings of an individual company is well known, and is described in the following simplified income statement:
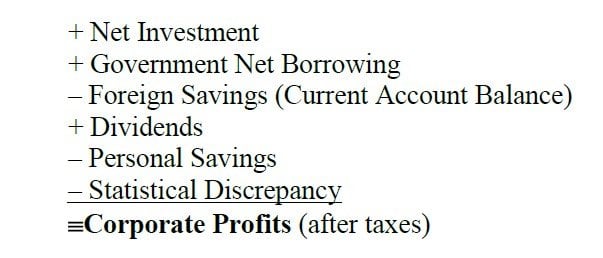
However, the derivation of earnings on the macro level is very different. Kalecki’s profit equation, described in more detail later, recognizes the following identity:
Download the full article here by Stephen Jones, via SSRN


