The Industrial sector ranked fourth out of ten sectors in our 3Q17 Style Rankings for ETFs and Mutual Funds, down from a second-place ranking in our 2Q17 report. The sector receives a Neutral rating based on an aggregation of ratings of 22 ETFs and 20 mutual funds focused on the Industrials sector.
Our Robo-Analyst technology helps investors navigate the Industrials sector by sifting through the holdings of all Industrials sector ETFs and mutual funds, which hold anywhere from 20 to 343 stocks. In the process, we uncovered a particularly attractive ETF that traditional, backward-looking fund research is likely to overlook.
U.S. Global Jets ETF (JETS) is our second-ranked Industrials sector ETF for 3Q17 and is poised to stay atop the rankings based on holdings quality and a favorable macro backdrop for the airline industry. JETS receives our Very Attractive fund rating and is also this week’s Long Idea.
Airline Sector Tailwinds Remain Favorable
The major airlines have emerged from over a decade of consolidation, restructuring and bankruptcy as more efficient operators, both from a profitability and capital perspective. The industry has become better at consistently filling seats by balancing aircraft fleets and routes with demand and has also invested in improving the customer experience (e.g. new aircraft, terminal upgrades etc.). As a result, the airline’s “load factor” (passenger miles/available seat miles) is at all-time highs. The industry has accomplished this while still managing to deliver its product to consumers at a lower inflation-adjusted cost than 20 years ago.
The NYSE Arca Airline Index recently reached levels last seen before 9/11 and is up 30% over the past year and 5% YTD compared to 14% and 10%, respectively, for the S&P 500. While airline stocks have cooled a bit in 2017 relative to the sector’s red-hot 2016 performance, the sector’s fundamental trajectory remains positive and its risk/reward attractive.
JETS Holdings Analysis Reveals Favorable Allocations
The only justification for any ETF to charge higher fees than its passively managed ETF benchmark is “active” management that leads to out-performance. While JETS is technically classified as a “passive” Industrials sector ETF, we consider its concentrated Airline sub-sector focus to be an active management decision.
A fund is most likely to outperform if it has higher quality holdings than its benchmark. To make a determination on holdings quality, we leverage our Robo-Analyst technology to drill down to the individual stock level of every fund. This capability empowers our unique holdings based ETF and mutual fund rating methodology.
Figure 1: U.S. Global Jets ETF (JETS) Asset Allocation
Sources: New Constructs, LLC and company filings
U.S. Global Jets ETF (JETS) is a concentrated fund with 34 holdings and the top-10 holdings representing 70% of total assets. Geographically, the fund’s holdings are 80% U.S. and 20% international. There is no style drift as 99% of holdings are in the Industrials sector and directly exposed to air travel trends.
Per Figure 1, JETS allocates 36% of its assets to Attractive-or-better rated stocks compared to just 11% for the benchmark Industrial Select Sector SPDR Fund (XLI). Further, exposure to Unattractive-or-worse rated stocks is much lower for JETS (11% of assets) than for XLI (33% of assets). The fund’s top 10 holdings are 90% Neutral-or-better rated while 60% receive an Attractive-or-better rating. Only one stock in the top-10, or just 3% of assets, receives an Unattractive -or-worse rating.
Given this favorable combination of Attractive vs. Unattractive allocations relative to the XLI benchmark, JETS appears well positioned to capture upside potential while minimizing downside risk. Compared to the average ETF or mutual fund, U.S. Global Jets ETF has a better chance of generating the outperformance required to justify its management fees above the cost of the XLI benchmark.
Second Largest Holding Recently Upgraded to Attractive
JETS’ second largest holding is Delta Airlines (DAL), which comprises 12% of assets. Our Robo-Analyst’s most recent 10-Q analysis (7/14/17) resulted in a more favorable discounted cash flow (DCF) forecast. Over subsequent weeks, DAL stock sold off roughly 8%, which lowered the implied market expectations baked into the stock price. DAL was subsequently upgraded to Attractive from Neutral on 7/24/17 based on our Stock Rating Methodology.
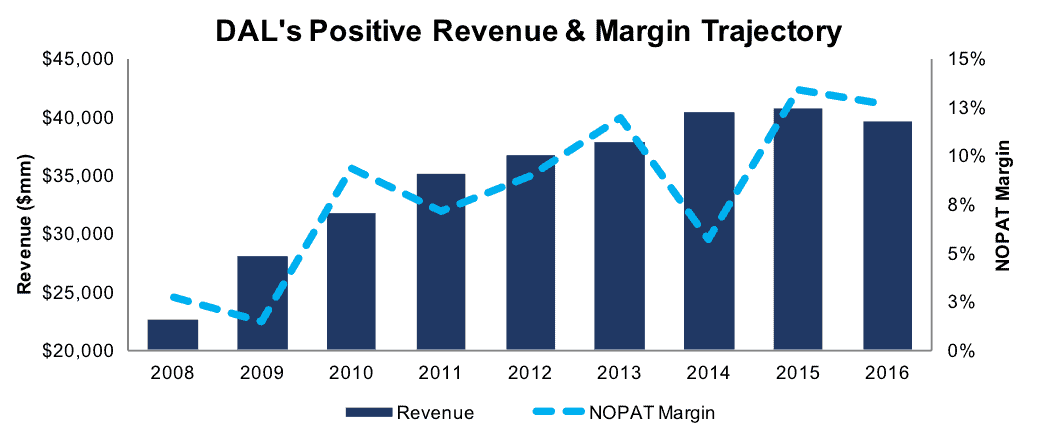
Per Figure 2, DAL’s total revenue has grown by 7% compounded annually since 2008. Over the same period, after-tax profits (NOPAT) have increased 26% compounded annually to $4.2 billion. Strong NOPAT growth was aided by an increase in NOPAT margin to 11% TTM from 3% in 2008. Balance sheet efficiency has also improved, as invested capital turns (revenue/invested capital) have increased to 0.7 TTM from 0.4 in 2008. These improvements in NOPAT margin and balance sheet efficiency combined to increase return on invested capital (ROIC) to 7% TTM from 1% in 2008.
Figure 2: DAL’s Impressive Post-Recession Recovery
Sources: New Constructs, LLC and company filings.
At its current price of $51/share, DAL has a price-to-economic book value (PEBV) ratio of 1.0 compared to 2.3 for the S&P 500. This ratio means the market expects S&P 500 profits to more than double from current levels while DAL profits are expected to remain stagnant. These divergent expectations seem too pessimistic considering DAL’s improved fundamentals, competitive position and track record of profit growth.
If DAL can grow NOPAT just 1% compounded annually over the next decade, the stock is worth $66/share today – 29% upside. For reference, this scenario assumes DAL maintains its current (TTM) NOPAT margin of 11% and grows revenue 3% compounded annually for the next ten years.
JETS Represents “Value” in the Industrials Sector
True value investing still works despite the proliferation of passive strategies. JETS is a good example of how to utilize a relatively low-cost, passively-managed ETF to make an “active” investment decision. The ETF’s sub-sector focus does an effective job allocating capital to higher-quality companies with lower relative valuations, the cornerstone of the value investing discipline. This observation is based on our analysis of JETS at the stock level, where we analyze earnings quality, true profitability and the market-implied cash flow expectations embedded in stock prices.
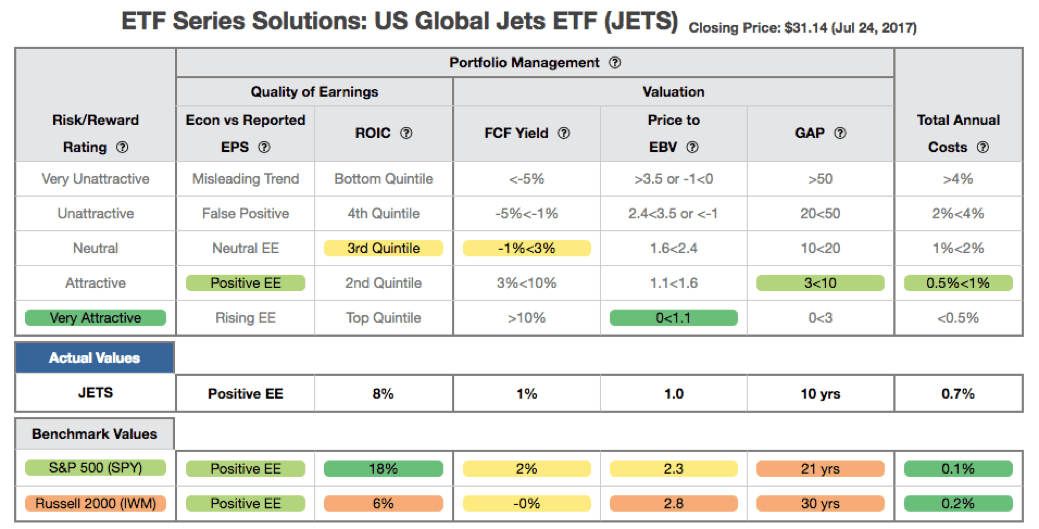
Figure 3 contains our detailed fund rating for U.S. Global Jets ETF (JETS), which includes each of the criteria we use to rate all funds under coverage. These criteria are very similar to our Stock Rating Methodology, because the performance of a fund’s holdings equals the performance of a fund. The results of this analysis reveal important information for investors in JETS.
Figure 3: U.S. Global Jets ETF (JETS) Rating Breakdown
Sources: New Constructs, LLC and company filings
The return on invested capital (ROIC) for JETS’ holdings is 8%, which is comparable to 9% for the holdings of the Industrial Select Sector SPDR Fund (XLI) and well above the average of 5% for 405 Industrials stocks under coverage. The 1% free cash flow (FCF) yield of JETS’s holdings is slightly below the 2% offered by XLI and the average Industrials stock due to the airline industry’s above average capital expenditures.
The price to economic book value (PEBV) ratio for JETS is just 1.0 compared to 2.2 for XLI. This ratio means the market expects the profits of XLI stocks to more than double from current levels while JETS’ stocks are priced as if they have no profit growth potential.
Lastly, our discounted cash flow analysis of fund holdings reveals a market implied growth appreciation period (GAP) of ten years for JETS compared to 22 years for the XLI. In other words, XLI constituents have to grow economic earnings over twice as long as companies held by JETS to justify their current stock prices.
JETS Should Earn Its Relatively Modest Fees
With total annual costs (TAC) of 0.66%, JETS expenses are lower than 60% of Industrials sector ETFs and mutual funds under coverage. Coupled with its quality holdings, below average fees make JETS more attractive. For comparison, the average TAC of all Industrials sector ETF and mutual funds is 1.31%, the weighted average is 0.59%, and the ETF benchmark (XLI) has a TAC of 0.15%. JETS expense ratio closely approximates the true costs of investing in the fund as its 0.66% TAC is only 0.06% higher than its stated expense ratio.
While we fully recognize that past performance is no guarantee of future results, JETS concentrated allocation of capital to the airline industry has led to outperformance since inception (4/30/15). Further, the amount of outperformance required by the JETS management fees (above the XLI benchmark) is a minimal hurdle that has been surpassed by the JETS since inception. Based on the cumulative returns (since inception) reflected in Figure 4, JETS has beaten its XLI benchmark by 3% annually and the SPY by 4% annually
Figure 4: U.S. Global Jets ETF vs. XLI & SPY

Sources: New Constructs, LLC and company filings.
The Importance of Holdings Based Fund Analysis
The analysis above shows that investors have a wide range of options when looking to invest in Industrials sector ETFs and mutual funds. There is middle ground between a high-cost, actively managed mutual fund and the lowest cost passive ETF option. U.S. Global Jets ETF (JETS) is among a limited group of passively-managed ETFs that justifies its fees (above the XLI benchmark) through focused asset allocation.
Diligence is required to make such informed investment decisions, and truly “passive” investors analyzing funds solely on fees are exposing themselves to unnecessary risks. Each quarter we rank the 10 sectors in our Sector Ratings for ETF & Mutual Funds and the 12 investment styles in our Style Ratings For ETFs & Mutual Funds report. This analysis allows us to find funds that investors using traditional fund research may overlook, such as U.S. Global Jets ETF.
This article originally published on July 26, 2017.
Disclosure: David Trainer, Kenneth James, and Kyle Guske II receive no compensation to write about any specific stock, sector, style, or theme.
Article by Kenneth James, New Constructs


