
Logica Capital commentary for the month ended May 31, 2023.
Summary
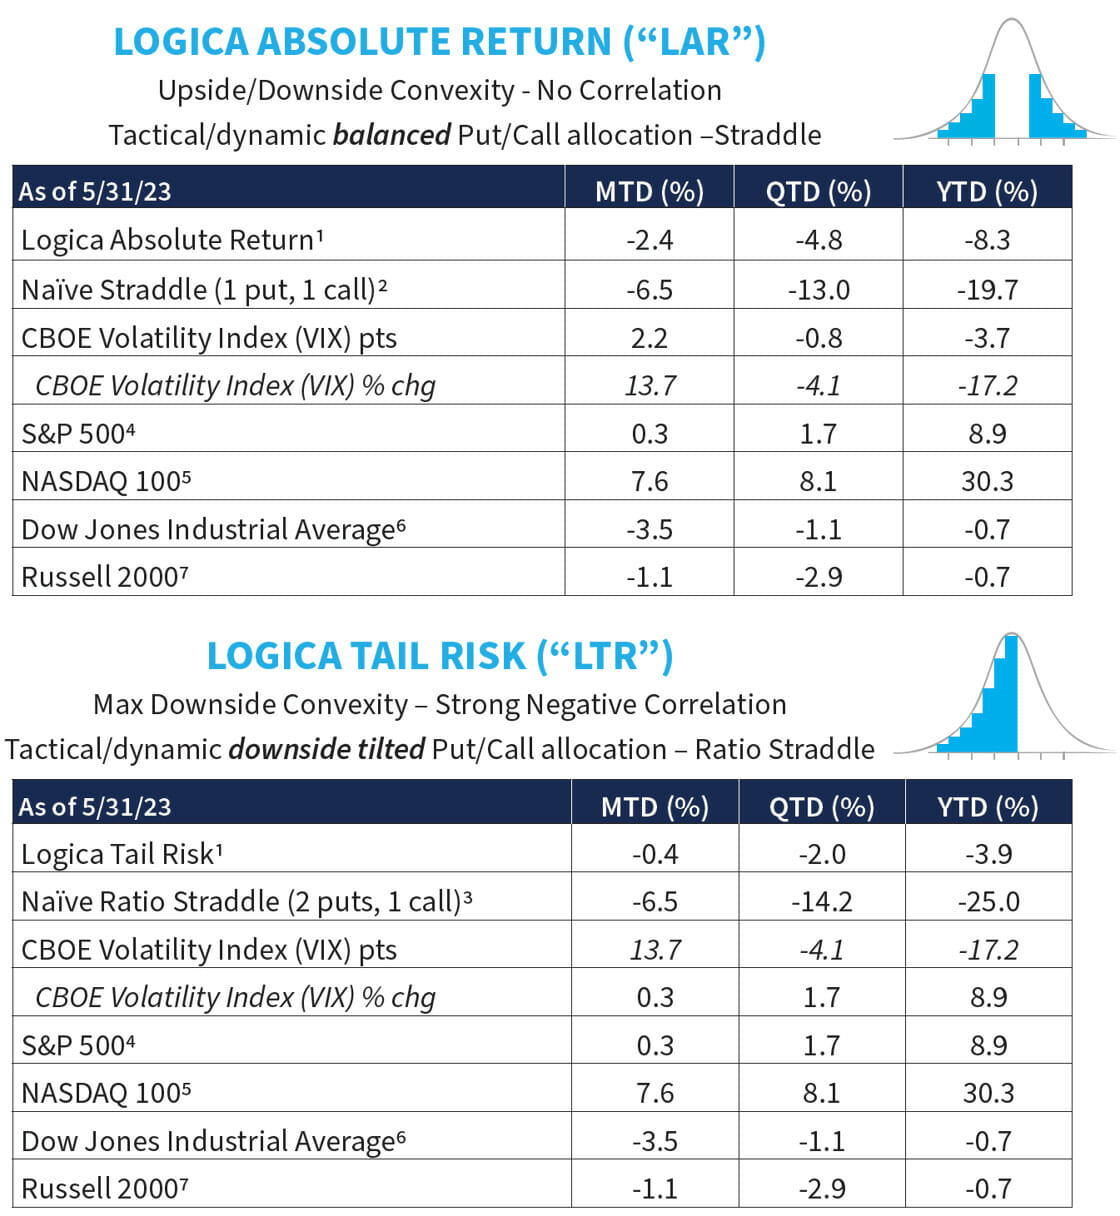
The story of May continues the story of 2023: thin breadth and extreme dispersion among stocks/indices (the Nasdaq 100 Index [NDX] gained +7.6%, while the Dow Jones declined -3.5% in May). In fact, a small number of large-cap tech are responsible for the great majority of the S&P 500’s gain on the year.
We should note that this isn’t entirely atypical, as the market has seen long periods of such behavior throughout its history. We also note that “at-the-money” implied volatility has been punished YTD, seeing a much more dramatic decline than the VIX (VOLI -6.59 pts YTD vs VIX -3.73 pts YTD).
1) Returns are net of fees and represent the returns of Logica Absolute Return Fund, LP and Logica Tail Risk Fund, LP, respectively. Past performance is not indicative of future results.
2) Naïve Straddle Return: a 1.5 month out, S&P 500 at-the-money put and call bought on the final trading day of prior month and sold on the final trading day of current month. This return on premium is divided by a factor of 6 to be comparable to Logica’s typical AUM-to-premium ratio. For illustration purposes only.
3) Naïve Ratio Straddle Return: a 1.5 month out, S&P 500 at-the-money put and at-the-money call (divided by 2) bought on the final trading day of prior month and sold on the final trading day of current month. This return on premium is divided by a factor of 6 to be comparable to Logica’s typical AUM-to-premium ratio. For illustration purposes only.
4) S&P 500. The index measures the performance of the large-cap segment of the U.S. market. Considered to be a proxy of the U.S. equity market, the index is composed of 500+ constituent companies.
5) The Nasdaq-100 is a stock market index made up of 101 equity securities issued by 100 of the largest non-financial companies listed on the Nasdaq stock exchange.
6) The Dow Jones Industrial Average is a stock market index of 30 prominent companies listed on stock exchanges in the United States.
7) The Russell 2000 Index is a small-cap U.S. stock market index that makes up the smallest 2,000 stocks in the Russell 3000 Index.
The Portfolio: Looking Inside
Commentary & Portfolio Return Attribution
“I would say that financial markets are very inefficient, and capable of extremes of being completely dysfunctional.”
– Jeremy Grantham
As we noted in our summary, thin breadth and extreme factor/index dispersion continued in May, and as such, and despite some rotation toward the favored sector and reduced basis exposure, our strategies still suffered in the face of this narrow market headwind. For a graphical look at the extent of the dispersion/dislocation, we return to a chart we’ve shared a few times over the past few years:
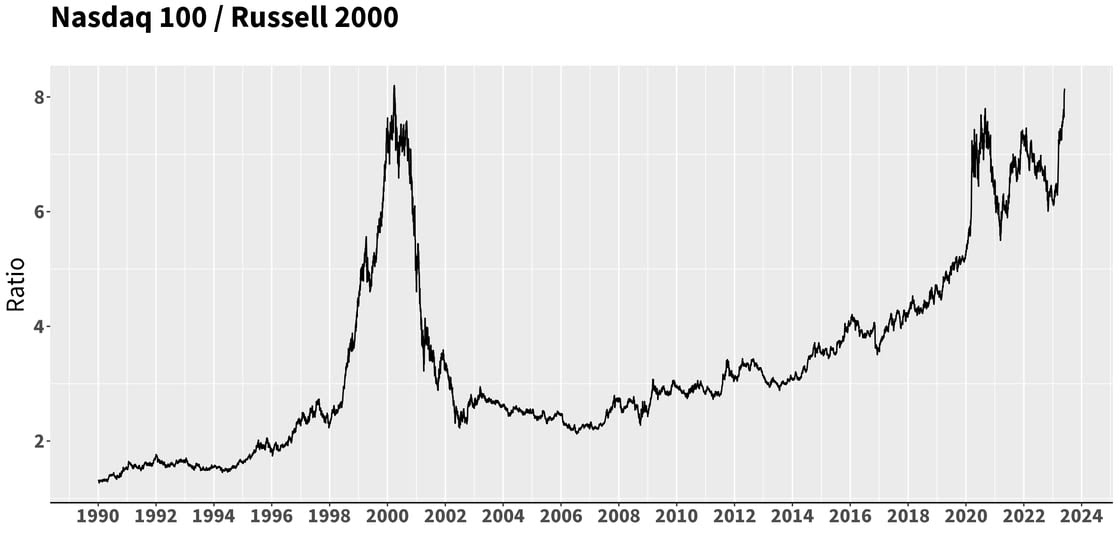
We see that the Nasdaq 100 Index, relative to the Russell 2000 Index, is at heights not seen in the past 30+ years (even higher than at the peak of the Dot Com bubble!). In May, this stretched relationship was further buoyed by an ecstatic market reaction to NVDA earnings (+36.3% MTD).
And while we are thrilled that our models identified NVDA and inched more into the semiconductor sector since March (from our March letter: “we have just started to see our model slowly increasing positioning in Semiconductors and Communications and purchased some calls on the Semiconductor index”), we still did not have enough concentration in these, alongside other exposure to industrials, to meaningfully change our path.
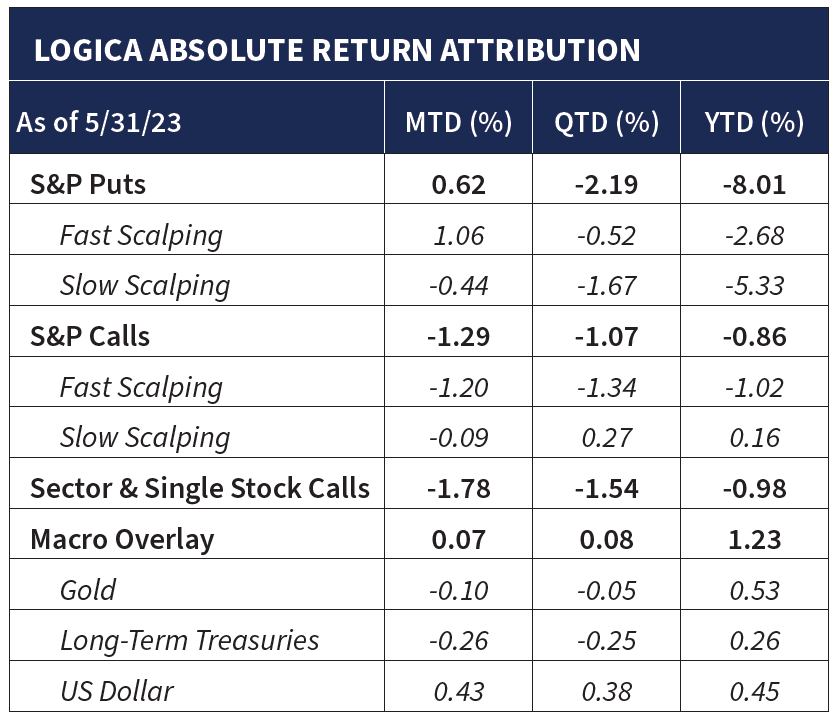
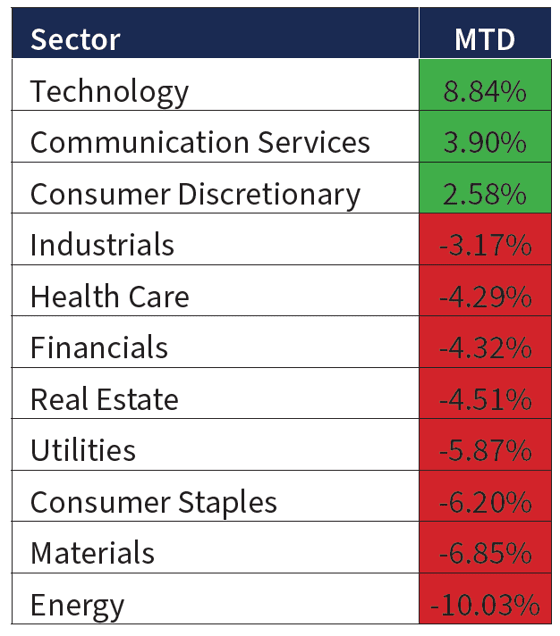
It of course helped a little bit, just not substantially. As we’ve mentioned in prior letters, our Sector & Single Stock Calls bucket has more diversified exposures, and so was hurt from the lagging performance of various other sectors in May and 2023 YTD. To quantify the extent, here’s a look at the incredible sector dispersion in May:
Extraordinary Sector Performance Dispersion in May
One might view our good picking in the face of our portfolio’s total return and ask the question: if the model identified Semiconductors, why not go “all-in” or at the very least “more in”. More broadly, if one has a historically reliable stock selection methodology, shouldn’t one lean into those picks with gusto?
But the other side of the coin also rings true – concentration can slaughter. Over our extensive years of trading markets, and vast amounts of rigorous empirical studies focused on this very issue, we’ve concluded that the boundaries of concentration vs. diversification still lean toward diversification. From a mathematical perspective, once you find an edge – just rinse and repeat. Don’t soak in it.
Yes, there are many practitioners out there who run concentrated portfolios, and sure, there’s a place for that in the world. But given the goals and objectives of Logica, where first-and-foremost we must avoid large drawdowns of our own, while targeting low to negative equity market correlation as well as upside convexity during broader market turmoil, there just is no place for highly concentrated bets that may detract from those goals.
And while it doesn’t appear helpful, our rotation into Semiconductors still helped us with NVDA’s explosive May and saved us from further losses in Energy, Consumer Staples, and Industrials over the past few months.
“The progress of the human race is affected by the operation of two forces which correspond in most respects to what in physics are often called the centripetal and centrifugal forces. These are the forces of convergence and divergence, the one tending to concentration of powers and properties, and the other to their separateness or the independence of parts.”
– Joshua K. Ingalls
Stepping out with a wider lens, when we get into the question of how long such sector dispersion tends to last or how wide they tend to drift, historical testing uncovers two somewhat contradictory phenomena: momentum tends to continue longer than we expect, and concurrently, extremes tend to revert.
The toughest part, therefore, is timing the momentum-to-mean reversion inflection point. At Logica, many years of rigorous study has gone into the managing of this inflection point, i.e. building a portfolio that is the most robust over the longest and most variant runs of market behaviors, while of course, always maintaining a large holding in S&P downside options.
In fact, having seen the positive results of this balancing process over time, we find this to be its own unique source of return: or “Portfolio Construction Alpha”. Simply said, the same sub-strategies run at a common optimization – such as periodic mean-variance weighting – would generate inferior results.
Or said differently, our process of weighting each position, and each module and/or sub-strategy, is quantitatively optimized to infuse complementary dynamics that seek to maintain balance through the tails of their return distributions (i.e. the highest levels of market confusion), inclusive of the battle of convergence and divergence, and their sometimes violent inflection points.
While a portfolio can certainly be designed to do better given certain regimes (for example, quiet markets, momentum markets, or range-bound markets), we believe that our quintessential goal of holding S&P downside optionality cannot be overrun by large bets on either convergence or divergence.
High level, keeping all else as stable as possible rings even louder when the penultimate objective is a completely different one, and complex in its own right – namely, maintaining a long volatility position at all times. In other words, the bet we are taking is one of long volatility, and so are already assuming the risk of anomalous volatility behavior.
But we accept this risk, for the obvious reward we seek during market turmoil. Accordingly, any other bet in the portfolio, created to pay for the long volatility risk we like, and are willing to take, should minimize any other potential risk. To this end, we seek broader portfolio stability across upside regimes.
For some outside color on the current dislocation in the market, we turn to an article from Axios.com:
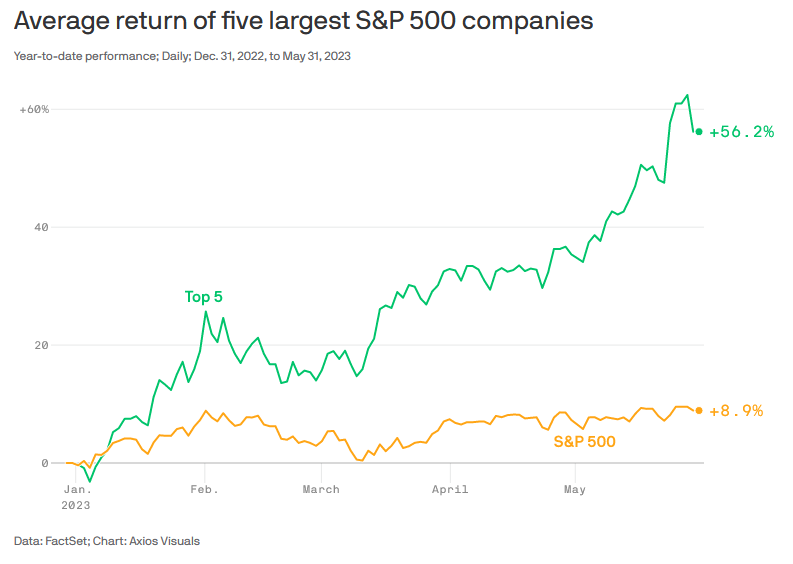
A hypertrophied tech sector is carrying the stock market once again. The big picture: The S&P 500 is up 8.9% so far in 2023, or 9.7% including dividends. But the lion’s share of that increase is due to the surging prices of a few of the largest companies.
State of play: The big five that are responsible for the vast majority of the stock market’s 2023 gains are Apple (up 36% this year), Microsoft (37%), Alphabet (39%), Amazon (44%), and current stock market darling Nvidia, which has surged 159% on AI-related excitement.
Without them, the overall market (including dividend payments) would be up just 1.5% this year, according to data provided by Howard Silverblatt, senior index analyst at S&P Dow Jones Indices.
All that said, and standing above all these points and observations, is widely accepted understanding that the healthiest of markets tend to come with the broadest based rallies. Thin breadth is simply more fragile, while sustainable bull markets see fuller participation across the board. Thankfully, we’ve seen a nice bounce across the rest of the board in the early days of June. So, while still early, there are some signs pointing to a more balanced road ahead.
Looking elsewhere in the portfolio, we see that our S&P Calls suffered in May and have failed to provide proportionate upside YTD despite the sizable gain in the S&P 500 itself. While it would seem counterintuitive that the S&P underlying would gain, but S&P upside Call options would not, the dramatic drop in at-the-money (“ATM”) S&P 500 implied volatility in May (and YTD) more than offset the gains in the underlying.
That said, ATM implied vol is now very cheap, even looking at far wider historical frames. When IV starts from such a low point, without much room to crush – its asymmetry is far more attractive, providing materially greater upside with much less expectation of continuing decline.
The Volatility Market: Looking Outside
“I remixed a remix, and now it’s back to normal.”
– Mitch Hedberg
As mentioned in our summary, another major theme this year has been the striking divergence of option performance across the “moneyness” chain (or change in skew). While skew was far out of whack in 2022, and out-of-the-money (“OTM”) got punished, this year has seen a powerful divergence back to normal, with underperformance of at-the-money (“ATM”) implied volatility versus that of OTM.
The VIX, which encapsulates the whole moneyness chain, can be used as a decent proxy in our evaluation of OTM vs ATM, as compared to the VOLI index, which isolates the ATM strikes in its calculation. As we’ve noted separately above, VIX has drawn down -3.7 points YTD, while VOLI has deteriorated a remarkable -6.6 points, or almost double.
And knowing that VIX includes ATM in its weighted average, the actual performance difference between ATM and OTM is even more severe. All that said, in a big picture view, 2022 extended one way, and YTD 2023 just did what it needed to “get back” to normal. The good news, then, is that skew is now in long term “normal” territory.
To be clear, our strategy is hardly exposed to skew, albeit the VIX (by which we are sometimes benchmarked to) certainly is. Accordingly, as a VIX move is most often comprised of both an IV move, alongside a SKEW move, the effective “pure” VOL behavior is somewhat masked. And in May, that combined move was larger than usual, with Vol dropping fairly heavily, but Skew gaining fairly nicely, and hence “lifting” the VIX.
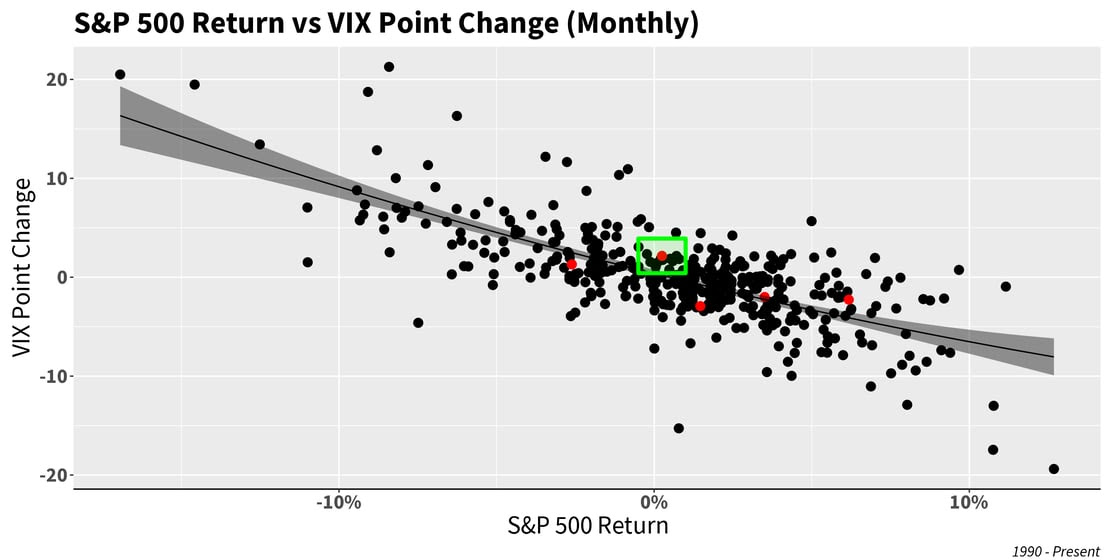
Stepping outside of skew, we note that the VIX point change was also in the “normal” range, about as expected for a roughly flat S&P 500 on the month. One could suggest VIX was minorly elevated on the month (sitting just above the regression curve) but given a small move in the S&P, an above/below residual is well within the expected error off a perfectly fit curve:
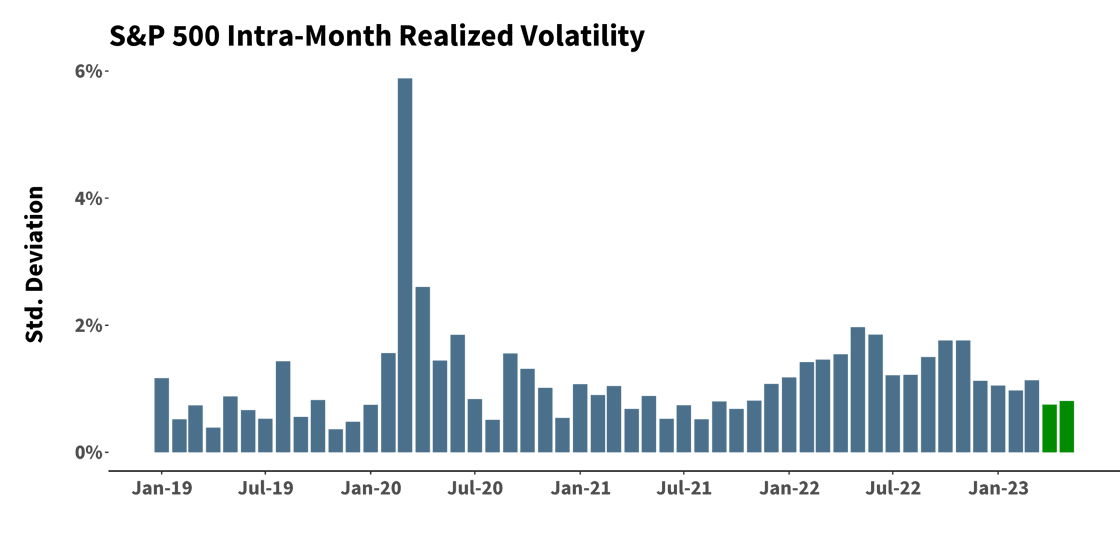
Finally, realized volatility in May continued to remain low, though still slightly elevated from the 2019 and 2021 markets that each clocked a few all-time lows:
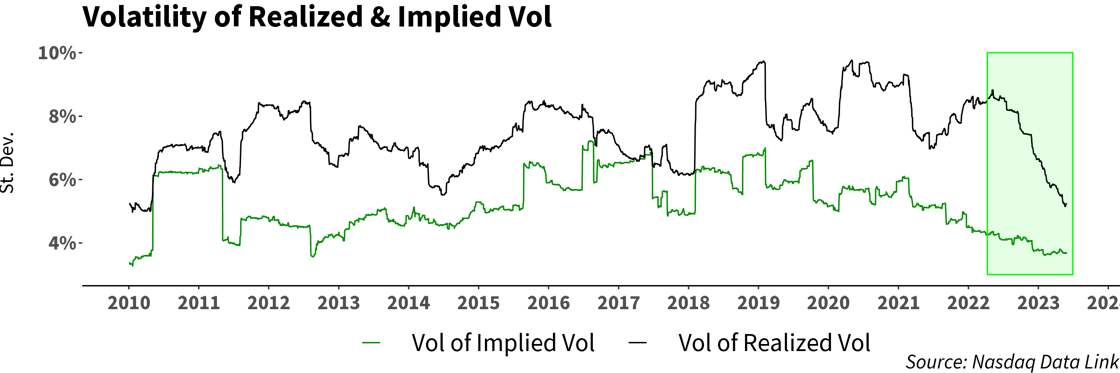
Relatedly, in observing Vol-of-Vol, we note that the vol of realized vol has been falling at a far more dramatic rate than the vol of implied vol. We have mentioned this phenomenon in prior letters, and May just continued this trend. This speaks, once again, to the increasingly “fair” pricing in volatility, and at this point, approaching attractive levels. Indeed, as seen in the chart below, vol of IV and vol of realized vol are now at levels last seen in 2010.
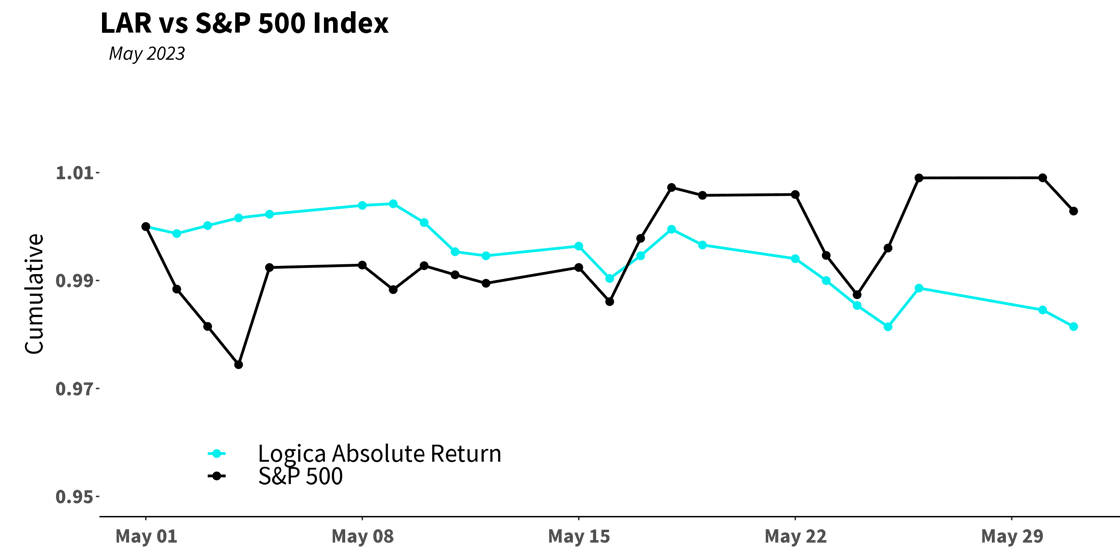
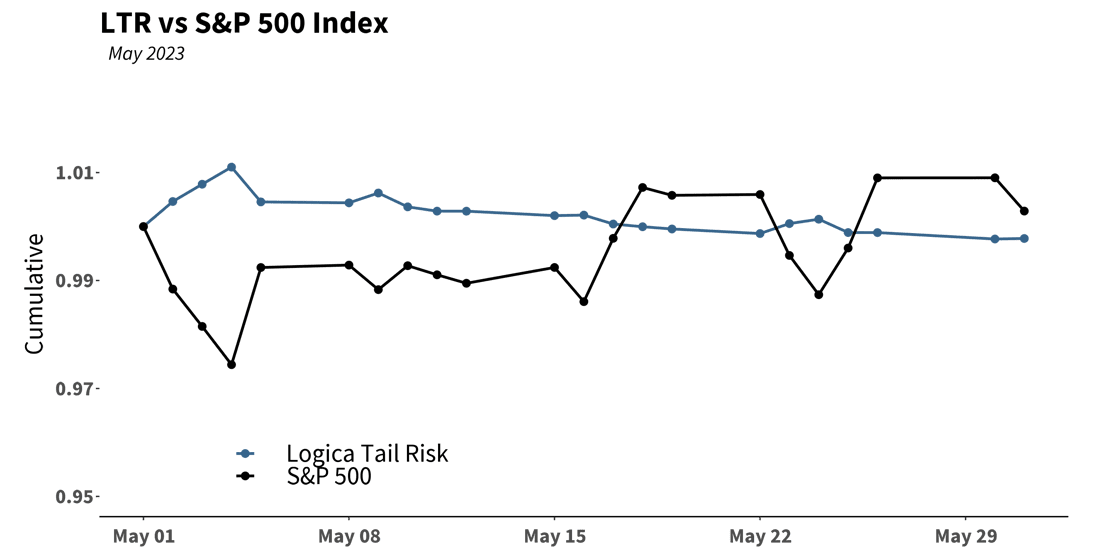
Finally, taking a closer look at the daily movement of our strategies for the month of May, we can see that both strategies deteriorated over the course of the month in the face of the large – and more so, steady — dispersion amongst sectors/indices, as discussed above:
Follow Wayne on Twitter @WayneHimelsein


