Article by RCM Alternatives
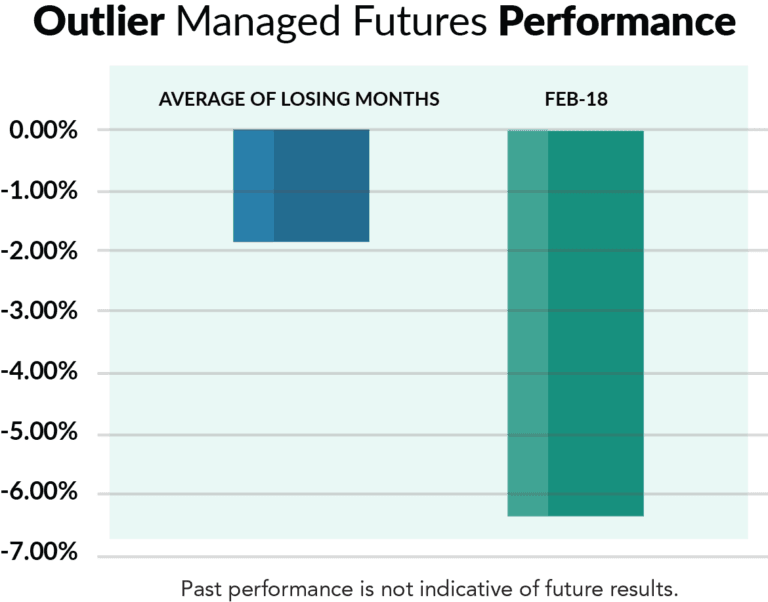
How and why did Managed Futures take such a big hit in February as volatility spiked is the talk of the town, amid Bloomberg articles and managers sending out their Feb numbers? We covered whether this positive correlation to stocks is the new normal (part 1), but that all begs the question – why were the losses larger than normal?
[REITs]Check out our H2 hedge fund letters here.
Well, the simple answer is that it was the spike in volatility that caused the oversized losses, but it’s not that simple. The better answer is that it was the low volatility that caused the oversized losses. As we talked about in length in our 2018 Managed Futures Outlook, Futures market volatility (as we gauge it) was at an all-time low in 2017 with 96% of markets experiencing a contraction in their average range (the difference between their daily high and low price).

Why does this matter? Well, systematic programs typically risk weight their positions across different markets to insure a winning trade in Crude Oil isn’t 10x the profit potential as a winning trade in Cotton. They are after the market movement, not the market itself. So to normalize the risk and potential reward, programs typically measure each market’s volatility and then size their positions accordingly – with say 2 Crude Oil contracts expected to risk and make as much as 20 EuroDollar contracts.
The rub is… when volatility is so low, across nearly every asset class – systematic trading models tend to put on larger and larger position sizes to normalize the risk and profit potential in relation to other markets and other time periods (ie – when markets are moving more normally). For instance, if we assume a $100 Million trading program which is set up to risk 50bps per trade (0.50%) in each market, and uses the above mentioned average true range (2017 calendar year) as a risk proxy (the amount the market is likely to move each day); the trading program would be doing 410 contracts in Crude Oil, 623 contracts in the e-mini S&P, and 995 contracts in the 10yr note futures to be roughly risking the same amount per market and market sector.
Thing is, those levels have been climbing steadily higher over the past few years as volatility as moved steadily lower. Just look at the graphs below showing how our fictional $100 million manager would be doing roughly 1.5 times the number of contracts they were just two years ago to maintain their risk and return targets. This type of modeling probably wasn’t meant to create the scenario where it’s betting more, portfolio wide, during a low vol environment – and there’s definitely managers out there with advanced volatility filters which cap the amount of contracts (risk) that the model is allowed to put on even if the volatility reading is lower and lower – knowing full well that it likely always won’t be lower. But this is a complication of volatility falling significantly across asset classes, with the symptoms being a removal of one of systematic programs chief risk defenses – market diversification. It’s easy to understand the dangers of all markets moving together to a risk system based on market diversification, but a little more nuanced to see that similar volatility movement across market sectors can also threaten the ability of market diversification to work.

Of course, this isn’t always a bad thing – adding contracts during a low volatility environment. It’s also the setup for when systematic models turn in some of their best performances. Like in January; like in 2014 in Crude Oil. So, why was February worse than usual? You had higher position sizes across multiple markets due to the record low volatility across nearly every market. And you had a big reversal in those markets – causing losses on those elevated positions. But the silver lining is that the thing these models generally bet on – expanding volatility – is happening. Meaning there will be more opportunity (even if they reduce position sizes slightly to normalize things for the new volatility levels). You can see this in the data, with both losses and gains higher in higher volatility times. The trick, of course, is booking more gains than losses.


