July 4th I’m Grateful to Live in America. Here’s Why.
By Frank Holmes
CEO and Chief Investment Officer
U.S. Global Investors
An important principle of our investment process at U.S. Global Investors is a belief that government policies are a precursor to change. As a result, we closely monitor the fiscal, monetary and other impactful governmental policies of the world’s largest countries, both in terms of economic stature and population. We’re always listening for the proverbial shot heard around the world. As we approach America’s Independence Day, this belief rings especially true.
In 1776 it was America’s reaction to oppressive government policy that led to the Declaration of Independence, unbinding the 13 colonies from England’s constraint and permitting them to prosper as their own entity, what would become the United States of America.

Today, it’s undeniable that some government policies are controversial, whether it’s America’s involvement in the Middle East or changes in health care policy. Despite widely differing personal views, I believe the people of this country can agree upon one thing: the fledgling government’s policies supporting democracy, life, liberty and the pursuit of happiness crafted over 200 years ago led America to where it is today. A world leader. A global success story based on equal opportunity, upward mobility and freedom to change. An economic powerhouse. A promoter of education and entrepreneurship. A protector of freedom for its people and others oppressed outside its borders.
America is an economic leader. The United States remains the world leader in GDP, followed closely by China. Energy is the latest example of American innovation spurring this economic growth. Over the last several years, a revolution in the oil industry has taken over in the U.S. We could be looking forward to decades of drilling as we watch the energy sector continue to accelerate, so far creating thousands of jobs for Americans and increasing tax revenues for their communities to reinvest in education and infrastructure.
Nobody predicted the gigantic growth in the energy sector would come out of the United States, but as you can see below, crude oil production has reached a 25-year high in America.

click to enlarge
It was American ingenuity, the thinkers and the doers, who worked towards the technology that made this possible. It was the determined minds who knew hydraulic fracturing would push this business forward. Freedom fuels creativity, risk taking and entrepreneurship. This is important to an evolving economy.
America is a thought leader. Government-supported and free public schools for all were established after the American Revolution and by the 1930s, 100 percent of children attended school. Today the U.S. has a reading literacy rate of 99 percent of the population over age 15. Though any parent will tell you our schools could do better, and vast discrepancies in quality exist, universal education is a fundamental right in America.
 |
An alarming number of countries still do not allow women the basic right to an education, something we take for granted. Some 60 percent of the 10 million children not in schools throughout developing nations, for example, are girls. Public education in this country has long been a springboard to success.
Did you know that the United States is home to the largest percentage of top universities in the world? The 2013-2014 Times Higher Education World Rankings show that out of the top 10 universities in the world, seven are in the United States. Many of the business and political leaders I’ve met from around the world choose to send their sons and daughters to study in America. Not only is education an important piece of our nation’s framework, so is the push for innovation and competition. Take a look at the IMD World Competitiveness Scoreboard for 2014: the United States comes in at number one. The rankings are based on how an economy manages the totality of its resources and competencies to increase the prosperity of its population, according to the IMD website.

click to enlarge
America is a benevolence leader. A portion of the United States’ budget is allocated to provide foreign aid across the world for humanitarian needs following war-related or natural disasters. Whether or not you believe in this portion of government spending, the United States continues to be a helping hand to weaker countries during times of crisis.
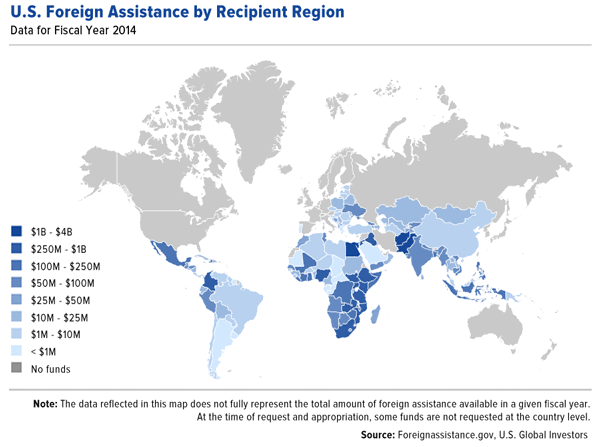
click to enlarge
The U.S. also ranks first in the 2013 World Giving Index, conducted by the Charities Aid Foundation (CAF), to study giving trends and charitable growth around the world. According to the CAF’s report, proportionally more Americans gave in some way than in any other country.
America is home to hundreds of charitable organizations, one of the most notable being the American Red Cross. According to its website, the American Red Cross is dedicated to preventing and alleviating human suffering in the face of emergencies by mobilizing the power of volunteers and the generosity of donors.
 |
America is a liberty leader. In 2013, Gallup asked people from 154 countries if they would like to migrate, and if so, where would they want to go? The United States was by far the most popular choice. Gallup estimates that around 140 million people would relocate here, if they could. The United Kingdom was the second-most popular, with 42 million people.
Why do America’s shores continue to beckon? One reason could be the opportunity to prosper in the United States. The U.S. is a country that stands for balance of power and rule of law, where political leaders are fairly elected. Political power is not ordained by birthright, taken by force or elected by farce. In America, everyone has an equal and fair chance. A chance to become wealthy, a chance to become educated, and a chance to worship who or what you want. The United States encourages and celebrates individual achievement, but is also a melting pot of cultures and ideas, where citizens feel a sense of belonging and communal pride to be Americans.
Although there is a lot to improve upon, these are just a few of the positive reflections I see in this country – things we must not take for granted, but instead continue expressing gratitude for. In order to keep up with our global competition and in order to keep the individual American dream alive, we must continue to strive ahead and push for smart government policies that support initiative and independence.
 |
Being a Tex-Can, born in Canada and now living in Texas, I’m privileged to celebrate both Canada Day and America’s Independence Day this week. I have been traveling the last few days with President Clinton and Canadian philanthropist Frank Giustra in Haiti and Colombia to help support the efforts of the Clinton Giustra Enterprise Partnership.
This group provides thousands of youth in communities around Cartagena, Colombia, new employment and education opportunities as well as training scholarships and job internships. I also met with Colombian President Juan Manuel Santos during our visit. This is a wonderful organization and a perfect example of how great leadership and ingenuity can spread far and wide, no matter the country you are from.

July 4th – Good News for Global Growth
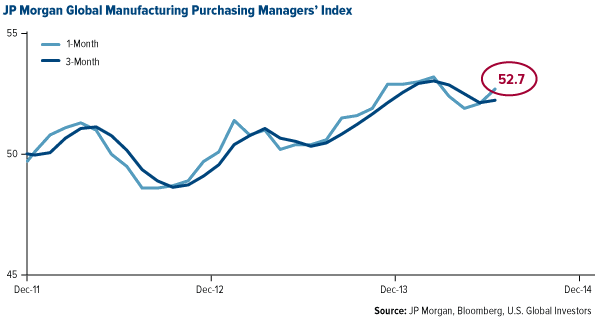
As we close the second quarter of 2014, several countries released manufacturing data this week including China and India. The JP Morgan Global Manufacturing Purchasing Managers’ Index (PMI) for June also came in this week at 52.7. This number measures global aggregate manufacturing around the world and June’s one-month reading broke above the three-month trend. Historically, this trend change means potentially positive news for investors.
click to enlarge
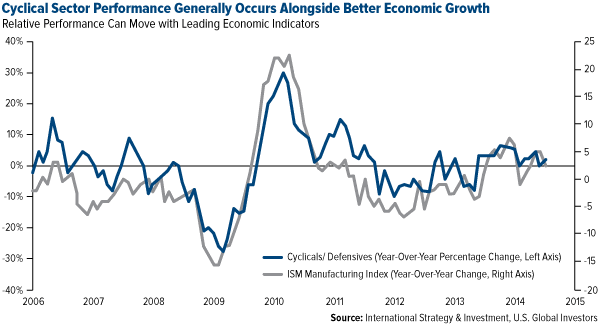
Our historical research shows that when this trend change has happened, we often see strong demand for commodities, higher manufacturing, along with a rise in GDP per capita. In the month following a cross-above, for example, 67 percent of the time copper rises. Shown in the chart below, as better economic growth occurs we have generally seen good performance from cyclicals such as energy, technology and health care.
click to enlarge
These encouraging signs from the global PMI reading go hand-in-hand with the growth in the health care sector that I discussed just last week.
We would like to wish all of our readers a safe and happy 4th of July from everyone here at U.S. Global Investors!

Index Summary
- Major market indices finished higher this week. The Dow Jones Industrial Average rose 1.28 percent. The S&P 500 Stock Index advanced 1.25 percent, while the Nasdaq Composite gained 2 percent. The Russell 2000 Small Capitalization Index rose 1.57 percent this week.
- The Hang Seng Composite rose 1.88 percent; Taiwan gained 2.36 percent and the KOSPI Composite Index advanced 1.13 percent.
- The 10-year Treasury bond yield rose 10 basis points to 2.64 percent.
Domestic Equity Market
The S&P 500 Index began the third quarter on a strong note with the market rising 1.25 percent. The health care and consumer discretion sectors led the way, with both groups rising about 2 percent. Utilities were the outlier, falling more than 3 percent. A combination of higher bond yields and strong performance through the first half of the year likely led to the selloff.

click to enlarge
Strengths
- The health care sector rose more than 2 percent as biotechnology names were particularly strong. Regeneron Pharmaceutical rose more than 12 percent as Sanofi disclosed in a regulatory filing that they increased their stake to 22.5 percent. Gilead Sciences, Celgene and Biogen Idec were all up roughly 4 percent or more.
- The consumer discretion sector was strong for the second week in a row. This is the worst performing sector year-to-date, and it appears some bottom fishing is taking place. PetSmart rose more than 10 percent after it was disclosed that an activist investor has taken a stake in the company and is urging a strategic review.
- The technology sector was also strong with broad-based strength. Memory manufacturers were particularly strong, with expectations for continued margin expansion. Leaders in this area include Micron Technology, Sandisk and Western Digital.
Weaknesses
- The utilities sector was by far the worst performer this week, with broad-based weakness across the entire sector on higher yields and some internal market rotation.
- The S&P 500 Oil & Gas Refining and Marketing subsector remained under pressure this week after falling 8 percent last week as the U.S. Commerce Department opened the door to oil exports from the U.S. by allowing condensate (ultralight oil) to be exported. This could potentially harm refiners who are benefitting from relatively cheap domestic oil prices.
- Other poor performing areas in the S&P 500 Index this week included diversified chemicals, food distributors and brewers.
Opportunities
- A strong employment report on Thursday reinforces the idea that the economy is gaining strength and, with positive economic tailwinds, it could propel the market higher.
- Earnings season is just around the corner. We’ll get our first taste next week when Alcoa reports on Tuesday.
- The path of least resistance for the market appears higher, as this classic bull market phase of grinding higher with low volatility remains intact for now.
Threats
- Volatility has been remarkably low. This bull market has been an abnormally smooth ride. The calmness won’t last forever, however, as and late summer and early fall have traditionally been more volatile.
- At almost 18 times trailing earnings, the S&P 500 Index is not cheap. Valuation may be a headwind for future market gains.
- Focus will shift to upcoming earnings. We are in the preannouncement season when negative news will likely be divulged.

The Economy and Bond Market
Treasury yields moved higher this week and the short end of the yield curve is at the highest level since late summer of 2013. Key economic data points were positive this week including the critical unemployment report. Nonfarm payrolls rose by 288,000 jobs in June, which was well ahead of expectations and generally viewed as strong. This sent yields higher as the market began to worry about implications for the Federal Reserve and potential rate hikes in 2015.

click to enlarge
Strengths
- The unemployment rate dropped to 6.1 percent and nonfarm payrolls grew by 288,000 jobs in June, supporting the view of a strengthening economy.
- The ISM Manufacturing Index remained roughly unchanged in June staying at a very strong level and indicating continued expansion in the manufacturing sector.
- The strength in the ISM was a global phenomenon with the JP Morgan Global Purchasing Managers Index (PMI) rising to 52.7, the best reading since February.
Weaknesses
- Construction spending in May rose 0.1 percent, well below expectations. Private construction fell 0.26 percent, driven by residential home improvement spending.
- Factory orders fell 0.5 percent in May, citing broad-based weakness. Ex-defense spending rose 0.2 percent.
- Bond yields moved sharply higher this week, particularly the short end of the yield curve, which has been under pressure since mid-May.
Opportunities
- The bond market has gone through fits and starts over the past year and the current run up in yields may be an opportunity if recent history is any guide.
- With little market moving economic data next week the market may focus on Fed Chairwoman Janet Yellen’s comments this past week that interest rate hikes may not be the best tool to deal with financial instability. This statement implies that other measures may be implemented first as the Fed moves to a tighter policy.
- With key global central banks back in easy policy mode and inflation trending lower in many parts of the world, the path of least resistance for bond yields is likely down.
Threats
- The economy has positive momentum and appears poised to continue to build on this strength as we move into summer. With the European Central Bank (ECB) and Bank of Japan taking the global lead in easy monetary policy, the Fed may transition to a tighter policy sooner than many expected.
- Japanese consumer price index (CPI) inflation hit the highest level in 32 years at 3.7 percent year-over-year. This number could be the canary in the coal mine on developed world inflation trends.
- St. Louis’ Fed President, James Bullard, stated that the economy is “closer to normal” than many realize and that the Fed could raise interest rates as soon as the first quarter of 2015.

World Precious Minerals Fund – UNWPX • Gold and Precious Metals Fund – USERX
Gold Market
For the week, spot gold closed at $1,319.56, up $3.38 per ounce, or 0.26 percent. Gold stocks, as measured by the NYSE Arca Gold Miners Index, rose 1.82 percent. The U.S. Trade-Weighted Dollar Index rose 0.22 percent for the week.
| Date | Event | Survey | Actual | Prior |
|---|---|---|---|---|
| July 1 | U.S. June ISM Manufacturing | 55.5 | 55.3 | 55.4 |
| July 2 | Fed Chair Yellen to speak at IMF | – | – | – |
| July 3 | ECB Main Refinancing Rate Decision | 0.15% | 0.15% | 0.15% |
| July 3 | U.S. June Change in Nonfarm Payrolls | 215K | 288K | 217K |
| July 8 | U.S. June NFIB Small Business Optimism | 97.0 | – | 96.6 |
| July 9 | China June Imports | 6.0% | – | -1.6% |
| July 9 | U.S. June Fed FOMC Meeting Minutes | – | – | – |
| July 11 | Germany June CPI | 1.0% | – | 1.0% |
Strengths
- Gold had back-to-back gains over the last two quarters, a rally not witnessed since 2011. In addition, gold prices have climbed 10 percent this year as physical demand in Asia has remained strong and investment liquidation ceased, contrary to bearish forecasts coming out of Goldman Sachs. Nevertheless, Goldman’s outlook on gold remains negative, despite the fact that escalating violence in Iraq and tension between Ukraine and Russia has boosted demand for a geopolitical hedge.
- Bullion exchange-traded funds (ETFs) are gaining momentum as investors flock to take advantage of the metal’s appreciation. Assets in the largest bullion ETF rose 1.4 percent in two consecutive sessions this week, the biggest two-day gain since 2011. In addition, Australia’s Perth Mint gold sales reached their highest level in four months, while U.S. Mint sales rose to 48,500 ounces in June from 35,500 in May.
- Following a recent visit to Klondex Mines’ Fire Creek and Midas mines, analysts at M-Partners have suggested their estimates may be too conservative, owing to the impressive sight of the Midas operation and exploration advances at Fire Creek. At Fire Creek, mineralization may not be as narrow as initially thought as additional exploration shows mining widths can be increased with minimal impact to grade, resulting in lower-cost mining methods. According to analyst Derek Macpherson, “[B]ased on the current valuation, investors are buying Klondex based solely on Fire Creek as it currently is and the Midas mill, giving them an expansion at Fire Creek and the Midas mine for free.”
Weaknesses
- Gold weakened mildly toward the end of the week as positive employment data from government and private sources suggests the economy is gaining speed at a quicker pace than analysts forecasted. Nonfarm payrolls comfortably beat economists’ estimates, showing the economy created 63,000 more jobs that initially expected. In addition, investors sought to square positions ahead of the U.S. long weekend, which may have removed some of the existing support.
- Shipments into India, the world’s second-biggest gold consumer, dropped 77 percent in the first half of the year, testament to government-enacted restrictions to contain a record current-account deficit, which has both increased costs and deterred buyers. However, on a slightly positive note, the government has announced it is considering a cut to its import duty on gold to 8 percent from 10 percent. Although not as large a cut as expected or hoped for, the direction is certainly positive.
- Newmont Mining has brought international arbitration against the Indonesian government after it placed restrictions on concentrate exports. Newmont, which placed its Batu Hijau mine on care and maintenance while it addresses the situation, argues the export ban violates its Contract of Work. Although Newmont believes this process will last only six months, history has shown these processes typically last over a year.
Opportunities
- As the chart below suggests, gold seasonality is about to pick up and drive a strong second half of the year. According to Raymond James’ analysts, conversations with money managers through the first half of the year suggested the metal will see a period of consolidation, with very few feeling the next leg was materially down, showing their comfort and confidence in holding gold investments. According to the analysts, investors should take increasing comfort that the metal is more or less behaving as forecast with gold’s volatility acting less irrationally. This, together with the strong seasonality expected seasonality, should bode well for a favorable second half of the year for both gold and gold stocks.

click to enlarge
- HSBC Research suggests gold’s recent rise can be largely attributed to the combination of the covering of speculative short positions on the COMEX and an increase in bullion holdings in the ETFs. In its metals outlook, Deutsche Bank agrees that short covering has been a driver, but goes further to say that broad gains may be in the horizon for gold, with bullion climbing to $1,356 and $1,388 as short sellers start to run scared now that gold has found its footing.
- There is new evidence to support the claim that inflation may be just around the corner, as wage increases have been mounting throughout the U.S. Companies like Gap and IKEA, which increased their minimum wages by 10 percent and 17 percent respectively, are contributing to a bump in rising prices. In addition, through the second quarter, consumer net worth is set to increase by 10.8 percent to $83.5 trillion. Economists argue that consumers do not have to spend much of that new income in order to significantly lift consumer spending. These events should culminate in an increase in inflation, which would put further downward pressure on real rates and keep yield searching investors’ eyes on gold.
Threats
- The South African government has reported a plan to increase taxes on certain mining exports such as platinum and iron ore. The policy, aimed to address falling prices, is likely to stifle the mining industry, create uncertainty and weaken production.
- The State Bank of India (SBI) and the Bank of Baroda have suggested that gold in India be monetized. Despite the policy’s stemming from the government’s recognition of the need to make better use of gold in the country, as well as making it more liquid, the move would serve to increase the supply of gold.
- The bear case for gold in a nutshell is that strong economic data out of the U.S. in the past month could shorten the remaining time frame of low rates. Goldman Sachs argues that higher U.S. rates have traditionally been inversely correlated with gold as investors move toward interest bearing government securities. Globally, weak performance in emerging markets, combined with increasing current account deficits, could result in cuts to gold imports.
Energy and Natural Resources Market

click to enlarge
Strengths
- Major diversified food and agricultural commodities stocks were among the best performers this week, after a definitive agreement for Tyson to buy Hillshire for $63 per share, or $8.55 billion including net debt.
- European steel imports are at their highest since July 2011, up 27.5 percent year-over-year, lifting the U.S. Steel share price 4.8 percent this week, after the company unexpectedly lifted prices, increasing all spot flat products by $28 per tonne effective immediately. Platts suggests that some buyers had expected the increase to come after the fourth of July holiday, although other industry reports indicate that some consumers had actually expected a fall after a number of weeks of range-bound pricing.
- Africa Oilfield Logistics Ltd. was the best contributor to the Global Resources Fund performance this week. The London-listed company focuses on the logistics support for oil and gas exploration in sub-Saharan Africa.
Weaknesses
- Oil and gas exploration and production companies underperformed the broader market this week, as an ISI Group analyst called them “overbought” and recommended taking “some chips off the table.”
- Agricultural stocks lagged behind even as crop prices firmed. Crop chemicals and seeds have been pressured by a mix of weather-related delays and product-specific regulatory issues.
- Anadarko Petroleum was the worst contributor to the Global Resources Fund performance this week. The company has priced $1.25 billion of senior notes, and will use the net proceeds from the offering for general corporate purposes.
Opportunities
- Cameron LNG has become only the second U.S. project to receive Federal Energy Regulatory Commission (FERC) approval to build and operate liquefied natural gas (LNG) export facilities, after the Sabine Pass project received its approval in 2012. FERC permitting is one of the last regulatory hurdles required before construction can proceed. Cameron LNG had already received Department of Energy (DOE) approval to export to non-Free Trade Agreement (FTA) countries, including Japan, which is a critical step to securing the long-term supply contracts needed to finance the project. Cameron LNG will reportedly have export capacity of 12 million tons per annum (mtpa), of which 8 mtpa will be delivered to Japan, with the first of three trains scheduled for 2017. To date, the DOE has approved 70 mtpa of LNG exports to non-FTA countries and has applications pending approval for another 190 mtpa.
- The eastern oil terminals of Ras Lanuf and Sidra, Libya, under separatist rebel control since 2013, are now back under central government control. The terminals have combined capacity of c. 550 thousand barrels per day (kb/d) and this opens the way for increased production and exports, although we don’t expect near-term production to return to the 1.4 million barrels per day (mmb/d) level seen in early 2013, as prolonged shut-in of the oil fields is believed to have caused damage to existing infrastructure. In addition, we would be surprised if this marked the end of geopolitical instability in Libya. Libya’s crude production has averaged just 300kb/d year to date in 2014.
- U.S. Energy Information Administration (EIA) weekly data shows robust demand. U.S. implied oil demand for the week ending June 27 rose 0.6 mmb/d (3.3 percent) to 19.4 mmb/d, above the seasonal average, with a rise in gasoline demand ahead of the July 4 holiday leading the gains. Refinery throughput rose in line with 2013 to 16.2 mmb/d, a year-to-date high. With domestic crude production flat week-over-week in spite of an additional 13 active oil rigs connected, and flat crude imports, the 0.5 mmb/d rise in refinery throughput dragged crude inventory levels lower, down 3.2 mmbbl week-over-week, more than market expectations of a 2.1 million barrel stock draw. Crude inventory levels remain high and gasoline stocks appear comfortable.
Threats
- Spot LNG prices to Northeast Asia continued their steady decline and are now below $11.3 per mmbtu for the first time since March 2011, down more than 40 percent from February. Meanwhile, spot LNG to Southwest Europe is $10.4/mmbtu, and with the differential to the Asian spot LNG price remaining below $1/mmbtu, no geographical arbitrage profit can be made in redirecting cargoes eastward, resulting in more LNG cargoes landing in Europe.
- The first tropical storm of the 2014 Atlantic Hurricane Season (Arthur) has formed off the east coast of Florida and is expected to head in a north-easterly direction. The U.S. National Oceanic and Atmospheric Administration (NOAA) have forecast a near-normal to below-normal season, citing the impacts of a possible El Niño and cooler Atlantic Ocean temperatures. NOAA is predicting a 70 percent likelihood of eight to 13 named storms, with three to six of these becoming hurricanes, including one to two major hurricanes. Last year was one of the least active hurricane seasons in decades, with the fewest number of hurricanes, none of which reached major hurricane status, and was cited for increased underlying production in the third quarter.
- Eurozone manufacturing PMI for June came in at 51.8, a seven-month low, with output and order backlogs both at nine-month lows suggesting a significant loss of growth momentum in Europe during the second quarter of 2014. Germany’s manufacturing PMI fell to an eight-month low while France has fallen back below the 50 level in the past two months. Overall, not an encouraging result.
Emerging Markets
Strengths
- Qatar was the best performing emerging market for the week, rising ~4.75 percent on strong volume. The main performance driver was a release by the Qatar Advisory Council saying it approved a draft law by the Cabinet to exempt foreigners trading in Qatari stocks from tax on capital gains and income. The draft law applies to foreign investment, mutual and portfolio funds, as well as foreign companies and individuals with subscriptions to the funds.
- Information technology was the best performing sector in emerging markets this week, led by companies domiciled in Taiwan and China. Investor sentiment towards technology remained buoyant ahead of a potential launch of new iPhones and initial public offering of Alibaba Group in the same month of September.
- Global manufacturing activity accelerated in June, as the JPMorgan Global Manufacturing Purchasing Managers Index (PMI) rose to a four-month high of 52.7 in June from May’s 52.1, holding above the 50 mark, indicating growth for the 19th month in a row. The United States, Britain and much of Asia, including China and India, recorded solid increases in activity last month. In addition, the one-month reading crossed above the three-month average which, according to our historical analysis, suggests the natural resources
Weaknesses
- Turkey was the worst performing emerging market for the week, falling ~1.4 percent on a weak PMI reading and higher than expected inflation. For the month of June, manufacturing conditions deteriorated for the first time since July 2013, as the PMI fell to 48.8, from 50.1 in May. In addition, Turkey’s consumer price index (CPI) increased by 9.16 percent year-on-year in June, slowing less than a market forecast of 8.7 percent from a two-year high in May.
- Utilities was the worst performing sector in the emerging market complex for the week, largely led lower by Polish and Brazilian stocks. In Poland, the government’s announcement that it will sell a 3.5 percent stake in PGE SA, Poland’s largest power utility, after this year’s phenomenal performance caught the market off guard and led the sector lower in Poland. In Brazil’s case, thermal dispatch by power generators is expected to remain at high levels to avoid rationing risks, despite the fact that spot prices are in negative -5 percent territory and eroding producers’ margins.
- Indonesian agriculture was the worst performing sector in Asia this week. Palm oil producers pulled back as crude palm oil prices, retreating 19.5 percent from a mid-March high, stayed in a downtrend due to rising production from Indonesia and Malaysia, lower than expected biodiesel demand and delayed arrival of production-disruptive El Nino.
Opportunities
- Poland has seen its economy grow since the collapse of communism by more than any other in the EU, as shown in the latest special report by The Economist. The solid economic performance has given Poland extra weight in the European Union (EU), both economically and politically. In reality, Poland fought harder than its Eastern peers against corruption, especially in public procurement, as a means to attaining EU’s Structural Funds, for which the country has earned a decent record of using for the benefit of the economy. As a result, the EU rewarded Poland by making it the biggest recipient of its funds (a whopping $139 billion) between 2007 and 2013. The country will once again get the biggest chunk in the next multi-year budget from 2014 to 2020. Poland has kept pushing ahead with reforms in a way that Germany and France have not, and by the looks of it, it can continue to outperform its peers when it comes to economic growth.

click to enlarge
- Greek wages have fallen 25 percent in four years, helping boost the competitiveness of the domestic economy. Most countries in crisis are left to depreciate their exchange rate to address lack of competitiveness, without solving the fundamental problem, however. Greece has succeeded in lowering real wages to help boost its exports as a means for economic recovery.
 click to enlarge
- The upcoming launch of new iPhones, weaker Taiwanese dollar versus both Korean won and U.S. dollar, lower metal input costs year-over-year, improving global economy and lower valuation compared with NASDAQ-listed cohorts should propel and sustain a catch-up rally of Taiwanese suppliers of semiconductors and other electronic components, given the tech supply chain linkage and historical correlation.
 click to enlarge
Threats
- Brazil manufacturing data for June restates the bad news. The HSBC Brazil Manufacturing PMI suggests that business conditions in the manufacturing sector weakened at about the same pace as in May, with the headline PMI index falling to 48.7 in June. In addition, output fell at the strongest pace in three years, albeit somewhat related to World Cup-related disruptions, but still pointing to a weak economy.
- BTIG Technical Strategy is recommending taking profits in Russia. In their recent Global Technical Strategy, they argue that the Russia Trading System (RTS) Index will roll over after another week or two of positive follow-through. According to the report, resistance is now in-line and remains in a long-term downtrend despite a 40 percent gain from its March low. BTIG believes overbought conditions may finally catch up with Russian equities, leading them into a correction phase.
- Average new home prices in 100 Chinese cities tracked by real estate online portal Soufun declined sequentially for a second month in June by 0.5 percent, accelerating from a 0.32 percent decline in May, with 71 cities registering lower pricing month-over-month. Fragile and deteriorating sentiment toward Chinese residential property oversupply in lower-tier cities only adds to the volatility of property-developer stocks in the near term.

Leaders and Laggards
The tables show the weekly, monthly and quarterly performance statistics of major equity and commodity market benchmarks of our family of funds.
| Index | Close | Weekly Change($) |
Weekly Change(%) |
|---|---|---|---|
| 10-Yr Treasury Bond | 2.64 | +0.11 | +4.22% |
| XAU | 101.48 | +2.38 | +2.40% |
| Nasdaq | 4,485.93 | +87.99 | +2.00% |
| Hang Seng Composite Index | 3,236.29 | +59.80 | +1.88% |
| Russell 2000 | 1,208.15 | +18.65 | +1.57% |
| S&P Basic Materials | 316.56 | +4.53 | +1.45% |
| DJIA | 17,068.26 | +216.42 | +1.28% |
| S&P 500 | 1,985.44 | +24.48 | +1.25% |
| Korean KOSPI Index | 2,010.97 | +22.46 | +1.13% |
| S&P/TSX Canadian Gold Index | 194.77 | +1.79 | +0.93% |
| S&P Energy | 730.37 | +2.85 | +0.39% |
| Gold Futures | 1,320.50 | +0.50 | +0.04% |
| Natural Gas Futures | 4.38 | -0.03 | -0.75% |
| Oil Futures | 103.83 | -1.91 | -1.81% |
| Index | Close | Monthly Change($) |
Monthly Change(%) |
|---|---|---|---|
| XAU | 101.48 | +16.50 | +19.42% |
| S&P/TSX Canadian Gold Index | 194.77 | +25.38 | +14.98% |
| Russell 2000 | 1,208.15 | +82.00 | +7.28% |
| Gold Futures | 1,320.50 | +76.00 | +6.11% |
| Nasdaq | 4,485.93 | +251.84 | +5.95% |
| S&P Energy | 730.37 | +36.27 | +5.23% |
| S&P 500 | 1,985.44 | +61.20 | +3.18% |
| S&P Basic Materials | 316.56 | +7.17 | +2.32% |
| DJIA | 17,068.26 | +345.92 | +2.07% |
| 10-Yr Treasury Bond | 2.64 | +0.04 | +1.65% |
| Oil Futures | 103.83 | +1.17 | +1.14% |
| Korean KOSPI Index | 2,010.97 | +2.41 | +0.12% |
| Natural Gas Futures | 4.38 | -0.25 | -5.47% |
| Hang Seng Composite Index | 3,236.29 | -332.01 | -14.83% |
| Index | Close | Quarterly Change($) |
Quarterly Change(%) |
|---|---|---|---|
| S&P Energy | 730.37 | +68.18 | +10.30% |
| XAU | 101.48 | +8.79 | +9.48% |
| Nasdaq | 4,485.93 | +248.19 | +5.86% |
| S&P/TSX Canadian Gold Index | 194.77 | +10.47 | +5.68% |
| S&P 500 | 1,985.44 | +96.67 | +5.12% |
| S&P Basic Materials | 316.56 | +14.04 | +4.64% |
| Oil Futures | 103.83 | +3.54 | +3.53% |
| DJIA | 17,068.26 | +495.71 | +2.99% |
| Hang Seng Composite Index | 3,236.29 | +88.55 | +2.81% |
| Gold Futures | 1,320.50 | +35.60 | +2.77% |
| Russell 2000 | 1,208.15 | +27.03 | +2.29% |
| Korean KOSPI Index | 2,010.97 | +17.27 | +0.87% |
| Natural Gas Futures | 4.38 | -0.09 | -2.10% |
| 10-Yr Treasury Bond | 2.64 | -0.16 | -5.58% |


