
For weekend reading, while commenting on going long the Russell 2000, Louis Navellier offers the following commentary:
Q2 2021 hedge fund letters, conferences and more
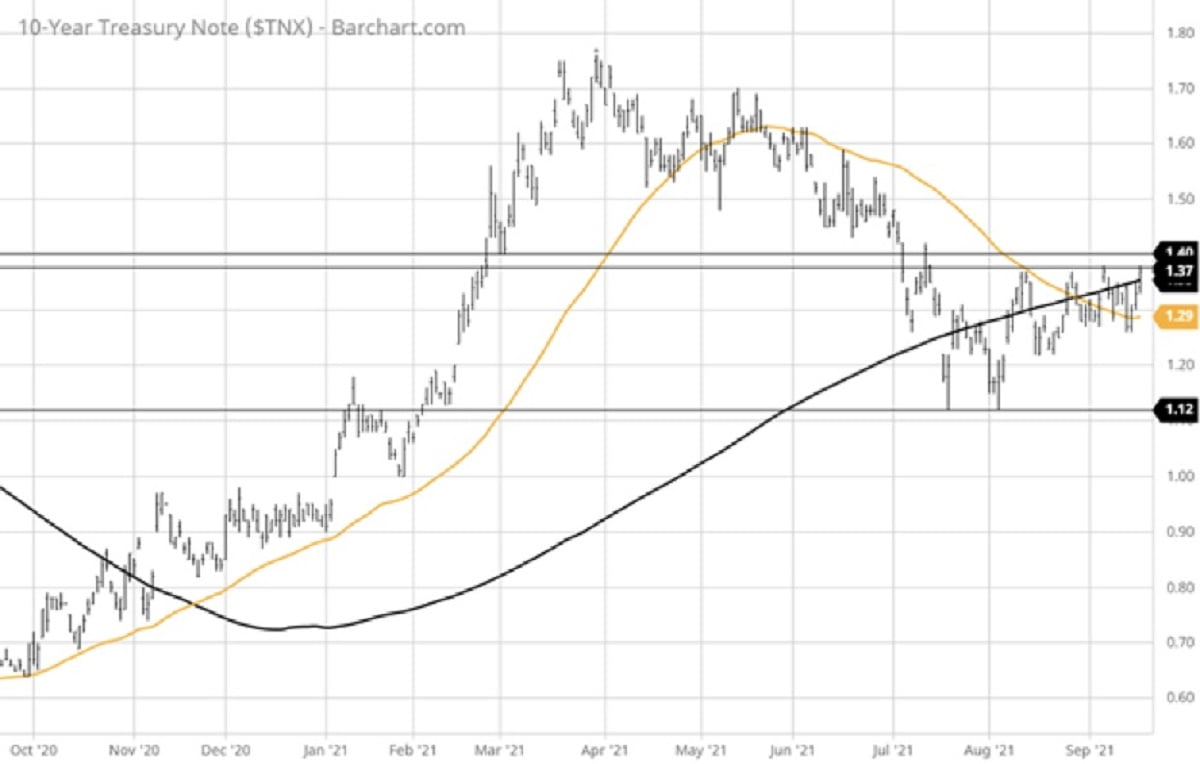
This past week saw a number of potential market headwinds emerge that pressured the major averages lower. Mixed data showing higher inflation at the wholesale level, tame inflation at the consumer level, surprisingly strong retail sales, upbeat manufacturing in the New York region, and subdued consumer confidence, pushed Treasury yields marginally higher on a net basis. The yield on the 10-year Treasury is at a key inflection point, where a move above 1.40% will likely trigger further technical selling.
Distractions
The potential collapse of Chinese mega-developer Evergrande is provoking the questions about whether this will be a “Lehman moment” creating a systemic impact on global markets.
Another potential market mover is varying interpretations of FOMC policy now that the Feds have said their piece.
And lastly, Congress has yet to raise the debt ceiling and political brinkmanship is unsettling to the Street, and toss in the recent spike in WTI crude prices to $72/bbl and one would think the market’s best-case scenario is a sideways finish to the year.
Hard Look
It would seem that, under this set of circumstances, the path of least resistance for equities is lower, but markets are forward-looking and have likely priced in most of the pessimism brought about by these noted risks. Assuming there is progress on all these fronts in the next month, it might behoove investors to take a hard look at going long the Russell 2000, where the majority of stocks are smaller domestic companies. This might be the most under-owned sector with the most room to run.
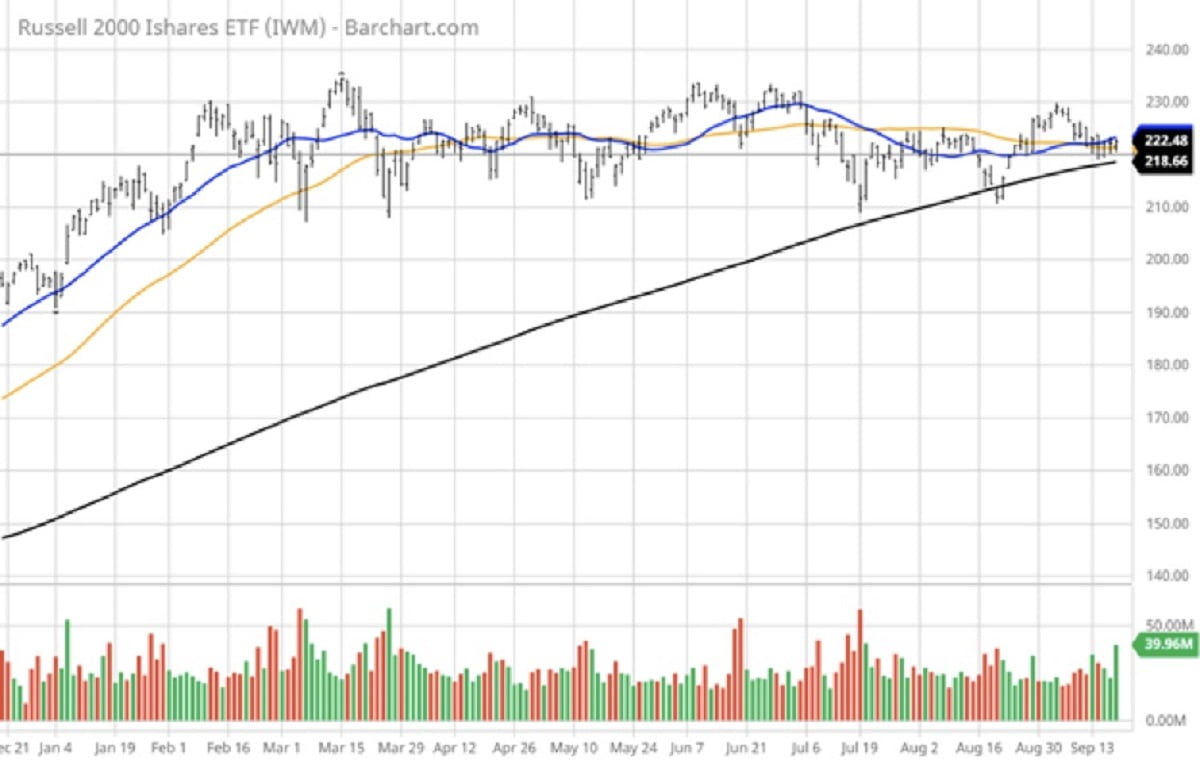
What’s good about this investment setup is that the downside risk is very well-defined by looking at the year-to-date chart of the Russell 2000 iShares ETF (IWM), which has been consolidating in a 20-point range for the past eight months. Logic would have it that if the risks outlined above were truly going to undo the primary bull trend, shares of IWM would have already broken down through key support at $216, where its 200-day moving average sits. Instead, we see a chart pattern where both the 20- and 50-day moving averages are converging with the 200-day MA – and trying to turn higher.
Break Levels
A break of the $218 level and further violation of the $210 level would be where an appropriate mental or physical stop-loss would be appropriate. This implies a downside risk of 1% to 3.5% and an upside of, let’s say, 20% to 30%. The technical maxim of “the longer the base, the higher the space” comes to mind here. Eight months is a long technical base, and a huge opportunity for profits IF this key support level holds.
The Russell 2000 has missed out on this year’s rally. As of last Friday’s close, the S&P 500 is up 18% and the Nasdaq is ahead by 16.7%, but the Russell 2000 is up only 13.3% Considering the fact that the small- to mid-cap stocks hold the greatest amount of investment risk, to see this tier of the market in the midst of so much hand wringing is not only counterintuitive, it is starting to look very compelling.
Technical Pressure
One thing market technicians will tell us about the IWM chart is that there is intense technical pressure at this inflection point as to where the next powerful move, be it up or down, will be. This set-up is one of the great and most interesting things about the stock market; it will behave in ways that defy logic, only to be understood well after a big move has occurred. There are circumstances beneath the surface of the market’s veneer that are offsetting a weaker NYSE advance/decline line and other negative factors.
What these factors are, at present, is elusive, as far as I can tell, but if shares of IWM trade above $235 on heavy volume, it will be “off to the races” for Russell, providing broad confirmation that the bull market has further to go. It’s September and pessimism is elevated due to the unknowns surrounding Fed policy, tax policy, the debt ceiling, rising bond yields, stalemated infrastructure spending, the Delta variant, a meltdown in Evergrande, slowing growth in China, rising oil prices, and global supply bottlenecks. And yet, the Russell 2000 has not rolled over, it actually looks like it is preparing for an upside breakout.
This would be a most welcome event, as it would indicate capital flows are increasing risk-on exposure to the U.S. economy. How this scenario unfolds is still a coin toss, but the one thing the IWM chart suggests is that we’ll know one way or the other in the near future.


