Two reports caught my attention yesterday. Firstly, outflows from corporate bond funds continue apace. Last week, according to a report in the Financial Times (FT) citing data provider EPFR Global, investment grade bond funds suffered their biggest withdrawal in three months with investors taking back over $1 billion. Junk bond fund outflows amounted to nearly $800 million of that total, taking the amount of capital fleeing the riskiest debt funds to over $47 billion this year.
That’s eye catching enough but, if you link it with another report, also from the FT, a potential chain of events becomes clear. The FT cites research from Citi highlighting the fact that most corporate bonds do not trade very regularly. In fact the research found that “only 18% of the entire corporate bond universe traded on any given day.” What this means is that price discovery (i.e., ability to trade) in the vast majority of corporate debt is not easy and, in certain circumstances, could be very difficult. Indeed, the FT report itself states that “lack of volume could be a problem should a lot of investors want to withdraw money from mutual funds.”
This column has previously highlighted that corporate bond Exchange Traded Funds do not even try to replicate the entire index that they are supposed to follow because many of the underlying issues have no liquidity. Nevertheless, bond funds will still own a lot of paper that is on the frozen side of liquid. The amount of investor outflows seen so far this year will be causing funds to sell underlying assets and, if the outflows continue, the ability to do that without causing price dislocation will become much more difficult.
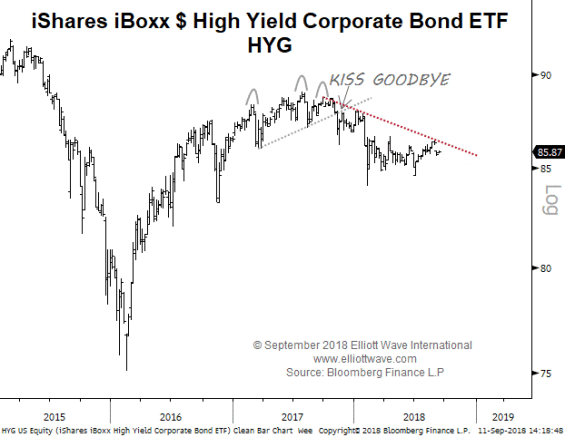
The chart below shows the iShares iBoxx High Yield Corporate Bond ETF, ticker HYG. The last time we showed this chart was back in February when we highlighted the classic technical analysis pattern known as a head and shoulders top, complete with a “kiss goodbye” test of the neckline. Since October last year, HYG has been hugging a downtrend line which has once again acted as resistance. Our analysis suggests further weakness. Anticipate increasing focus on corporate bond liquidity in the weeks ahead.
Murray Gunn is Head of Research for Elliott Wave International's Global Market Perspective (www.elliottwave.com), a monthly summary of the firm’s 25 analysts’ views on every major freely-traded market in the world.


