There are two schools of thought when it comes to value investing.
Q2 2020 hedge fund letters, conferences and more
Value And Growth Are Connected
The first school of thought is that value and growth are connected at the dot. You have to pay a higher multiple for future growth.
Another school of thought believes that you need to wait and not overpay for future growth.
Sometimes, the investors who wait to buy at the right price, and avoid overpaying tend to look very smart. Like avoiding buying Japanese stocks in 1989 or Tech stocks in 2000.
Other times, buying stocks at any price seems to be a winning combination. Like buying tech stocks in 2010, or 1990 or buying Japanese stocks in 1980.
Many investors today believe that stocks are overvalued. Others believe that stocks are priced correctly for the environment we are in.
We have all heard that stocks return 10%/year. This is correct for the stock market as a whole. But when you dig through on the individual security level, you can find that a lot of companies tend to not do very well. Some research found that most companies tend to do worse than Treasury bills. The great stock market returns are driven by a handful of companies that tend to push the fortunes of investors upwards.
Investing In Large Blue Chip Companies
Depending on how you view the data however, you can see that the largest companies that are profitable, tend to continue delivering profits to shareholders. This is perhaps why investing in well known large blue chip companies that make money has worked so well, and is so popular with DIY investors. Focusing on smaller and less known companies is more speculative, and this is precisely where the majority of companies with terrible returns tend to hang out.
If you look at a list of companies at the beginning of a period, and trace the results 10 or 20 years down the road, you get to see a very interesting observation. Notably, the paretto principle in action.
The paretto principle for equities should state that 20% of companies are responsible for 80% of equity returns. This is why you need to have great diversification, but also focus on quality too. While we do not know which the best companies over the next 20 years are going to be, we know that we need to diversify, and hopefully our portfolio as a whole should do ok.
This is a very interesting exercise for me to go through as well, because it does tell me that predicting future winners and losers from a list is very difficult. I’ve tried it before, but my success could have been due to luck, than skill.
This exercise also teaches me that investing is part art, part science. It also teaches me that the overall results from a portfolio would be dependent on a few big winners. So if I sell those winners early, that would mean that I would be stuck with a mediocre investment career. If I hold on to those winners, I may look like a winner at the end. The goal is to build a diversified portfolio, and stick to my holdings. I encourage investors to read more about the Coffee Can Approach.
Low P/E Ratio Signals Value
In general, a low P/E ratio signals “value” to many investors. However, if a company with a low P/E ratio never grows earnings or even worse, its profits decline over time and even turn to losses due to challenging business conditions, it may turn out to be a value trap.
On the other hand, companies with high P/E ratios may signal “danger” to many investors. However, a company with a high P/E ratio that manages to grow earnings per share over time may turn out to have been a cheaper stock than a low P/E one.
Of course, while P/E ratio and dividend yield are relatively known today, the future growth of earnings and the business are tough to ascertain with any certainty.
The funny part is that neither of these approaches works all the time. Things are cyclical in nature. Sometimes the so called value approach works great, and it washes out the growth investors.
After that, the growth cycle comes into gear, and these companies and investors tend to smoke out any value investors.
Both can work, but over long periods of time. Even if your approach works eventually, it may be a very long and testing process, where the majority of results re not visible until the end.
For example, investing in the Nifty 50 in 1972 delivered similar results to investing in S&P 500 through 1998. Source: Valuing Growth Stocks: Revisiting the Nifty Fifty
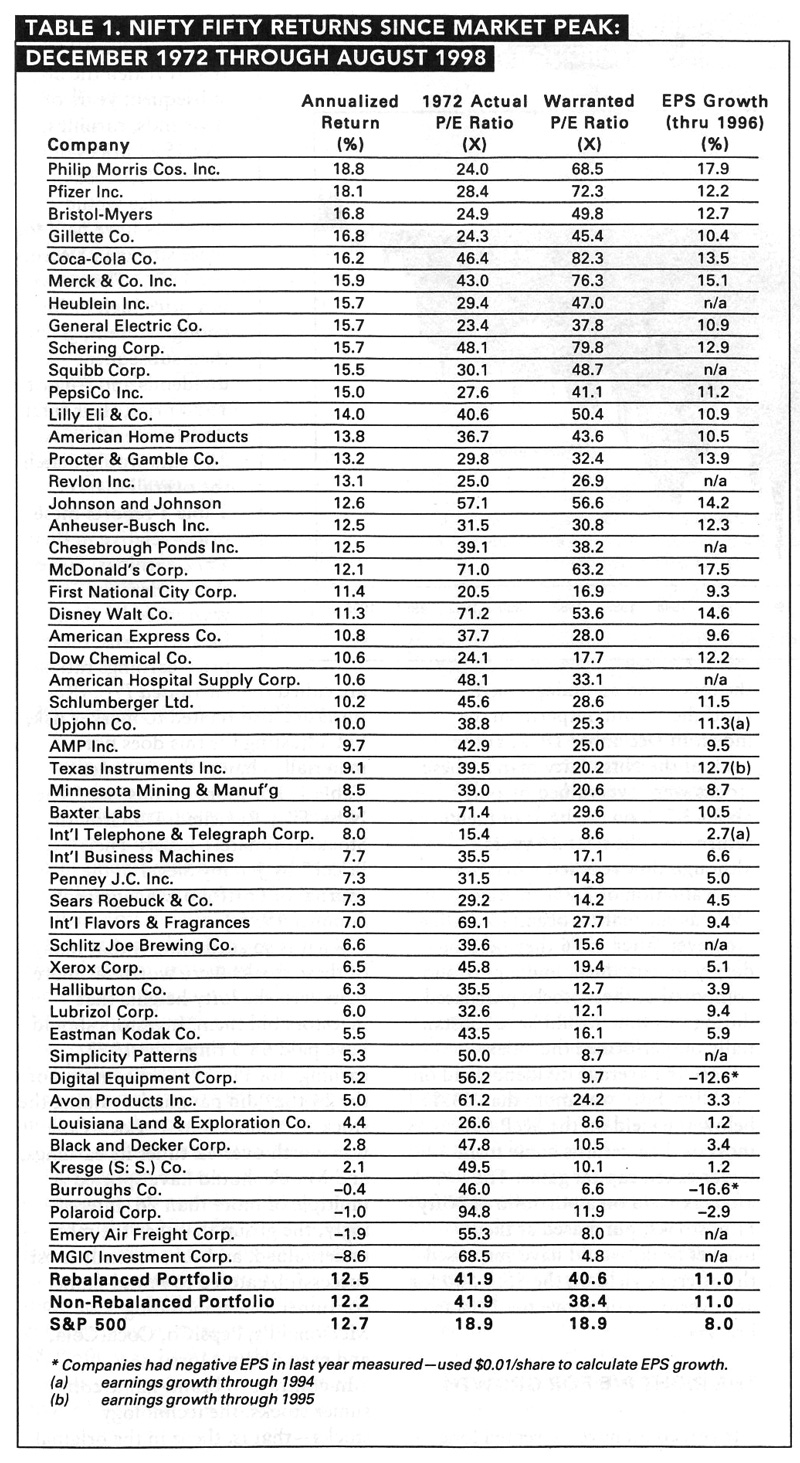
That’s despite teh fact that the Nifty 50 sold at ridiculously high P/E ratios. It turned out that as a whole, these companies were priced right as a group, since their earnings growth more than compensated for the high P/E ratios. Of course, long-term investors had a long and trying time in the market, since the first decade after 1972 brought poor results, as these companies went back to more reasonable valuation. The valuation compression ate into returns in the first decade, despite the fact that these businesses were still growing profits. Ultimately, the long-term returns of these businesses were dependent on the underlying fundamentals growth in these businesses. If someone bcame scared or lost patience after a decade of poor or no returns, they would have bought high and sold low.
The results of two different investors in the same Nifty 50 stocks would have varied significantly based on their start/end timeframe. Someone who started in 1972 would have had their conviction tested in the first decade, before recovering and ultimately recovering nicely. However, if someone started just a few years later, they would have done fantastically. I often think about results we see, if we did one thing at a certain time versus another. Since we as humans learn from experience, it is interesting to observe how early success or failure would affect our psyche as investors. If you fail early on, you may give up, even if that failure may have been a simple test of conviction ( albeit with a 70% drawdown in 2 years). If we experience winning from the start, we may see things differently.
Let’s think about value versus growth with another example. Between 1950 and 2003, Exxon had a lower rate of growth and a lower P/E than IBM. However, Exxon did better for its investors than IBM. Mostly because the dividends were reinvested back into a low P/E, low valuation. The stock was not overvalued relative to its earnings prospects.
Recently, we have the Nasdaq 100 reaching all time highs, which has made some investors very confused. After all, we are in the midsts of a global pandemic that would have far-reaching repercussions for the world economy for years down the road. The US GDP has contracted by the highest amount in Q2 2020, and we have the same situation for a large part of the developed world. Unemployment is high, and there are riots on the streets.
Plenty of investors see that news, and assume a bearish view. This view is reinforced by high valuations for stocks. Many are comparing the high valuations today with the Nifty Fifty from 1972, and the Dot Com bubble from 1999 – 2000.
Nifty Fifty Stocks
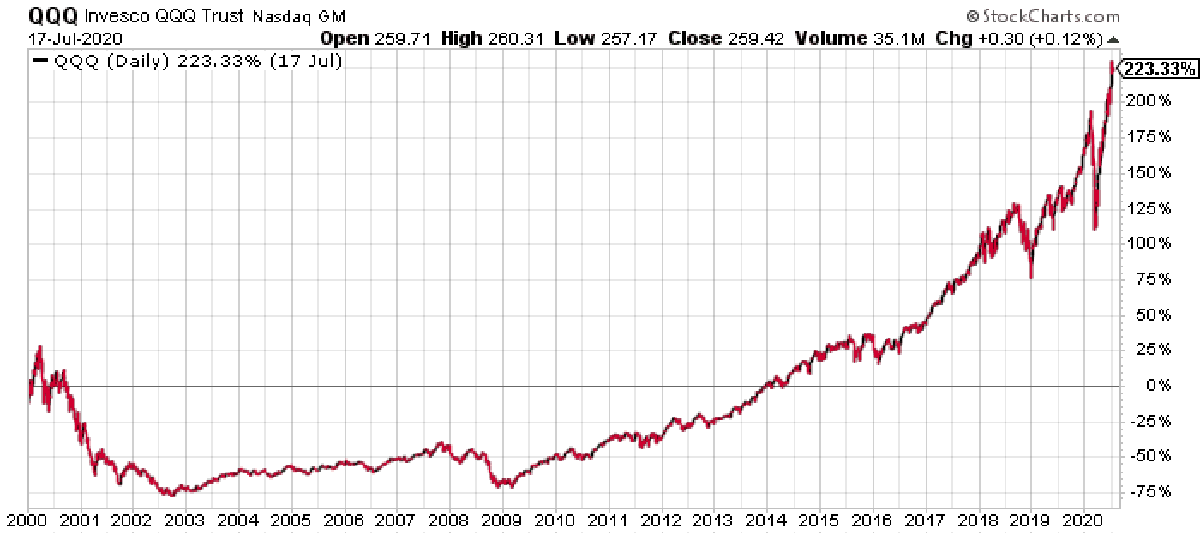
Prof Jeremy Siegel has already discussed how investing in the original Nifty Fifty has done for investors through 1998. I decided to go back and see how a passive investor in the Nasdaq 100 would have done if they bought in January 2000. If we are in a similar situation as in 2000, perhaps studying how it turned out, may give us some ideas on how to proceed today.
If you bought Nasdaq 100 in 2000, you would have basically tripled your money by July 2020. This is not a bad deal, given the fact that tech stocks were ridiculously expensive in 2000. With sky-high P/E ratios that made little sense, but fueled by the belief in unlimited future growth prospects. Of course, to get there, you had to endure a long and grueling period of about 13 – 14 years, before breaking even. This would have tested the nerves of many investors.

It was fascinating for me to dig a little further. I was able to find the components for Nasdaq 100 companies in 2000. You can view the companies in the list below. It has it sorted by portfolio weight.
The next step I took was to calculate the returns for each company from January 1, 2000 to July 17, 2020. This is shown in the third column above. The column shows how a $10,000 investment in one company on January 3, 2000 turned to be worth by July 17, 2020.
This was a fun exercise. I used the site dividendchannel.com to calculate total stock returns. For other companies that were difficult to find, I looked at various databases available through my source, as well as old news/newspapers.
It is possible that an academic with access to a nice database may be able to get the results easier, and with less errors. I am limited by the fact that I am one person with one computer ( and a lazy intern).
My assumptions were that I would invest $10,000 in each of the 100 Nasdaq 100 companies on January 3, 2000. I would hold till July 17, 2020.
If a company is acquired, I just keep the dollars in cash. I did not assume any reinvestment, which would have likely further increased returns. That’s because most of these acquisitions occurred when stocks were cheaper five years ago. I also did not track how an exchange in the acquirers shares would have done. But my goal was to research how each individual company fared as an investment, and go from there. It very is likely that I am understating investor returns with this methodology. If you are able to quickly make calculations using historical databases at your disposal, your input would be much appreciated.
It turned out that if you equally weighted the 100 companies in Nasdaq 100 from 2000, you ended up quadrupling your investment.
If you drill down on the individual company level, you can see that only 50 companies delivered a profit to their shareholders. The other 50 delivered a loss to their shareholders.
Only 23 companies managed to at least triple the returns. Ten of these companies accounted for $2.65 million of the $3.1 million in gains – so basically for close to 90% of the gains. If you had sold these ten companies, but held on to the others, you would have barely broken even after 20 years.
Investing In The Nasdaq 100 Trust Etf
A $1,000,000 investment on January 3, 2000 was spread over 100 companies, investing $10,000 in each. By July 17, 2020, that investment turned out to be worth $4.089 million. That’s better than the $3.32 million if you had merely invested in the Nasdaq 100 Trust Etf (QQQ).
In other words, you did better than the Nasdaq 100 itself.
That’s because I assumed equal weighting, which gives each company the same opportunity to the top. The Nasdaq 100 is a market capitalization weighted, which means that the largest companies are given a higher weight. These large companies in 2000 were Cisco and Intel, both of which were overvalued and too large to grow as fast as their market prices in 2000 suggested. There were a lot of other large companies from 2000, which did not do that well – JDS Uniphase, Sun Microsystems etc.
Microsoft did pretty well, rising fivefold in value, most of the gains being in the last 6 – 7 years however.
The 10 largest companies accounted for over 43.60% of the index value. They didn’t do as well, as an equally weighted $100,000 investment turned out to be worth $136,554 by 2020.
Most of the gains were driven by the companies that had a small allocation to the Nasdaq 100 in 2000. This goes contrary to the idea that you should concentrate your portfolio in your best ideas.
You can see that the ten best performing companies from Nasdaq 100 from January 2000 represented less than a 5% weighting in the index around the time of the dot-com bubble. Yet an investment of $100,000 that was allocated equally between these ten companies turned out to a cool $2.757 million by July 2020.
In fact, the best performing company in Nasdaq 100 from 2000 was Apple, which turned out to be a 100 bagger through July 2020. It had a 1% weighting in Nasdaq 100 in 2000.
Amazon was a 33 bagger, but it had a less than half a percent allocation in Nasdaq 100.
The other reason why it did so well is because there was not a lot of forced turnover. Usually, index committees actively take in and out stocks from an index. That activity reduces investment costs and returns. You may notice that the companies in the Nasdaq 100 that quadrupled your money were already public in 2000. You did not need to own companies that went public after 2000, which is somewhat counter-intuitive to many investors.
Lessons Learned From The Study
There are several lessons I learned from this study. I will discuss how they will impact my investing.
The first lesson is that we do not know in advance which the best performers over the next 10 or 20 years will be. That’s why it makes sense to diversify. The paretto principle in action works here – a small group of companies provide most of the investment returns, while the rest are losers. This means to avoid selling as much as possible. If you sold Apple or Amazon in 2000, you would have not achieved great returns. A lot of investors make the mistake of selling their winners early, because supposedly nobody went broke taking a profit. That’s bullshit. When you sell shares, you are taking a huge risk. If you sell early some of the companies that turn out to be the biggest winners in your portfolio, you are destined for a life of investment mediocrity. If you keep them, you may live to see another day and possibly make a profit. Let your winners run, and keep losses small.
The second lesson is that we need to be as patient as possible when investing. It may take us a long period of time to realize our investment gains. For example, a lot of companies in the index, and the index itself, spent a large portion of time in a drawdown (losing money). If you look at Microsoft (MSFT), you can see that up until 2013 an investment in 2000 was under water.
That’s why you need to keep your investment, and not sell. It is hard to do, especially if you are sitting at a loss for 10 – 15 years. Sometimes, good things take time to occur.
The third lesson is that future returns are unpredictable. A company may not go anywhere for a decade, leading many investors to sell. That’s usually how it goes, since when everyone bails out, the company starts succeeding. So you need to keep invested,
The fourth lesson is to give each company an equal chance of success. The ten largest companies in Nasdaq 100 in 2000 accounted for more than 40% of the index weight. Yet, they turned a $100,000 investment to $136,000 by 2020.
The fifth lesson is that valuation matters. The companies in 2000 were overvalued as a group. Perhaps the 10 or 20 largest companies were overvalued the most, dragging the valuation multiples upwards. But the high valuation made making future returns more difficult to accomplish. If all the future growth for the next 20 years is priced in today, you will likely make no returns. If it turns out that the 2000 investors were over optimistic, they you would suffer losses. Either way, as a group, it took the list of companies a decade go through the valuation compression, even if they did better fundamentally. Then it took another decade for the growth in fundamentals to lift investment returns too. It is also likely that valuation multiples are high today as well.
The reason why stocks went nowhere between 2000 – 2013 was mostly because they were so overvalued in 2000. If stocks had been cheaper in 2000, investors would have likely enjoyed a return in 2000-2010 and 2010- 2020. But in the stock market, returns are lumpy (unless you are focusing on dividends of course).
The sixth lesson is that passive investing works. To me, passive investing does not mean just buying an index fund. It means assembling a diversified portfolio of investments, limiting turnover and costs, and holding for the long with a limited interruption to the compounding process. Selling is costly, because you risk getting rid of one of the few companies that can lift your portfolio returns. Hence, holding on tight works, since the reduced turnover reduces commissions, fees and taxes, along with the aforementioned behavioral costs.
There are actually tax advantages to constructing a holding such a portfolio in a taxable account. Since a large portion of companies ended up losing money, the investor generated tax losses to offset income. These are worth something in a direct portfolio, and this is something that is no passed on to holders for ETFs or mutual funds.
The majority of companies that lost money ended up delisting due to failure or due to an acquisition. For the 45 companies where the investment value was less than 10,000 on 7/17/2020, and had an end date associated with a delisting, the ending value was $128,344. Yet, a cool $450,000 was invested in those enterprises. This leads to a long-term capital loss carryforward of $320,000. This can be used to offset future capital gains when realized, or to offset regular income.
We also had 17 companies that were delisted most probably due to an acquisition/merger, resulting in a profit. The net effect is $389,693 in value, which creates a long-term capital gain of close to $270,000. I know for a fact that Sigma-Aldrich (SIAL) was completed in cash in 2015, so a third of those long-term gains of $270,000 were not deferred by exchanging the acquirer stock for the acquired company stock.
Ok then, perhaps it is best to invest in a tax-deferred account then in order to minimize the headaches at tax time every year.
The seventh lesson is the importance of luck in investing. While valuation is important, it is only visible in hindsight, as valuation is part art, part science. Stocks may stay overvalued for an extended period of time. In fact, many believed that stocks were overvalued as early as 1992, and 1994 – 1995 and particularly in 1996 with Greenspan’s famous quote about “irrational exuberance”. Yet if you had bought stocks at that date, you would have done very well for yourself ( assuming you had the patience to hold on for 25 years without selling). If you managed to buy this list in 2010, you would have done very well, as valuations were much cheaper than in 2000. Since most returns occurred 10 years ago, this means that the investor buying in 2010 has the view that stocks only go up and they enjoyed all the gains that the 2000 investor had, but in half the time.


