Gold Had Its Best Quarter in a Generation. So Where Are the Investors?
By Frank Holmes
CEO and Chief Investment Officer
U.S. Global Investors

It’s no April Fool’s Day joke: The last time gold had a quarter this strong, Ronald Reagan was a year into his second term as president, the Soviet Union was taking its final gasp and the U.S. was still reeling from the Challenger explosion. Year-to-date, the yellow metal has risen 16.5 percent, its best three-month performance since 1986, mostly on fears of negative interest rates and other global central bank policies.

Bloomberg writes that the current gold rally has “cemented its status as a store of value.” Before now, a gold bear market persisted not because the metal had lost its status necessarily, but because of the strong U.S. dollar and, more significantly, positive real interest rates. According to Pierre Lassonde, cofounder of Franco-Nevada, gold is the fourth most liquid asset in the world.
As I’ve mentioned many times before—during interviews and in the Investor Alert and my CEO blog Frank Talk—gold has historically performed best when real rates turned negative. We were one of the earliest to discuss this important relationship on a regular basis, and now I’m starting to see it covered frequently in the mainstream media.
To get the real rate, you subtract the current consumer price index (CPI) reading, or inflation, from the government bond yield. When yields are low—or negative, as they are now—it encourages smart investors to seek other stores of value, including gold.
Below, you can see that when gold prices peaked at $1,900 per ounce in August 2011, real interest rates were close to negative 4 percent. A five-year Treasury bond yielded only 0.9 percent—and that’s before inflation took 3.8 percent. (Decades ago, when I was a young analyst in Canada, we would compare everything to the five-year government bond yield.) But as real rates rose, gold prices fell. Now the reverse is happening.

Double the Gold Returns under Negative Real Rates?
Most investors look only at nominal interest rates. This is only the tip of the iceberg. The British author and playwright Oscar Wilde wrote: “Nowadays people know the price of everything and the value of nothing.” Along those lines, the smart investors know that money flows to the highest real interest rate.
I call this the Fear Trade.
“When real rates are negative, gold returns tend to be twice as high as the long term average,” the World Gold Council (WGC) writes in a new report this week. “Even if real rates are positive and as long as they are not significantly high (4 percent in our study), average gold returns remain positive.”
Negative rates erode confidence in fiat currencies, which typically has benefited gold. A currency itself, gold is “the only one that is not targeted directly by, and doesn’t respond negatively to, expansionary monetary policies,” the WGC writes.
The chart below shows the difference in the nominal and real yield curves for government bonds in a number of advanced economies. When you factor in inflation, investors of shorter-term government debt are actually paying the government to hold their money, a proposition that’s hard to swallow.

The WGC points out that about 30 percent of global sovereign debt is now trading with subzero yields. That’s $8 trillion! A further 40 percent has yields below 1 percent.
|
This is just the latest reason why investors have been losing faith in central banks. In its most recent quarterly report, the Bank for International Settlements (BIS) noted that investors’ “confidence in central banks’ healing powers has—probably for the first time—been faltering,” as it becomes more and more clear that room for additional policymaking is narrowing. If asset-buying programs, helicopter drops of money and negative interest rate policies fail to reverse the economic slowdown, what more is there?
These conditions have led to a surge in gold coin and bullion sales around the world. American Eagle consumers bought 83,500 ounces of the coin in February, a 351 percent increase from the 18,500 ounces sold in the previous February. The Perth Mint in Australia is also reporting huge sales volumes.
Retail Investors Missing out on the Gold Rush
Interest in gold bullion, however, hasn’t seemed to translate fully into renewed interest in gold miners. So far this year, inflows into the SPDR Gold Trust (GLD), which invests in physical bullion, have accelerated as investors chase the rally.
|
At the other end is the Market Vectors Junior Gold Miners ETF (GDXJ), which holds junior gold equities such as Northern Star, OceanaGold and Evolution Mining. Despite an increase in share price, we’ve seen a net decrease in shares outstanding. Year-to-date, outflows have totaled $84 million. Flows out of the Market Vectors Gold Miners ETF (GDX), which holds senior gold stocks, have been even more dramatic, at $94 million.

This could be explained by investors taking profits off the table, unease with the volatile swings in the gold market lately or mistrust in mining stocks. In any case, many investors could be missing out on one of the most impressive gold rallies in a generation. Since the start of the year, Goldcorp has gained 38 percent, Randgold 45 percent, Barrick Gold 84 percent, Harmony Gold 300 percent.
Good News! Global Manufacturing Turns Up
Another concern investors have right now is over the health of the global economy. Since February 2014, we’ve seen the J.P.Morgan Global Manfacturing Purchasing Managers’ Index (PMI) trend steadily downward.
For March, however, the PMI came in at 50.3, a slight improvement from the neutral February reading of 50. The monthly reading also rose above the three-month moving average, a bullish signal.

We use PMI data as a gauge for commodity price movements three and six months out, and I write about PMI often.
The U.S. Manufacturing ISM—the American version of PMI—showed improvement, rising from 49.5 in February to 51.8 in March, the first time it expanded in seven months. New Orders strengthened in particular, gaining 6.8 percentage points to register 58.3 last month. Meanwhile, the Markit Eurozone Manufacturing PMI edged up slightly to 51.6, from 51.2 in February.
China, on the other hand, continues to exhibit deterioration. Although the Caixin China General Manufacturing PMI rose to 49.7 in March from 48 in February, the reading is still below the key 50 benchmark that separates contraction and expansion.
In Memoriam: Ian McAvity
It’s with a heavy heart that I share with you the passing of one of my friends and mentors, Ian McAvity. Ian spent his career in minerals and mining, most recently in the role of president and CEO of Toronto-based exploration company Duncan Park.
In past years, I quoted often from Ian’s insightful and widely-read newsletter, “Deliberations on World Markets,”which he began writing in 1972 and for which he was known as a “chartist extraordinaire.” He was an occasional contributor to some of our publications and in 2010 he joined me on a webcast following the midterm elections.
Most people remember Ian as a witty writer and speaker—he coached me on my public speaking—and as a regular contributor to Barron’s Roundtable, the Contrary Opinion Forum, “Louis Rukeyser’s Wall Street” and other well-regarded investment publications and associations, along with industry giants such as Gary Shilling, Ned Davis and Ray Dalio.
What many might not know about him is that he was a gifted athlete, a World Doubles Champion in squash during the 1970s. The first time I went skiing was with Ian, in fact. I fell down so many times, but he would always pause and wait for me to catch up.
Not only did Ian guide me in my public speaking but he also stressed to me the importance of technical analysis on a macro level, from moving averages to relative strengths of countries. He also cultivated my interest in gold. I read Roy Jastram’s “The Golden Constant,” a seminal work on the economics of the precious metal, just so I could keep up with Ian—like skiing. He was just one of those great influencers who taught me much of what I know today, and I only have gratitude for his wisdom and guidance.
Index Summary
- The major market indices finished up this week. The Dow Jones Industrial Average gained 1.58 percent. The S&P 500 Stock Index rose 1.81 percent, while the Nasdaq Composite climbed 2.95 percent. The Russell 2000 small capitalization index gained 3.53 percent this week.
- The Hang Seng Composite gained 0.75 percent this week; while Taiwan was down -0.98 percent and the KOSPI fell -0.62 percent.
- The 10-year Treasury bond yield fell 13 basis points to 1.77 percent.
Domestic Equity Market
Strengths
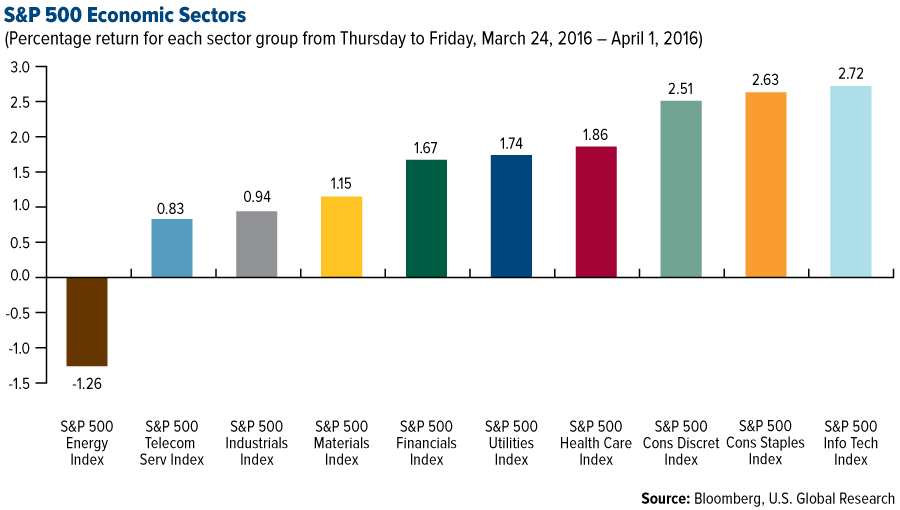
- Information technology was the best performing sector for the week, increasing by 2.72 percent versus an overall increase of 1.87 percent for the S&P 500.
- CSRA was the best performing stock for the week, increasing 11.95 percent. The stock received a rating upgrade by Zack’s Investment Research and was initiated with an “outperform” rating by RBC Capital. The company also recently disclosed a quarterly dividend.
- MetLife won a suit in U.S. federal court against the Financial Stability Oversight Council, which had designated the firm a systemically important financial institution, or SIFI. An SIFI designation brings regulatory burdens. A number of other non-bank firms like General Electric and Prudential Financial are seeking to shed the SIFI label.
Weaknesses
- Energy was the worst performing sector for the week, falling by -1.26 percent versus an overall increase of 1.87 percent for the S&P 500.
- Tesoro was the worst performing stock for the week, falling -10.31 percent. The company plans to spend $400 million upgrading its Anacortes refinery to add a xylene extraction facility, which could pose serious environmental risks.
- In another sign of diminished risk appetites, the market for initial public offerings in the United States just posted its slowest quarter since the first quarter of 2009, the very depths of the global financial crisis. Activity slowed to a crawl, both in terms of the number of deals and the dollar value of new issues, according to Dealogic.
Opportunities
- According to BCA, both valuation and technical factors argue for a bullish reversal in health care stocks. The group’s relative valuation gauge is at an extremely undervalued level, while technical conditions are deeply oversold. These conditions are unlikely to last if relative forward earnings keep climbing, as is expected.
- Mixed data on housing turnover and new home prices have created some uncertainty surrounding the S&P Homebuilders Index over the past year, but there is still robust upside potential. Home prices are recovering after experiencing volatility in recent quarters, but not to the extent that affordability has been compromised. In fact, the Fed’s dovish shift has helped push down long-term Treasury yields, further depressing mortgage rates and supporting housing affordability.
- Defensive sector strength has been almost entirely earnings driven, as measured by the steady upward march in relative forward earnings estimates. This stands in contrast to cyclical sectors which have experienced a steady decline in relative forward profit estimates. As such, defensive sectors should continue to outperform on a relative basis.
Threats
- One of the main repercussions of low U.S. productivity growth is slower business profit growth.
- A recent study in the Financial Analysts Journal suggests that approximately one in five companies intentionally distort earnings, even while adhering to GAAP – with an average magnitude of 10 percent of reported profits. Declining earnings quality means that valuations are pricier than they appear because the earnings backed by cash flow are overstated.
- Given the tepid pace of economic growth and uncertainty about Fed interest rate action, it will be difficult for earnings multiples to rise further.
The Economy and Bond Market
Strengths
- The U.S. labor market maintained its strength in March, adding 215,000 jobs to the tally of nonfarm payrolls. The unemployment rate rose from 4.9 percent in February to 5.0 percent in March, but the rise was attributed to an increase in the participation rate, which rose to 63 percent of the workforce. Average hourly earnings rose 2.3 percent year-over-year.
- The Institute for Supply Management’s manufacturing purchasing managers’ index rebounded strongly in March, rising to 51.8 from 49.5 in February. The new orders index surged to 58.3 from the February reading of 51.5, a hopeful sign for future production. The manufacturing sector expanded in March for the first time in six months.
- Conference Board consumer confidence rose to 96.2 in March, rebounding from the decline to 94.0 in February.
Weaknesses
- Federal Reserve Chair Janet Yellen pushed back forcefully against a handful of Federal Open Market Committee (FOMC) members who called for a hike in the federal funds rate as early as April. Yellen said the Fed will proceed with caution given concerns over global financial and economic developments. Markets are currently pricing in less than one additional hike between now and the end of the year.
- Personal spending inched up by 0.1 percent month-over-month in February, but was revised down in January to 0.1 percent from 0.5 percent. The goods deficit widened to $62.9 billion in February from $62.2 billion in January.
- Initial jobless claims picked up to 276,000 for the week ending March 26, increasing from 265,000 in the prior week.
Opportunities
- Signs that the U.S. and global economic momentum is stabilizing would reduce the probability that the Fed adopts a prolonged wait-and-see approach. Some of the indicators that could influence perceptions about the economic backdrop next week include the ISM non-manufacturing survey and the global services and composite PMIs (both released on Tuesday).
- Last month’s factory orders report established a trend above the three-month moving average. The odds favor a positive report next week which would carry on the momentum from this week’s ISM survey.
- A strong Job Openings and Labor Turnover (JOLTS) report next week would confirm this week’s employment figures and reassure investors the job market is on solid footing.
Threats
- According to BCA, junk spreads no longer appear cheap relative to expected future defaults.

- The durable goods latest monthly reading remains below the three-month trend. Consequently, Monday’s report favors a weak reading.
- Wholesale inventories (reported next Friday) are expected to fall by 0.2 percent, a reversal from last month’s 0.3 percent gain.
Gold Market
For the holiday extended week spot gold closed at $1,222.50, up $5.71 per ounce, or 0.47 percent. Gold stocks, as measured by the NYSE Arca Gold Miners Index, rose by 3.46 percent. Junior miners underperformed seniors for the week as the S&P/TSX Venture Index traded up just 0.23 percent. The U.S. Trade-Weighted Dollar Index dropped 1.61 percent for the holiday extended week.
| Date | Event | Survey | Actual | Prior |
|---|---|---|---|---|
| Mar-29 | Hong Kong Export YoY | -5.2% | -10.4% | -3.8% |
| Mar-29 | U.S. Consumer Confidence Index | 94.0 | 96.2 | 94.0 |
| Mar-30 | Germany CPI YoY | 0.1% | 0.3% | 0.0% |
| Mar-30 | U.S. ADP Employment Change | 195k | 200k | 205k |
| Mar-31 | Eurozone CPI Core YoY | 0.9% | 1.0% | 0.8% |
| Mar-31 | U.S. Initial Jobless Claims | 265k | 276k | 265k |
| Mar-31 | Caixin China PMI Mfg | 48.3 | 49.7 | 48.0 |
| Apr-1 | U.S. Change in Nonfarm Payrolls | 205k | 215k | 245k |
| Apr-1 | U.S. ISM Manufacturing | 51.0 | 51.8 | 49.5 |
| Apr-4 | U.S. Durable Goods Orders | -2.8% | — | -2.8% |
| Apr-7 | U.S. Intial Jobless Claims | 270k | — | 276k |
Strengths
- The best performing precious metal for the week was platinum, up 0.94 percent. This is the second week platinum has led the precious metals group, with gold coming in as the second-best performer, up 0.46 percent. In Zimbabwe which has significant platinum group metal mines, a deadline for all firms to transfer most of their shares to black Zimbabweans has passed with the close of the quarter, but it is now clear how many companies have complied.
- Gold is had its best quarterly rally in 30 years, reports Bloomberg, as demand for haven assets continue to surge. The precious metal got a boost following Janet Yellen’s remarks this week stating that the Federal Reserve will proceed “cautiously” with rate hikes this year. Gold investors have also poured money into gold ETFs at the fastest pace since 2009, with negative rates in Europe boosting its appeal as seen in the chart below.

- In February, China’s imports of gold from Hong Kong increased from the smallest level since 2011, reports Bloomberg. The Perth Mint also reported strong data this week, with minted bar sales coming in at 47,948 ounces for March compared with 37,063 ounces in February.
Weaknesses
- The worst performing precious metal for the week was palladium, down -1.32 percent. In February palladium prices dipped 1.1 percent to around $495 an ounce.
- Data from the Commodity Futures Trading Commission this week shows investors increased net long positions on the COMEX for the third consecutive week, pushing it to the highest since February 2015. Precious Metals Weekly writes that this positioning could limit the upside momentum in the near-term, however the net positioning has considerable room to increase and reach 2010/2011 peaks.
- Gold wiped out March’s gains on the back of a strengthening U.S. labor market. ADP Research Institute reported 200,000 workers brought on in March, while the Labor Department reported Friday that payrolls grew by 215,000 workers. Demand for the precious metal could also fall in the March quarter, according to Reuters Mumbai. Higher prices along with a jeweler strike in India that has been continuing in several parts of the country for its thirtieth day, curbed sales in the world’s second-biggest consumer.
Opportunities
- Research firm Metals Focus says that the bear market in gold is over, and sees the metal rallying to $1,350 an ounce. The group believes a changing investor sentiment in the first quarter will solidify the melt away in months ahead. “Confidence in central banks has been shaken and there are mounting concerns towards the increasing number of negative policy rates around the world,” the company stated Thursday.
- The world’s largest asset manager, BlackRock, and PIMCO are both recommending inflation-linked bonds and gold, according to ZeroHedge, warning that costs are poised to pick up and there is a growing risk of inflation. BlackRock believes stabilizing oil prices and a tighter labor market could be contributors. BCA Research also pointed out this week the gap between consumers’ realized and expected inflation. A divergence here could mean a wave of investors will flock to gold when and if their expectations are not in line with the realized data which show core inflation rising over the last two month.
- Calibre Mining Corp. and Centerra Gold released results this week from their La Luz Gold Project in Nicaragua – drill results show 53.7 meters grading 10.47 grams per ton. In the announcement, President and CEO Greg Smith stated, “This new high-grade intercept at Cerro Aeropuerto together with the previously released intercept of 71.05 meters grading 2.89 g/t highlights the potential for additional discoveries within the historic portion of the La Luz Project.” Nicaragua is significantly underexplored but Calibre has been one of the early movers in that country.
Threats
- Jeffrey Christian, managing partner at CPM, stated in an interview that he believes bullion will drop more than 7 percent to $1,130 an ounce by September, according to Bloomberg. His outlook, which is in-line with Goldman Sachs, looks at a strengthening U.S. economy (which could cause investors to reevaluate their economic pessimism and their need for gold).
- Gold Fields Mineral Services, a research unit of Thomson Reuters, stated in an email report this week that it thinks the gold rally will prove to be short lived and sees the metal dropping to under $1,200 an ounce. The statement went on to say, “Once current market turbulence starts to ease we are likely to see the price retreat again.”
- Commodity prices could fall as investors rush for the exits, warns Barclays Plc. Bloomberg reports that the group sees commodities, including oil and copper, at a risk of steep declines as recent advances aren’t fully grounded in improving fundamentals.
Energy and Natural Resources Market
Strengths
- Strong manufacturing purchasing managers’ index (PMI) data released Friday should support commodity demand into the spring. China’s manufacturing activity rebounded in March, influenced by major structural reforms announced in February. Similarly, U.S. and Global PMI readings showed expansionary numbers, suggesting the positive momentum should continue.
- The best performing sector for the week was the S&P 500 Paper and Forest Index. A steady rise in lumber prices led to a 6.8 percent rally in the sector. Lumber prices have rebounded thanks to an early spring, enabling builders to start up sooner this year.
- The best performing stock for the week in the broader natural resource space was Thyssenkrupp AG. The German steel manufacturer rallied 15.3 percent on speculation that it may merge with India’s Tata Steel in an effort to create a stronger company to better weather the weak demand environment in Europe.
Weaknesses
- Copper prices have stalled as premiums paid by Chinese buyers collapsed to 2012 levels. The lower fees likely reflect weaker demand being met by a significant build in Shanghai warehouse inventories. “China is well-stocked for copper and we don’t feel the real end-use demand is running high enough to absorb all of that material,” Vanessa Davidson, CRU’s copper research director told Bloomberg.
- The worst performing sector for the week was the S&P 500 Oil & Gas Refining Index. The index of the four major U.S. refiners dropped 3.8 percent for the week after a weekly EIA report showed a surprising rebound in refining utilization. This indicates that a greater-than-expected volume of refined product may hit the market in the short term.
- The worst performing stock for the week in the S&P Global Natural Resources Index was Fibria Celulose. The Brazilian producer of pulp posted an 8.7 percent decline for the week as both a JP Morgan downgrade and a strengthening Brazilian real weighed on investor sentiment.
Opportunities
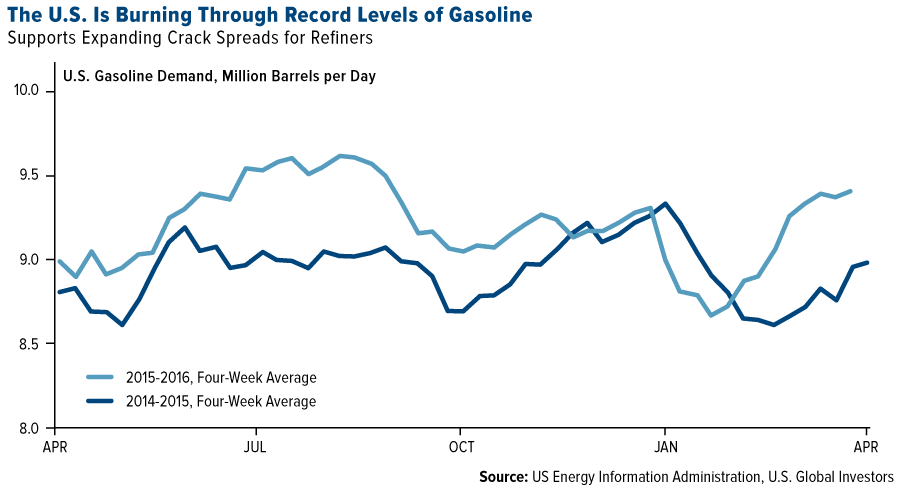
- Cheap prices at the pump are leading U.S. drivers to burn through record levels of gasoline. According to EIA data, the U.S. burned through 9.4 million barrels per day of gasoline last month, an unusually high level for early spring, and 7 percent higher than the same period last year. These levels of demand have resulted in sizeable gasoline inventory draws, which should lend support to crack spreads, and continue to underpin the profitability of U.S.-based refiners.
- The U.S. dollar continues to be under pressure following “dovish” comments from Federal Reserve Chair Janet Yellen this week. Yellen quelled expectations that the bank may hike rates soon and noted that extreme caution is required not to derail the recovery. Hopes of U.S. rates staying lower for longer are generally negative for the U.S. dollar, but positive for risk assets, especially commodities.
- Oil prices may double by next year according to hedge fund manager Pierre Andurand. A former Goldman Sachs oil trader, Andurand has returned 36 percent annualized since 2008 making successful short and long calls on oil. He believes lack of spare capacity in the system will lead oil to trade back to $80 a barrel.
Threats
- Barclay’s warns investors that the rally in commodities has overshot fundamentals and poses a risk that investors may “rush for the exits.” With commodity investment products scoring $20 billion in net inflows between January and February, any set back could result in a sharp reversal and liquidation of billions of dollars in commodity-related assets.
- The OPEC, non-OPEC joint output freeze is at risk as Saudi Arabia says the accord hinges on Iran. The April 17 meeting, which Iran has previously announced it won’t take part in, may not conclude with tangible supply agreements. Saudi Arabia suggests it won’t agree to a deal that allows any of its competitors to gain market share, in clear reference to Iran.
- Oil prices may continue to weaken as OPEC oil output rises. OPEC output rose to 32.47 million barrels per day in March from 32.37 million the prior month, as Iran/Iraq growth offsets outages, according to a Reuters report. In addition, Saudi Arabia announced it will restart its Khafji joint venture with Kuwait, which may result in an additional 300,000 barrels per day coming to the market.
China Region
Strengths
- Manufacturing purchasing managers’ index (PMI) data in China came in much better than expected, rising to 50.2 from a prior 49.0 and beating expectations for 49.4. The Caixin China Manufacturing PMI also came in stronger at 49.7, up from a prior 48.0.
- Currencies around the region rallied against the U.S. dollar in March. South Korea and Malaysia were the strongest for the month, rising more than 8 and 7 percent respectively.

- Chinese industrial profits picked up for the most recent measurement period, rising 4.8 percent year-over-year, for the first uptick in seven months. Industrial production in South Korea also rebounded strongly for the February period.
Weaknesses
- S&P downgraded China’s debt outlook to negative from stable.
- Boer Power Holdings Ltd. (1685 HK) missed earnings and fell more than 30 percent on Thursday.
- One of the units of Guosen Securities, a large Chinese SOE investment bank, defaulted on a renminbi-denominated bond, calling further attention to the situation with Chinese debt.
Opportunities
- Caixin China Services PMI is coming up next week, as well as the composite reading. The government’s reading of Non-Manufacturing PMI rose for the March period to 53.8.
- China’s pension fund is expected to begin investing in A-shares later this year in a move that could bring nearly $100 billion to the mainland market.
- Japan’s Prime Minister Shinzo Abe continues to hint at forthcoming stimulus ahead of the G7 Summit.
Threats
- The Chinese government announced steps this week to cool the housing markets in Shanghai and Shenzhen. Policymakers will closely watch rising prices in first-tier markets in addition to divergence in the pace of housing gains between first-and lower-tier cities.
- Future U.S. Fed policy and rate decisions may weigh heavily upon regional emerging markets in the Asia Pacific region.
- Well, if you wanted to visit the new Shanghai Disneyland on opening day and don’t already have tickets, you missed your chance: tickets sold out within a matter of hours after going on sale. Better luck next time!
Emerging Europe
Strengths
- Hungary was the best performing country this week, gaining 3.4 percent. The budget gap for 2015 was posted at 1.9 percent of GDP versus 2.3 percent the year prior. Bank of America sees Fitch lifting Hungary’s credit rating to investment grade in May, along with the central bank of Hungary cutting its main interest rate two more times by the end of this quarter.
- The Polish zloty was the best performing currency this week, gaining 2.3 percent against the U.S. dollar. March Manufacturing purchasing managers’ index (PMI) data was reported at 53.8 versus an estimated 52.6. Poland’s general government budget deficit was reported at 2.5 percent of GDP and public sector debt was reported at 51.5 percent.
- The financial sector was the best performing sector among Eastern European markets this week.
Weaknesses
- Russia was the worst performing market this week, losing -0.51 percent. Brent crude oil declined 4.5 percent and is once again trading below $40 per barrel. March Manufacturing PMI was reported at 48.3, weaker than the expectation of 49.5.
- The Ukrainian hryvnia was the worst performing currency this week, losing 38 basis points against the U.S. dollar. HSBC sees the hryvnia gaining to 25 against a dollar by year end on stronger capital inflows, assuming the political backdrop has stabilized. On Friday the hryvnia was trading around 26 against the dollar.
- Consumer staples was the worst performing sector among Eastern European markets this week.
Opportunities
- This week Federal Reserve Chair Janet Yellen said the central bank should proceed “cautiously” on raising interest rates, creating more appetite for more risky assets. After the dovish comments were made, emerging market currencies and equities surged. Fed officials left the benchmark lending rate target unchanged this month at 0.25 percent to 0.5 percent. They revised down the median estimate for the number of rate increases that will be warranted this year to two hikes from four projected in December.
- The Russian Property Agency prepared a draft resolution increasing the recommended pay-out for state controlled companies from 25 percent to 50 percent. According to RenCap Securities, the main positive is that the government is looking to get more dividends from state companies, meaning higher returns for minorities and less risk of higher taxes in the short term.
- Poland’s economic sentiment is at its second highest level since 2011. It climbed to 99.8 in March, close to a five-year high and above the 97.3 long-term average. Poland’s Law and Justice (PiS) Party, which won the parliamentary election last October, has treated the public to a PLN23 billion (around 1.3 percent of GPD) cash injection for families.
Threats
- Total tourism arrivals to Turkey declined by 10.3 percent year-over-year to 1.24 million in February. Air traffic to summer vacation destinations like Antalya and Mugla was hurt by current negative sentiment along with the travel ban by Russia. Within the national breakdown of arriving tourists, a 52 percent decline was observed from Russia and a 10 percent decline from Germany. A rise of tourists was observed from Georgia however, making it the number-one source of tourism for the first time in February.
- Eurozone economic confidence fell in March for a third month, running to a 13-month low. This indicates that the recovery may be losing pace. In the monthly assessment, the European Commission said its economic sentiment indicator fell .9 points to 103. This was a larger fall than anticipated.

- The European Central Bank (ECB) is approaching the limits of its monetary policy. Further expansion of its asset-purchase program could give rise to legal and financial stability, Governing Council member Klaas Knot said. He further pointed out that the marginal benefits of taking more measures are diminishing. “Technically it’s always possible to do more, but you have to weigh the added value with the side effects, and I have my doubts about that.”

Leaders and Laggards
| Index | Close | Weekly Change($) |
Weekly Change(%) |
|---|---|---|---|
| DJIA | 17,792.75 | +277.02 | +1.58% |
| S&P 500 | 2,072.78 | +36.84 | +1.81% |
| S&P Energy | 456.00 | -5.84 | -1.26% |
| S&P Basic Materials | 283.74 | +3.23 | +1.15% |
| Nasdaq | 4,914.54 | +141.04 | +2.95% |
| Russell 2000 | 1,117.68 | +38.15 | +3.53% |
| Hang Seng Composite Index | 2,808.87 | +25.60 | +0.92% |
| Korean KOSPI Index | 1,973.57 | -12.40 | -0.62% |
| S&P/TSX Canadian Gold Index | 184.01 | +3.34 | +1.85% |
| XAU | 69.72 | +2.24 | +3.32% |
| Gold Futures | 1,223.60 | +0.10 | +0.01% |
| Oil Futures | 36.63 | -2.83 | -7.17% |
| Natural Gas Futures | 1.95 | +0.15 | +8.03% |
| 10-Yr Treasury Bond | 1.77 | -0.13 | -6.84% |
| Index | Close | Monthly Change($) |
Monthly Change(%) |
|---|---|---|---|
| DJIA | 17,792.75 | +893.43 | +5.29% |
| S&P 500 | 2,072.78 | +86.33 | +4.35% |
| S&P Energy | 456.00 | +12.44 | +2.80% |
| S&P Basic Materials | 283.74 | +15.73 | +5.87% |
| Nasdaq | 4,914.54 | +211.12 | +4.49% |
| Russell 2000 | 1,117.68 | +52.01 | +4.88% |
| Hang Seng Composite Index | 2,808.87 | +88.59 | +3.26% |
| Korean KOSPI Index | 1,973.57 | +26.15 | +1.34% |
| S&P/TSX Canadian Gold Index | 184.01 | +5.91 | +3.32% |
| XAU | 69.72 | +5.70 | +8.90% |
| Gold Futures | 1,223.60 | -19.00 | -1.53% |
| Oil Futures | 36.63 | +1.97 | +5.68% |
| Natural Gas Futures | 1.95 | +0.27 | +16.27% |
| 10-Yr Treasury Bond | 1.77 | -0.07 | -3.80% |
| Index | Close | Quarterly Change($) |
Quarterly Change(%) |
|---|---|---|---|
| DJIA | 17,792.75 | +367.72 | +2.11% |
| S&P 500 | 2,072.78 | +28.84 | +1.41% |
| S&P Energy | 456.00 | +7.56 | +1.69% |
| S&P Basic Materials | 283.74 | +10.10 | +3.69% |
| Nasdaq | 4,914.54 | -92.87 | -1.85% |
| Russell 2000 | 1,117.68 | -18.20 | -1.60% |
| Hang Seng Composite Index | 2,808.87 | -212.60 | -7.04% |
| Korean KOSPI Index | 1,973.57 | +12.26 | +0.63% |
| S&P/TSX Canadian Gold Index | 184.01 | +54.48 | +42.06% |
| XAU | 69.72 | +24.42 | +53.91% |
| Gold Futures | 1,223.60 | +162.10 | +15.27% |
| Oil Futures | 36.63 | -0.41 | -1.11% |
| Natural Gas Futures | 1.95 | -0.39 | -16.52% |
| 10-Yr Treasury Bond | 1.77 | -0.50 | -21.98% |
U.S. Global Investors, Inc. is an investment adviser registered with the Securities and Exchange Commission (“SEC”). This does not mean that we are sponsored, recommended, or approved by the SEC, or that our abilities or qualifications in any respect have been passed upon by the SEC or any officer of the SEC.
This commentary should not be considered a solicitation or offering of any investment product.
Certain materials in this commentary may contain dated information. The information provided was current at the time of publication.
Some links above may be directed to third-party websites. U.S. Global Investors does not endorse all information supplied by these websites and is not responsible for their content.
All opinions expressed and data provided are subject to change without notice. Some of these opinions may not be appropriate to every investor.
Holdings are reported as of the most recent quarter-end. The following securities mentioned in the article were held by one or more accounts managed by U.S. Global Investors as of 12/31/2015:
Boer Power Holdings Ltd.
Calibre Mining Corp.
CSRA Inc.
MetLife Inc.
Northern Star
Oceana Gold
Prudential Financial Inc.
Randgold
Tesoro Corp.
The Dow Jones Industrial Average is a price-weighted average of 30 blue chip stocks that are generally leaders in their industry.
The S&P 500 Stock Index is a widely recognized capitalization-weighted index of 500 common stock prices in U.S. companies.
The Nasdaq Composite Index is a capitalization-weighted index of all Nasdaq National Market and SmallCap stocks.
The Russell 2000 Index® is a U.S. equity index measuring the performance of the 2,000 smallest companies in the Russell 3000®, a widely recognized small-cap index.
The Hang Seng Composite Index is a market capitalization-weighted index that comprises the top 200 companies listed on Stock Exchange of Hong Kong, based on average market cap for the 12 months.
The Taiwan Stock Exchange Index is a capitalization-weighted index of all listed common shares traded on the Taiwan Stock Exchange.
The Korea Stock Price Index is a capitalization-weighted index of all common shares and preferred shares on the Korean Stock Exchanges.
The Philadelphia Stock Exchange Gold and Silver Index (XAU) is a capitalization-weighted index that includes the leading companies involved in the mining of gold and silver.
The U.S. Trade Weighted Dollar Index provides a general indication of the international value of the U.S. dollar.
The S&P/TSX Canadian Gold Capped Sector Index is a modified capitalization-weighted index, whose equity weights are capped 25 percent and index constituents are derived from a subset stock pool of S&P/TSX Composite Index stocks.
The S&P 500 Energy Index is a capitalization-weighted index that tracks the companies in the energy sector as a subset of the S&P 500.
The S&P 500 Materials Index is a capitalization-weighted index that tracks the companies in the material sector as a subset of the S&P 500.
The S&P 500 Financials Index is a capitalization-weighted index. The index was developed with a base level of 10 for the 1941-43 base period.
The S&P 500 Industrials Index is a Materials Index is a capitalization-weighted index that tracks the companies in the industrial sector as a subset of the S&P 500.
The S&P 500 Consumer Discretionary Index is a capitalization-weighted index that tracks the companies in the consumer discretionary sector as a subset of the S&P 500.
The S&P 500 Information Technology Index is a capitalization-weighted index that tracks the companies in the information technology sector as a subset of the S&P 500.
The S&P 500 Consumer Staples Index is a Materials Index is a capitalization-weighted index that tracks the companies in the consumer staples sector as a subset of the S&P 500.
The S&P 500 Utilities Index is a capitalization-weighted index that tracks the companies in the utilities sector as a subset of the S&P 500.
The S&P 500 Healthcare Index is a capitalization-weighted index that tracks the companies in the healthcare sector as a subset of the S&P 500.
The S&P 500 Telecom Index is a Materials Index is a capitalization-weighted index that tracks the companies in the telecom sector as a subset of the S&P 500.
The NYSE Arca Gold Miners Index is a modified market capitalization weighted index comprised of publicly traded companies involved primarily in the mining for gold and silver.
The Consumer Price Index (CPI) is one of the most widely recognized price measures for tracking the price of a market basket of goods and services purchased by individuals. The weights of components are based on consumer spending patterns.
The Purchasing Manager’s Index is an indicator of the economic health of the manufacturing sector. The PMI index is based on five major indicators: new orders, inventory levels, production, supplier deliveries and the employment environment.
The S&P/TSX Venture Composite Index is a broad market indicator for the Canadian venture capital market. The index is market capitalization weighted and, at its inception, included 531 companies. A quarterly revision process is used to remove companies that comprise less than 0.05% of the weight of the index, and add companies whose weight, when included, will be greater than 0.05% of the index.
The ISM manufacturing composite index is a diffusion index calculated from five of the eight sub-components of a monthly survey of purchasing managers at roughly 300 manufacturing firms from 21 industries in all 50 states.
The S&P Homebuilders Select Industry Index is an equal-weighted index that draws constituents from the GICS Homebuilders sub-industry.
The Conference Board index of leading economic indicators is an index published monthly by the Conference Board used to predict the direction of the economy’s movements in the months to come. The index is made up of 10 economic components, whose changes tend to precede changes in the overall economy.
The ISM Nonmanufacturing index based on surveys of more than 400 non-manufacturing firms’ purchasing and supply executives, within 60 sectors across the nation, by the Institute of Supply Management (ISM). The ISM Non-Manufacturing Index tracks economic data, like the ISM Non-Manufacturing Business Activity Index. A composite diffusion index is created based on the data from these surveys that monitors economic conditions of the nation.
The S&P Supercomposite Paper & Forest Products Index is a capitalization-weighted index.
The S&P Supercomposite Oil & Gas Refining & Marketing Index is a capitalization-weighted index. The index is comprised of the stocks in the oil & gas refining & marketing sub-industry.
The S&P Global Natural Resources Index includes 90 of the largest publicly-traded companies in natural resources and commodities businesses that meet specific investability requirements, offering investors diversified, liquid and investable equity exposure across 3 primary commodity-related sectors: Agribusiness, Energy, and Metals & Mining.
The S&P/TSX Venture Composite Index is a broad market indicator for the Canadian venture capital market. The index is market capitalization weighted and, at its inception, included 531 companies. A quarterly revision process is used to remove companies that comprise less than 0.05% of the weight of the index, and add companies whose weight, when included, will be greater than 0.05% of the index.
Thee Caixin China Manufacturing PMI, released by Markit Economics, is based on data compiled from monthly replies to questionnaires sent to purchasing executives in over 400 private manufacturing sector companies.
The European Commission Economic SentiMent Indicator Eurozone is a monthly indicator that reflects general economic activity of the EU. The indicator combines assessments and expectations stemming from business and consumer surveys. Such surveys include different components of the economy: industry, consumers, constructions and retail trade.


