“Davidson” submits:
Little understood is the relationship between the Fed Funds rate and economic activity. Many opinions tend to obscure what has actually occurred over our financial history. Once one has examined the many data series available, only one relationship stands out from the rest. The Fed Funds-T-Bill Rate Spread has been the best forecaster of Fed Funds over time regardless of what the Fed Chairperson indicates or numerous Fed Governors forecast.
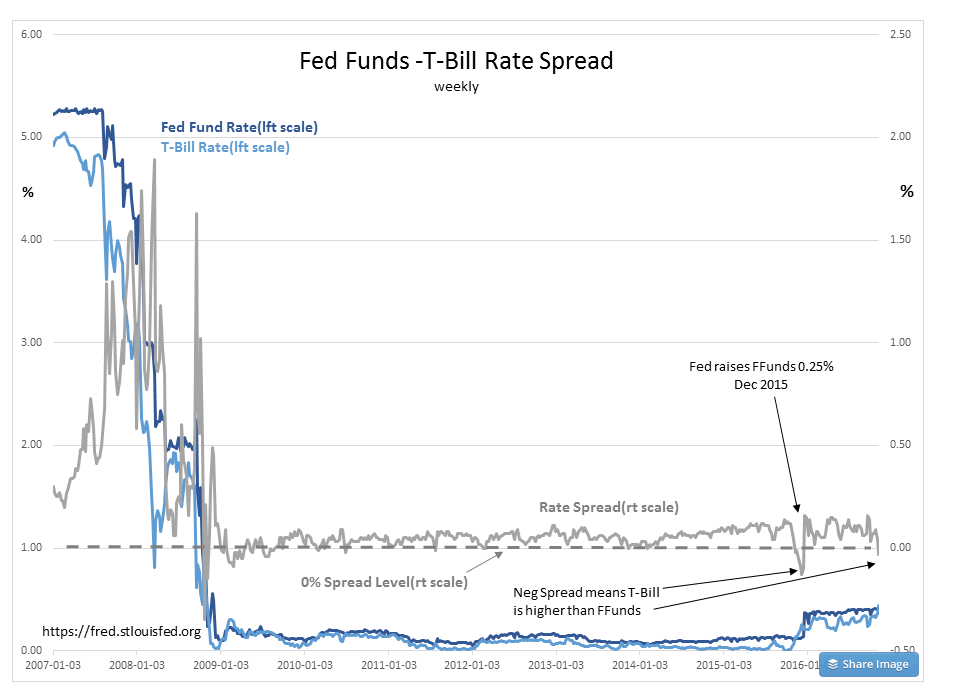
In the chart of weekly data Fed Funds -T-Bill Rate Spread, the Fed Funds rate is represented by the DARK BLUE LINE, the T-Bill rate by the LIGHT BLUE LINE and the difference, the Rate Spread (Fed Funds minus T-Bill rate) is represented by the GRAY LINE. The DASHED GRAY LINE represents a 0.0% Rate Spread or when Fed Funds rate equals the T-Bill rate.
Historically the Fed has maintained a higher Fed Funds rate than the T-Bill rate. The Fed stands as the last resort for financial institutions if they get themselves in trouble through overly aggressive lending. To borrow from the Fed carries a strong stigma and sends a strong signal to investors that a particular financial institution is weak. For this reason the Fed keeps the Fed Funds higher than T-Bills and has historically adjusted Fed Funds after market demand has caused T-Bill rates to shift. The historical record reveals that the Fed often acts 1mos-2mos after the T-Bill has settled at its new rate. This is because what the Fed does is always a major headline story. They give themselves some time to decide if the T-Bill rate, which is a market rate, has actually set a new level before they act. There was only one instance since WWII where the Fed acted ahead of T-Bill market rates. This occurred in the early 1980s when Chairman Volcker recognized the extreme danger of the inflation-based-spending market psychology. Fear of inflation had resulted in consumers building a high level of debt and spending in order to offset the inflationary destruction of savings. Volcker recognized that the “Natural Rate” (concept of Knut Wicksell, 1898) was much higher with inflation over 12% and so raised Fed Funds as high as 20%. The record shows that he forced Fed Funds to 5%+ higher than T-Bill rates several times till inflation fears ebbed and consumer spending behavior reflected reduced inflation expectations. During the rest of his time as Fed Chairperson, Volcker kept Fed Funds ~1.00% over T-Bill rates. The Fed officials since have tended to follow Volcker’s approach with Greenspan adopting a lower 0.40% spread. A T-Bill rate based approach has been the norm at the Fed since Paul Volcker.
The myth that the Fed controls interest rates misunderstands the nature of Free Markets. The Fed has never been able to control economic activity. It has never prevented ‘investment bubbles’ nor has it ever lowered the cost of funds to stimulate economic activity. Markets have always controlled rates with the Fed following weeks or months later in its Fed Funds adjustments. Investors have always seen Fed action as preemptive because it makes headlines. What investors miss is seeing the Free Market action on T-Bill rates which requires one to seek this data. The chart helps to view this visually.
When the GRAY LINE rises, it means that T-Bill rates had fallen and Fed Funds had yet to catch up. The Rate Spread has widened. This is typical for market corrections when investors are selling stocks and buying T-Bills for safety at a rapid pace. When the GRAY LINE falls, it means that T-Bill rates have risen with Fed Funds lagging. The Rate Spread has narrowed. This is typical when the market demand for capital rises and forces T-Bill rates higher. When the GRAY LINE falls below 0.0% it means that the Fed is offering lending at below market rates and the Fed is pressured to quickly raise the Fed Funds rate. Investors whose focus is only on news headlines and not on economic data only see what the Fed does and not that it is responding to market forces. The Rate Spread fell below 0.0% Dec 2015, the Fed raised the Fed Fund rate by 0.25%. The same condition has occurred today and we should expect 0.25% Fed Fund rate rise as a consequence.
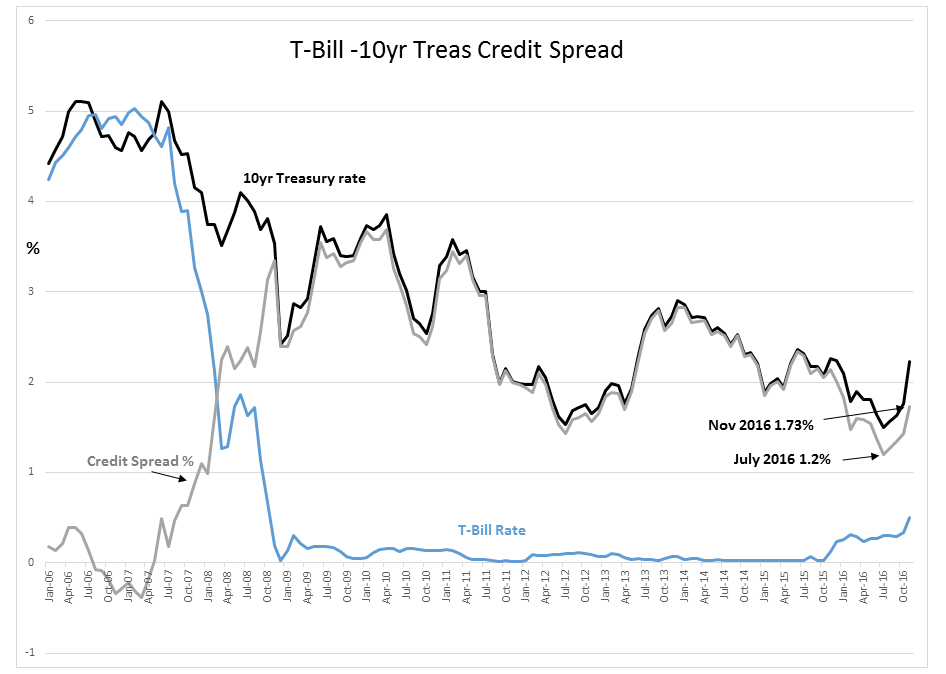
Many will take a Fed Funds rate hike in the current environment as choking off credit availability. They should instead be bullish. The chart T-Bill -10yr Treas Credit Spread reveals that the recent rate rise due to market forces has created a widening credit spread for the T-Bill vs. 10yr Treasury. It is the rate spread between T-Bills and the 10yr Treasury which sets lending profits. The wider the credit spread, the greater the potential profit for lenders all else being even. The narrowing credit spread had narrowed to 1.2% in July. It has now widened to 1.73%. This is indeed good news. Credit availability is expanding!
Summary:
Higher T-Bill rates will force a Fed Funds rate rise shortly. But, 10yr Treasury rates have risen faster than T-Bill rates which translates into better profits for lenders. We should see expanded lending especially for mortgages for a stumbling housing market.
These developments are strongly positive for economic expansion and equity markets.