
I’ve got a proposal for you.
The go-to benchmark in the U.S. is the S&P 500 Index. The financial media compares the returns of all types of investments to the index.

And the S&P 500 has been doing well. Over the past two years, it has gained almost 50%.
What if I told you there is an investment product on the market that offers S&P 500-like returns at a 25% lower cost?
Would you buy the cheaper product?
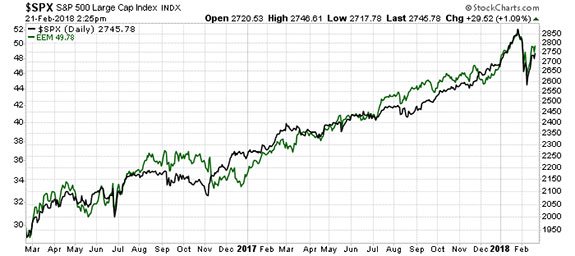
Take a look at a two-year chart of two important global stock indices…
If I didn’t make this chart, I’d have trouble telling the movement of the two indices apart from each other.
It’s important to consider what this chart is telling us...
Coordinated Global Growth
The green line in the above chart reflects the recent movement of the iShares MSCI Emerging Markets Index ETF (NYSE: EEM).
As the chart suggests, over the past two years, EEM and the S&P 500 have made very similar moves. The performance of the two is 97% correlated over this period.
How could that be?
You may have heard the financial news media talk about coordinated global growth. It’s real … and this chart shows the results.
The S&P 500 owns the 500 most widely held U.S. stocks on the New York Stock Exchange or the Nasdaq. The MSCI Emerging Markets Index includes stocks from 24 emerging-market countries. These countries include China, South Korea, Taiwan, India and Brazil. Seven of the top 10 holdings are Chinese.
You can see these indices have been moving in lockstep. But their underlying fundamentals aren’t in lockstep.
Bloomberg reports the price-to-earnings ratio (P/E) of the S&P 500 is 22.1 today, but the MSCI index is only 16.4. That’s almost 26% less than the S&P 500.
The P/E of the MSCI index is 5.5 points less than the S&P 500. This type of discount is uncommon. Since 1995, the P/E of the MSCI index has only been at this level about one-third of the time.
Over this period, the emerging-market index has outperformed the S&P 500 when the discount gets this large. Take a look:
| 3 months | 6 months | 1 year | 2 years | |
| Excess Return | 0.2% | 1.8% | 5.0% | 14.9% |
The above table reflects the difference between returns of the emerging-markets index and the S&P 500 after the indices hit this “discount indicator.”
This is a big deal. The S&P 500 has actually outperformed the MSCI index overall since 1995. However, the MSCI outperforms when it gets to today's levels.
The above returns only reflect price changes. They don’t include dividends. But that doesn’t change the analysis. The MSCI index actually yields more than the S&P 500 today.
We’re in a New Era
Fund flows are more global today.
The Bloomberg station from SiriusXM radio in my car switches to Bloomberg Daybreak: Asia at 6 p.m. EST. I never heard international investing news when I was growing up.
Hedge funds and individual investors alike trade in many more markets than they did before.
And the returns of major indices are more alike than they used to be.
Sometimes, though, the prices of these indices get out of whack. Today is one of those times.
The best way to take advantage of this is to buy the EEM ETF. History shows it should offer returns in excess of the benchmark S&P 500 Index over the next two years.
Good investing,
Brian Christopher
Senior Analyst, Banyan Hill Publishing


