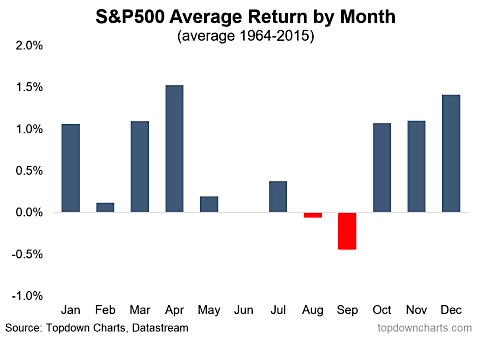
With only a month to go until Christmas it’s time to talk the old chest nut of the Santa Claus rally. The “Santa Claus rally” refers to the tendency for solid gains in theS&P 500 for the month of December.
December is one of the best months of the year on average, performance-wise. The month has posted positive returns 70% of the time for the period of 1964-2015. Each year varies and there are different factors in play. However, in general it has been very good to investors.<

But it’s not just December, it’s the last couple of months of the year that you tend to see solid performance. The chart below shows the seasonal tendency by business day for the S&P 500 from 1990-2015, and maps out how 2016 is tracking against that historical pattern. Interestingly enough for the most part it’s been tracking reasonably closely to its seasonal pattern.
But it’s not just December, it’s the last couple of months of the year that you tend to see solid performance. The chart below shows the seasonal tendency by business day for the S&P 500 from 1990-2015, and maps out how 2016 is tracking against that historical pattern. Interestingly enough for the most part it’s been tracking reasonably closely to its seasonal pattern.
The standout exceptions were the global panic in February, the Brexit outcome in June, and more recently the election jitters. But if history continues to give clues for the future direction, then we could be in for a solid end to the year for the S&P 500.

It’s important to remember those exceptions. Seasonality can be a useful piece to the puzzle, but there are always exceptions. It works better if seasonality lines up with other evidence that confirms the overall case so thatseasonality is a conviction building tool rather than a core thesis.
Given the improving earnings outlook, Trumpnomics confidence effects, still very supportive monetary policy, and room to move higher on sentiment/oscillators/breadth, the positiveseasonalitytends to line up with the overall bullish evidence.
Finally, I’ll leave you with this fun chart of Google search trends by month for Santa Claus rally…

I’m sure many investors will be searching for a Santa Claus rally to fill their stockings!
This article originally appeared onSeeitMarket


