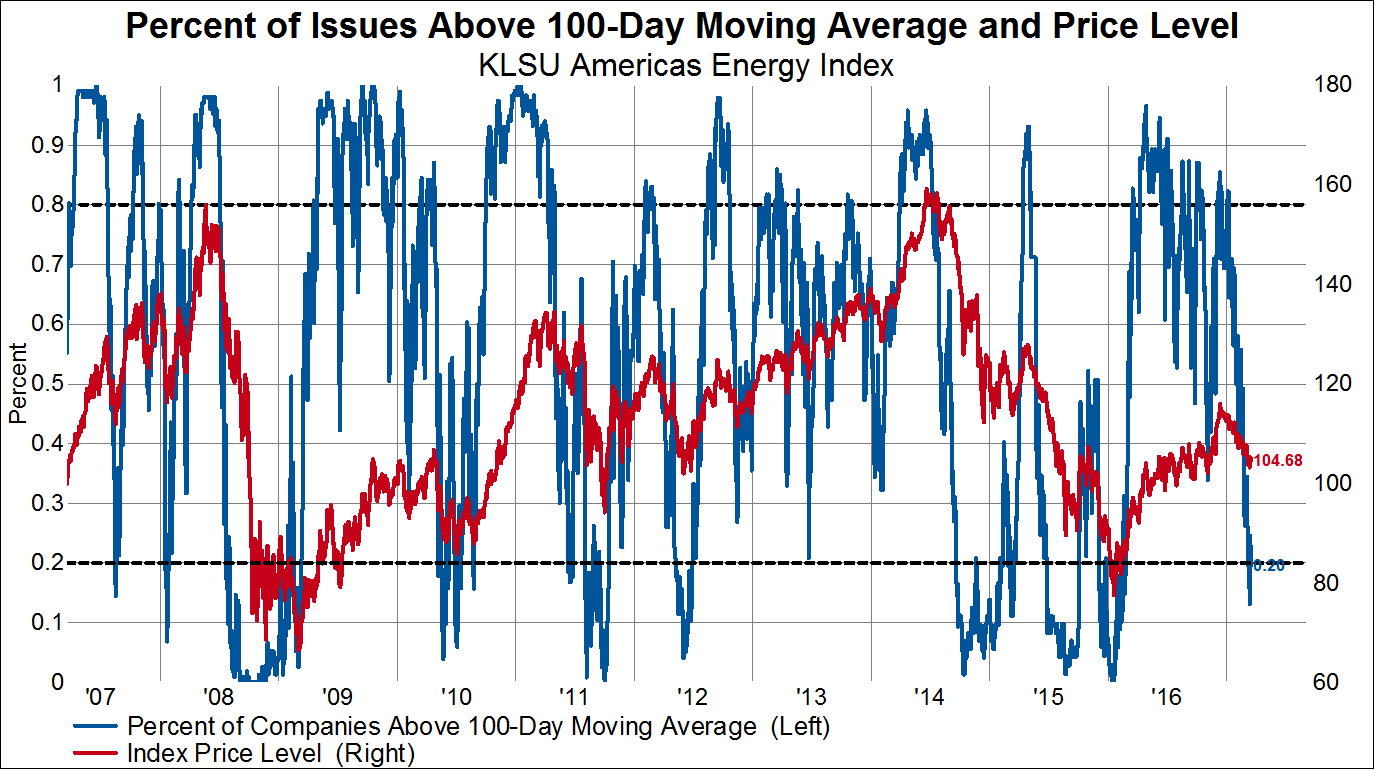
In a market experiencing the largest pullback since the election, investors are rightly looking for places to hide. At present, according to our work, the US energy sector is the only truly oversold sector. In our technical work, when a group reaches less than 20% above a moving average, the terribly negative breadth signals an oversold condition. In the chart below, one can identify intermediate (2010, 2011, 2012…2017?) and major lows in oil prices (2009…2016?) associated with less than 20% of stocks above the moving average. We’re there now, signaling at least an intermediate low in oil prices.
Note to readers: For our indexes, we use the constituents of the Knowledge Leaders Selection Universe (KLSU), which captures the top 85% of the North American energy sector, is market-cap weighted and is rebalanced every March and September. The KLSU indexes are the selection universes for our Knowledge Leaders Indexes.
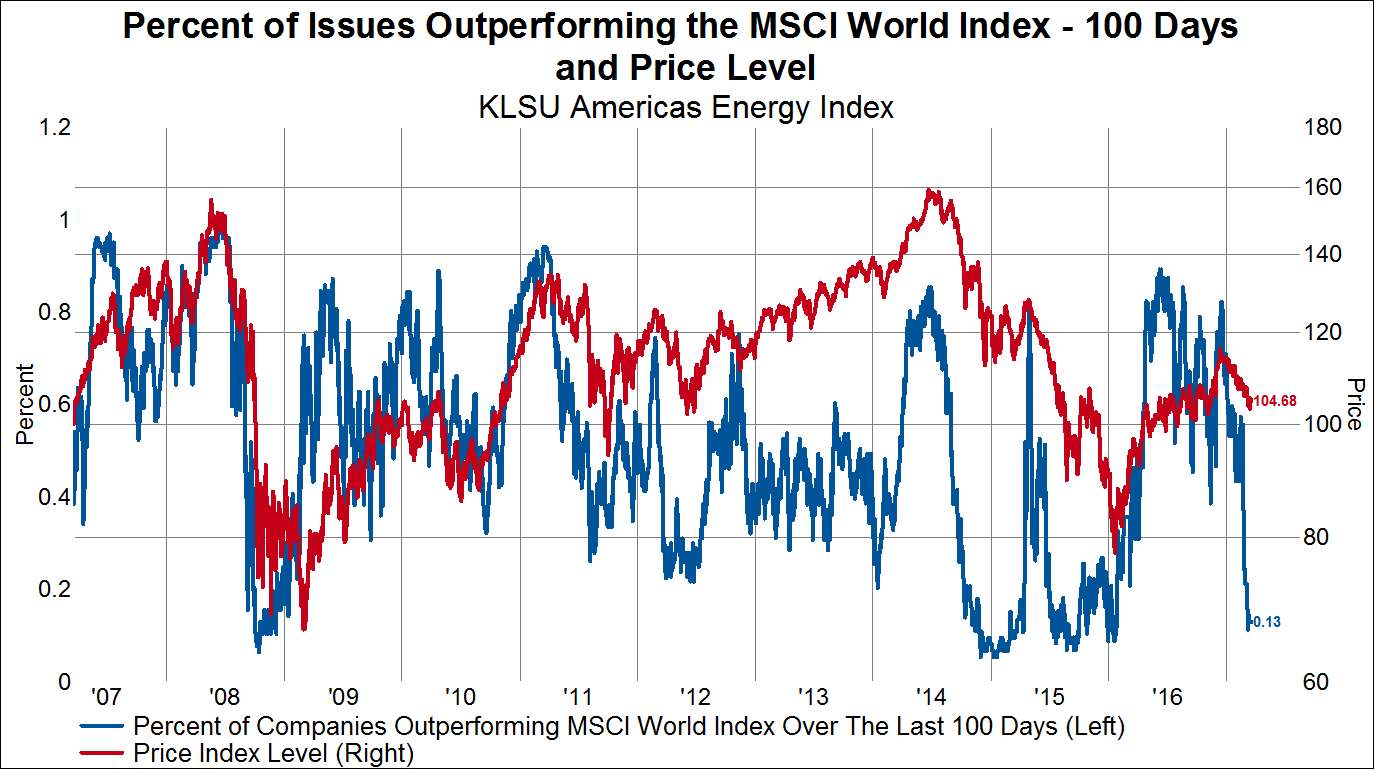
We can also look at the percent of stocks outperforming the MSCI World Index. In North America the percent of stocks in the energy sector that outperformed the MSCI World Index over the last 100 days is only 13%. This is a level associated with past major lows in energy shares, similar to 2008 and 2015.
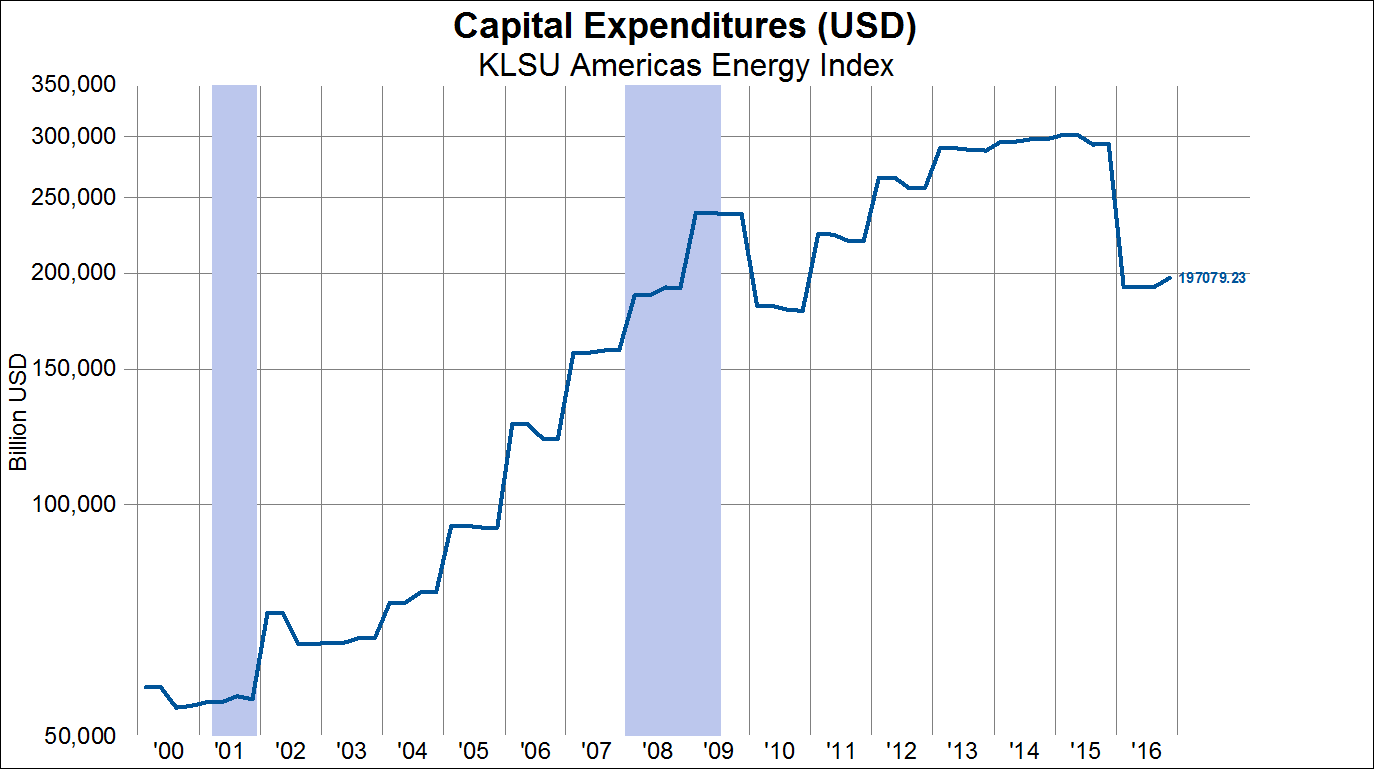
Over the last two years, the components of KLSU Energy Index cut their aggregate capital spending by roughly $100 billion. This 33% drop dwarfs any retrenchment in energy capital spending that occurred in the last two recessions. After the 2008 recession, North American energy capital spending barely dropped 10%.
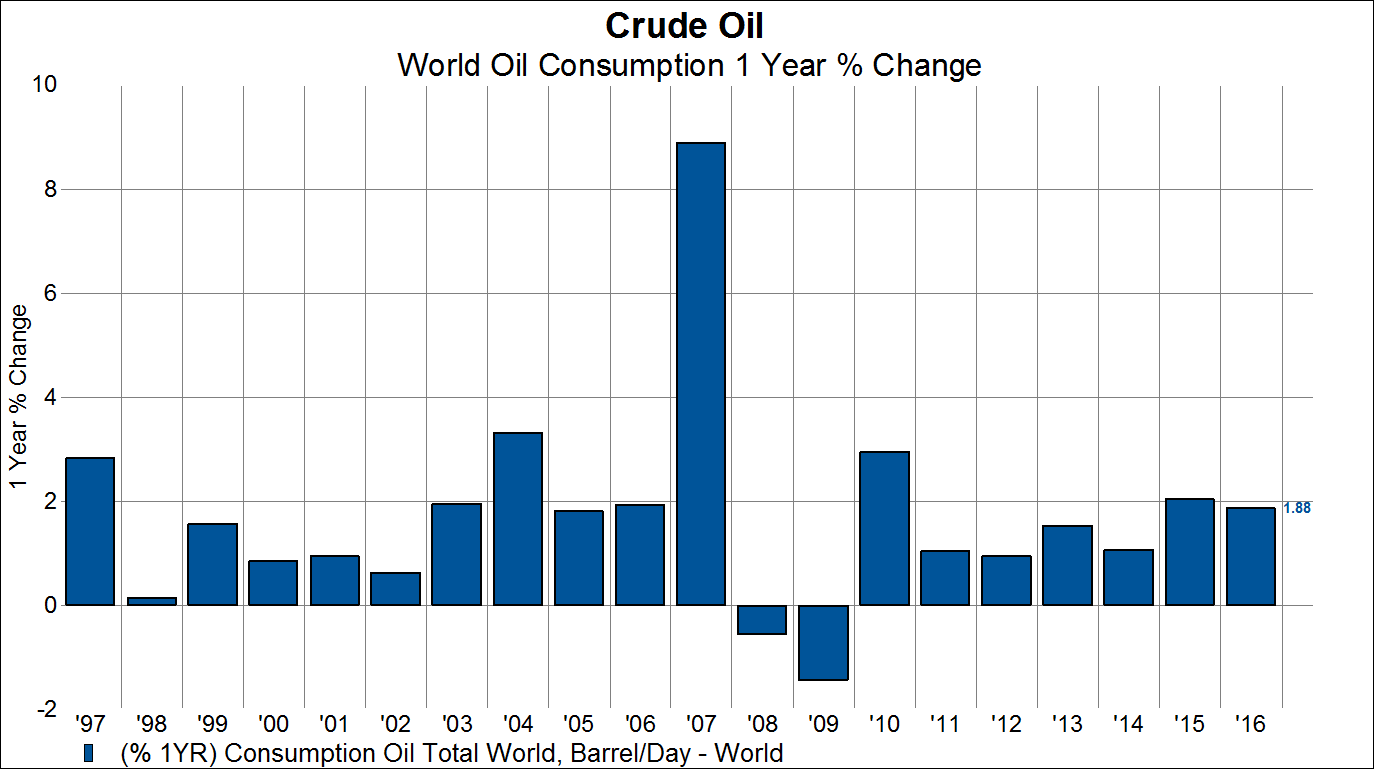
At the same time world oil consumption continues to grow at rates fairly comparable to long-term averages. In 2016 world oil demand eclipsed 95 million barrels/day, up from around 70 million barrels/day as recently as 2000.
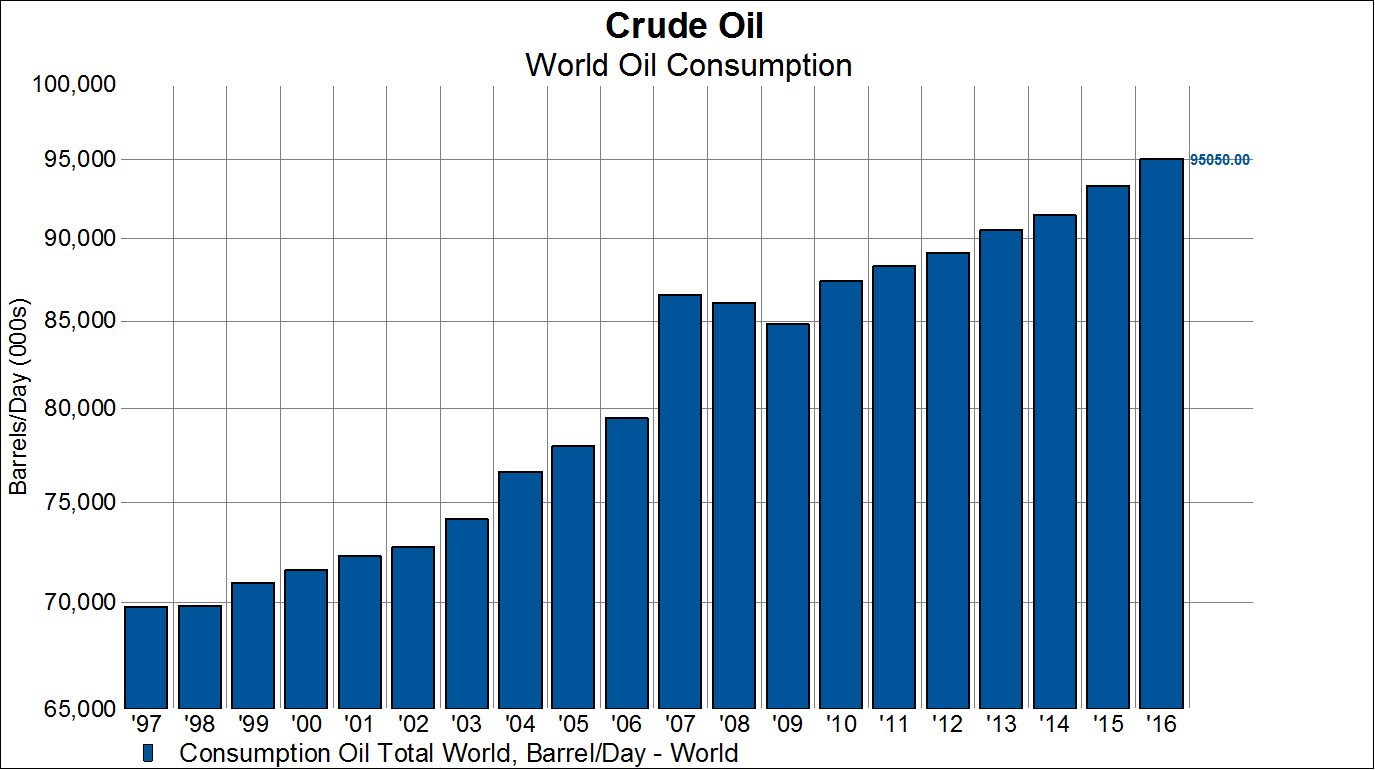
On a rate of change basis, annual oil demand continues to trend around 1.5-2%/year.
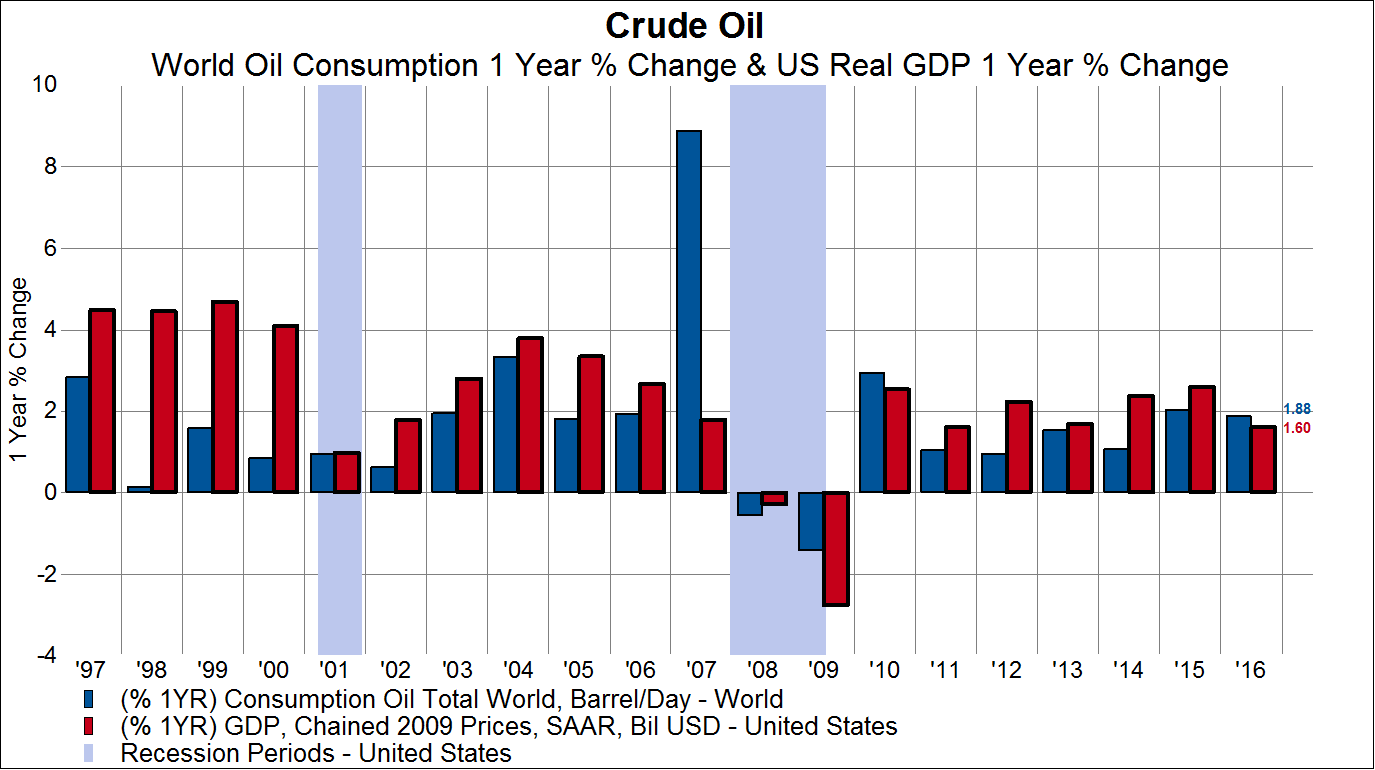
A blunt overlay for annual oil demand is US Real GDP growth. In a 2% US Real GDP environment, global oil demand grows around 1.5%. Should US GDP accelerate, it would likely drag global energy demand up with it.
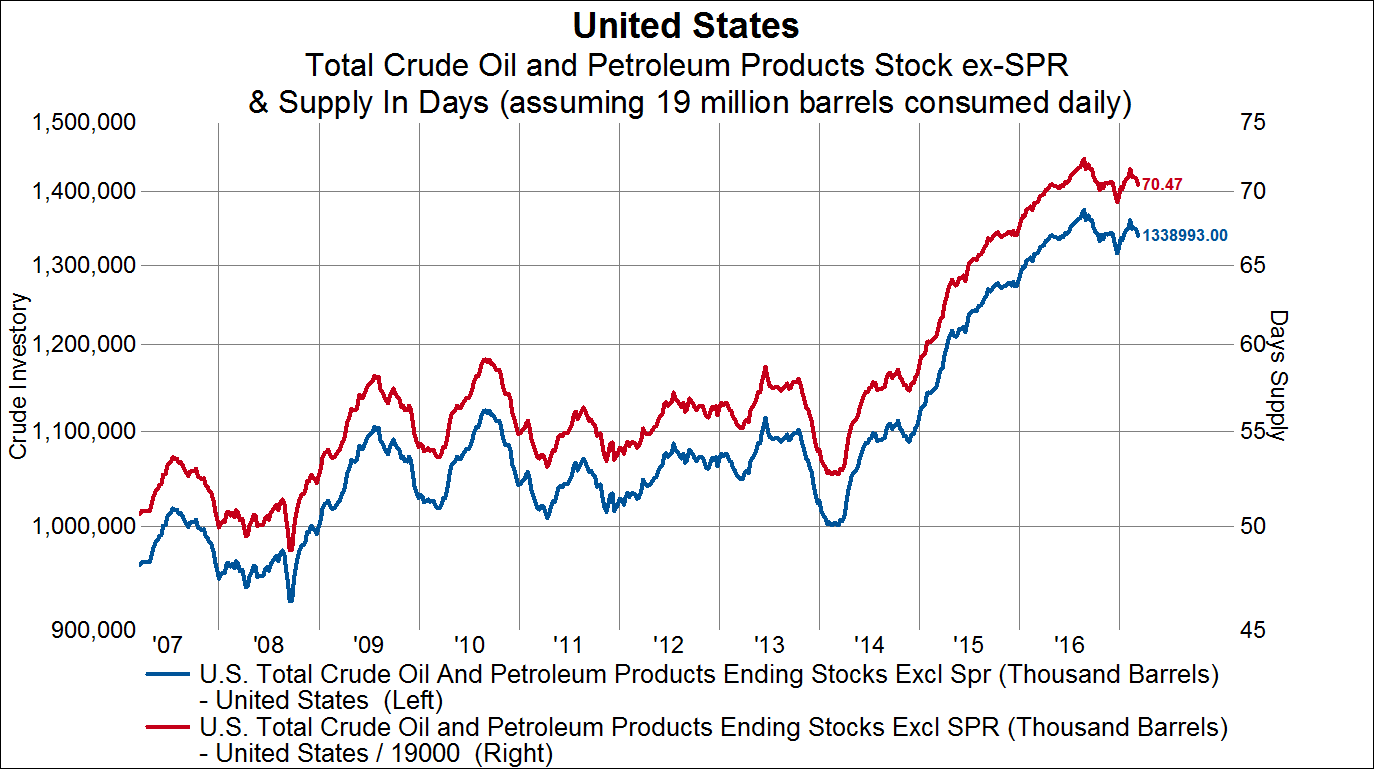
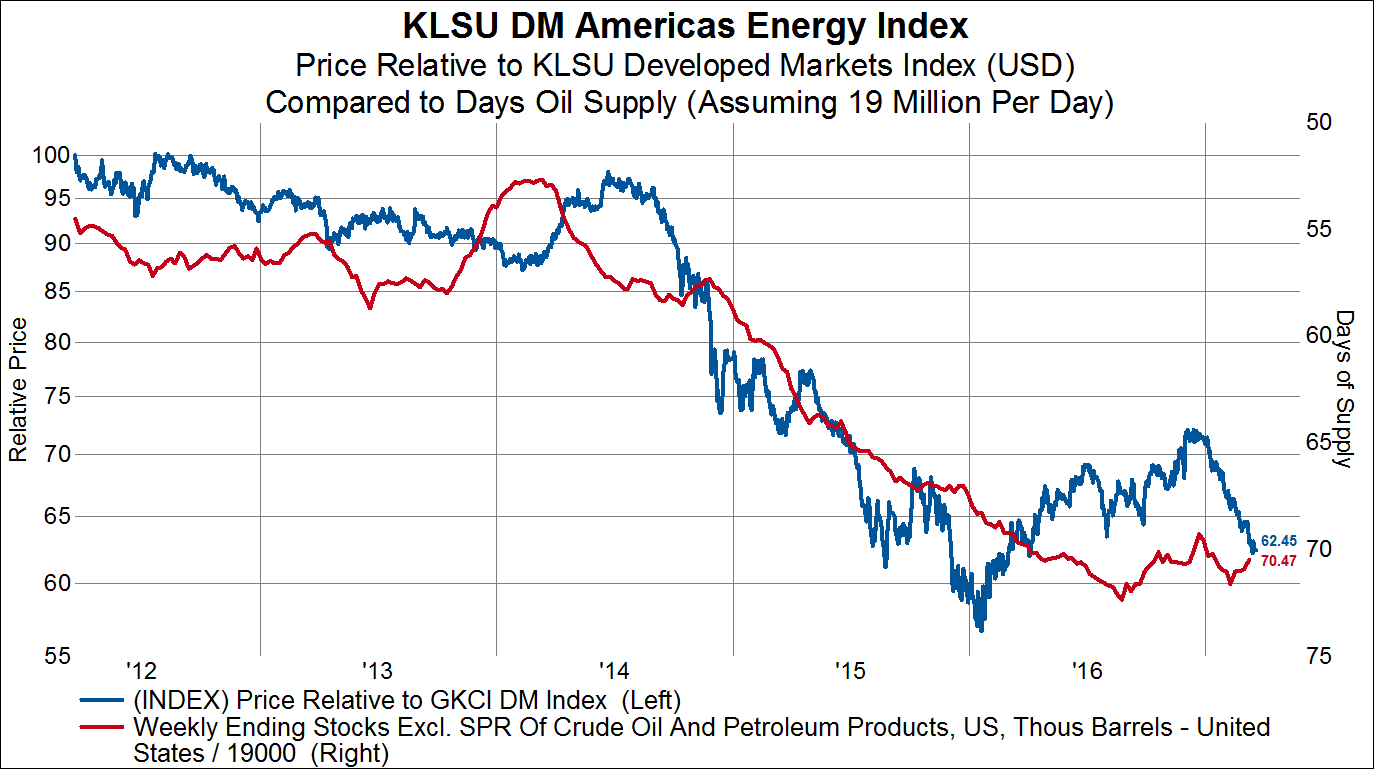
Crude inventories in the US peaked last year and have been flat for roughly a year. In the chart below, we show the aggregate amount of US crude inventories (1.338 million barrels) and then convert that into a days of supply by assuming demand of 19 million barrels/day. Currently, we are sitting on 70.5 days of inventory, which again is down from last year’s peak and about flat for the next year.
What are the investment conclusions of this analysis? There are at least two:
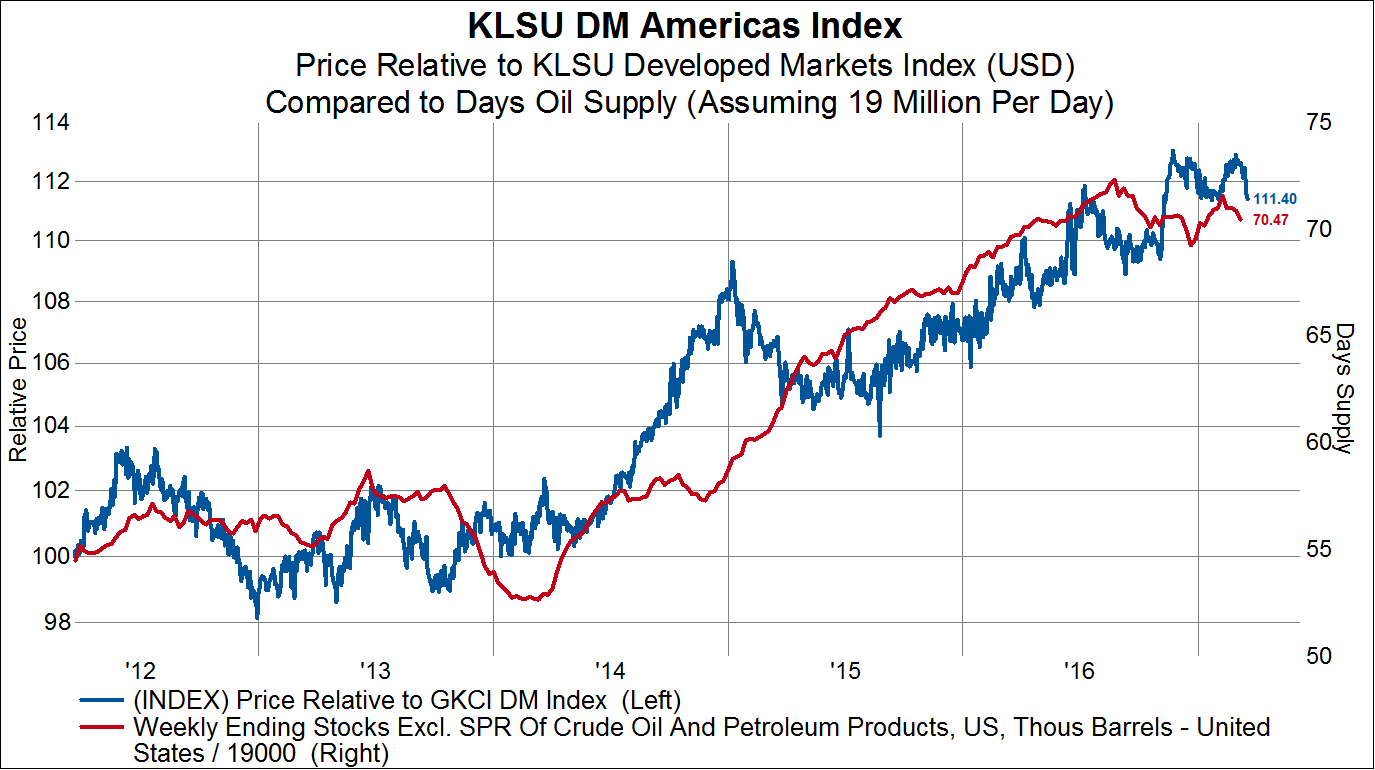
First, North American equities broadly outperform the global equity markets when the US is building oil inventories. Here I plot the relative performance of our KLSU North American Index (top 85% of all North American stocks, market cap weighted) compared to our KLSU Developed Markets Index (top 85% of Developed World equity markets, market cap weighted).
Second, and probably unsurprisingly, the North American energy sector underperforms when inventories are building. Here I show the relative performance of our KLSU Americas Energy Index compared to our KLSU Developed Markets Index.
With the positive fundamental changes going on in the energy space, combined with the current technical configuration, US energy stocks may be a decent place to hide if the equity market continues to drift lower. Not traditionally thought of as a defensive sector, energy may begin to exhibit characteristics of capital preservation.


