
History tends to repeat itself, and mining stocks appear to be repeating their 2008 performance, which has very interesting implications.
Why do I think that gold miners are repeating their 2008 price patterns? Please take a look at the below chart.
Q3 2022 hedge fund letters, conferences and more
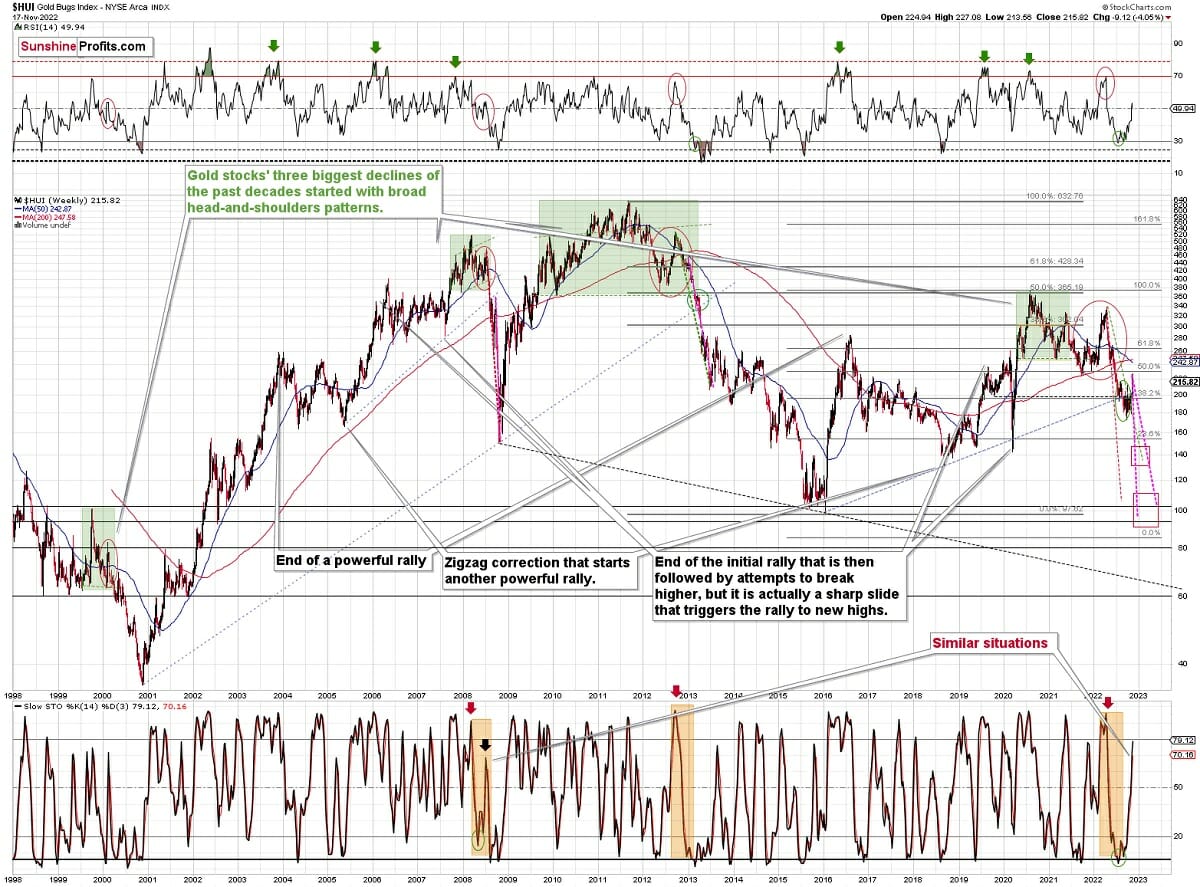
The only times when gold stocks declined similarly sharply as they did this year were in 2013 and in 2008.
Decline In Gold Stocks
Given that the situation in stocks appears to be similar to what we saw in 2008 (due to rising interest rates, for example), it seems that focusing on this analogy is particularly important right now.
All right, let’s zoom in and see how mining stocks declined in 2008.
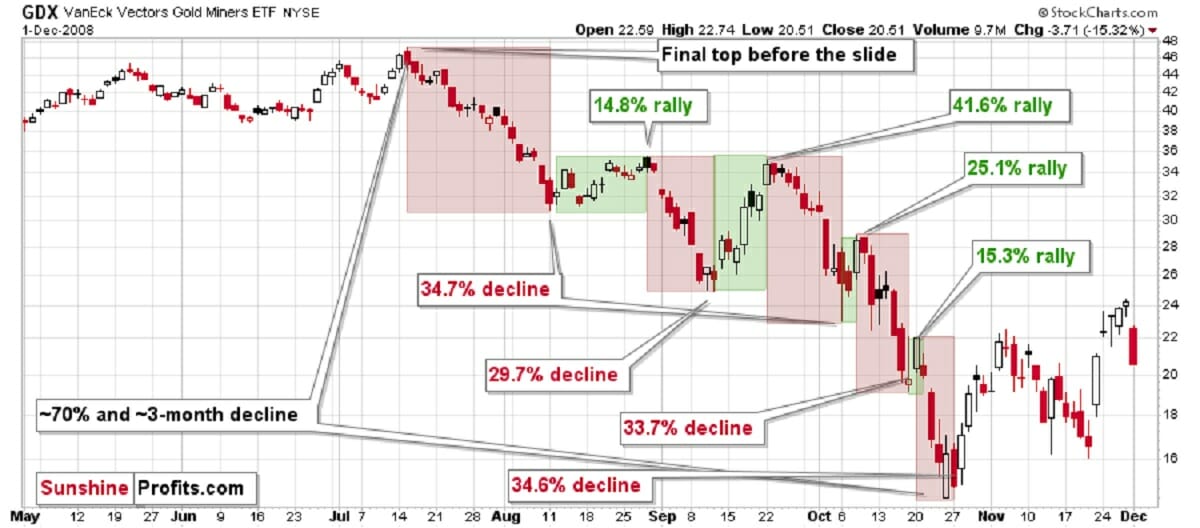
Back then, the GDXJ ETF was not yet trading, so I’m using the GDX ETF as a short-term proxy here.
The decline took about 3 months, and it erased about 70% of the miners’ value. The biggest part of the decline happened in the final month, though.
However, the most intriguing aspect of that decline – which may also be very useful this time – is that there were five very short-term declines that took the GDX down by about 30%.
I marked those declines with red rectangles. After that, a corrective upswing started. During those corrective upswings, the GDX rallied by 14.8-41.6%. The biggest corrective upswing (where GDX rallied by 41.6%) was triggered by a huge rally in gold, and since I don’t expect to see anything similar this year, it could be the case that this correction size is an outlier. Not paying attention to the outlier, we get corrections of between 14.8% and 25.1%.
Fast forward to the current situation. Let’s take a look at the GDXJ ETF.
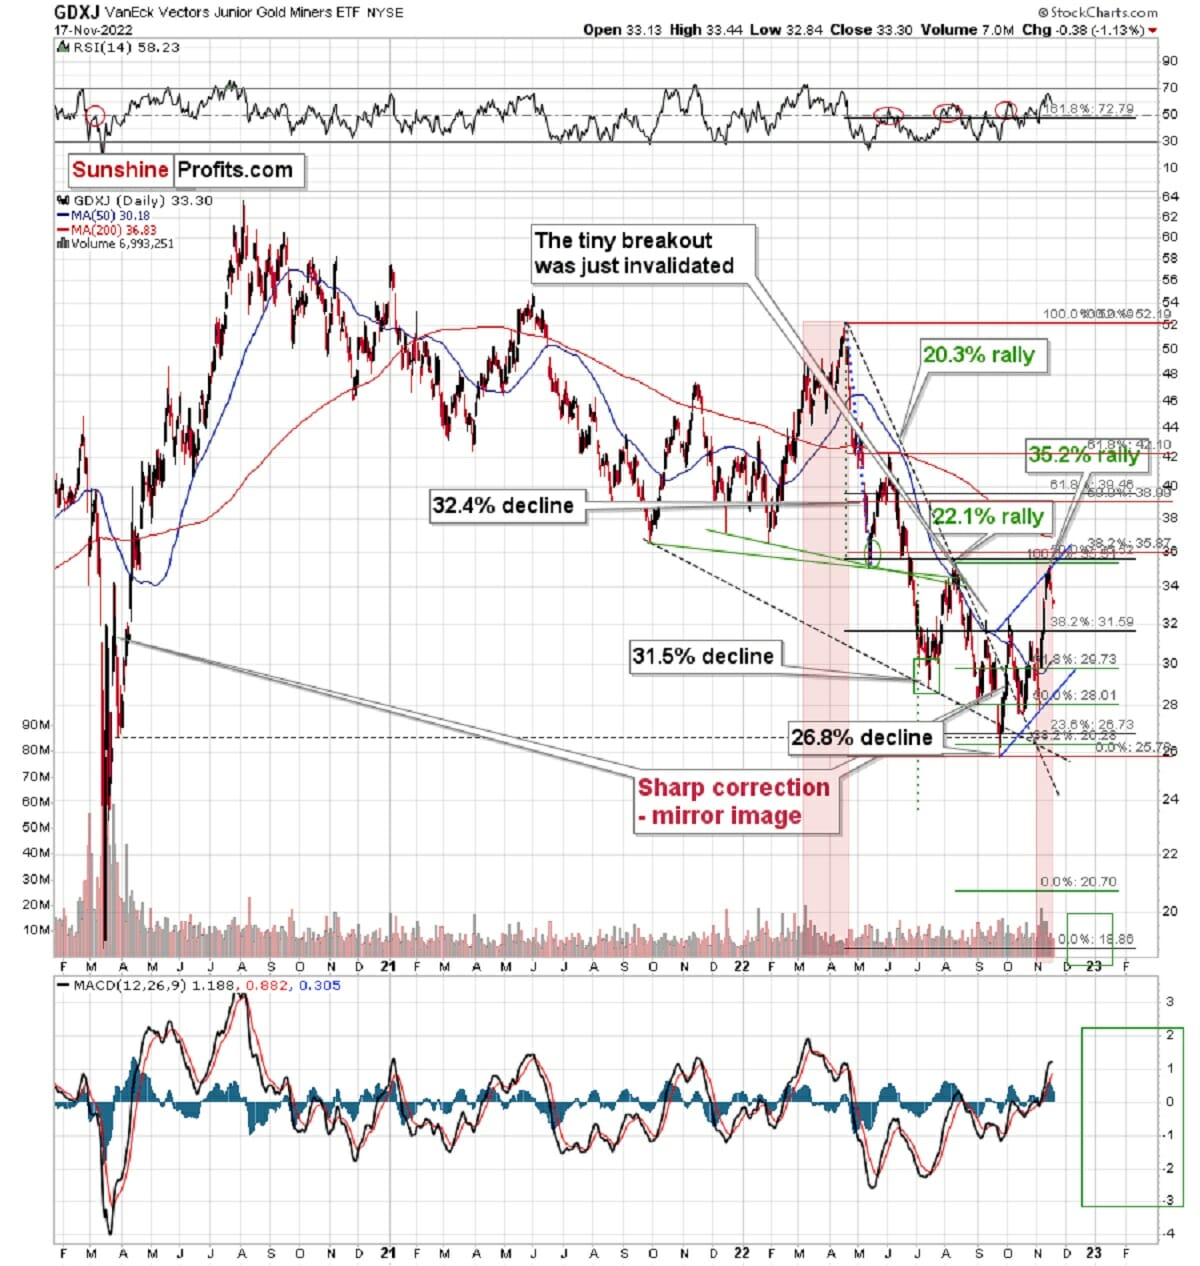
The junior mining stocks moved sharply higher recently, and this move took place on huge volume (I spoke about it on Nov. 7). The only similarly big volume that we saw recently was at the early-March top and the January top.
As history has shown, the massive attention that junior miners have received is a bearish indicator (not only for miners but also for related parts of the precious metals market, including gold and silver prices too).
Back in 2008, the biggest corrective upswing (the 41.6% rally) was the thing that preceded the biggest part of the medium-term decline.
This time, the volatility is not as big, but the size of the corrective upswing (assuming that it started in September) that we just saw is also greater than what we’ve seen before.
Consequently, it could be the case that what happened recently is what “had to” happen given the way history decided to rhyme. Please note that we can estimate what is likely to happen based on historical analogies, but we can never be 100% certain that a given analogy will work and some others won’t.
In this case, it seems that the correction happened, even though it didn’t “have to” happen based on many other techniques. Either way, the medium-term trend remains down, so the current corrective upswing is likely to be a “thing of the past of little meaning” sooner rather than later.
Speaking of analogies, I previously wrote that the current rally is a mirror image (it’s not a crystal-clear mirror, though) of the corrective decline that we saw in late March 2020. As it turned out, due to the most recent part of the upswing, the size of both moves became even more aligned.
And yes, this means that another decline could take the GDXJ all the way down to its 2020 low, or very close to it.
On the below chart, I marked just how perfectly the recent price moves played out according to the Elliott Wave Theory.
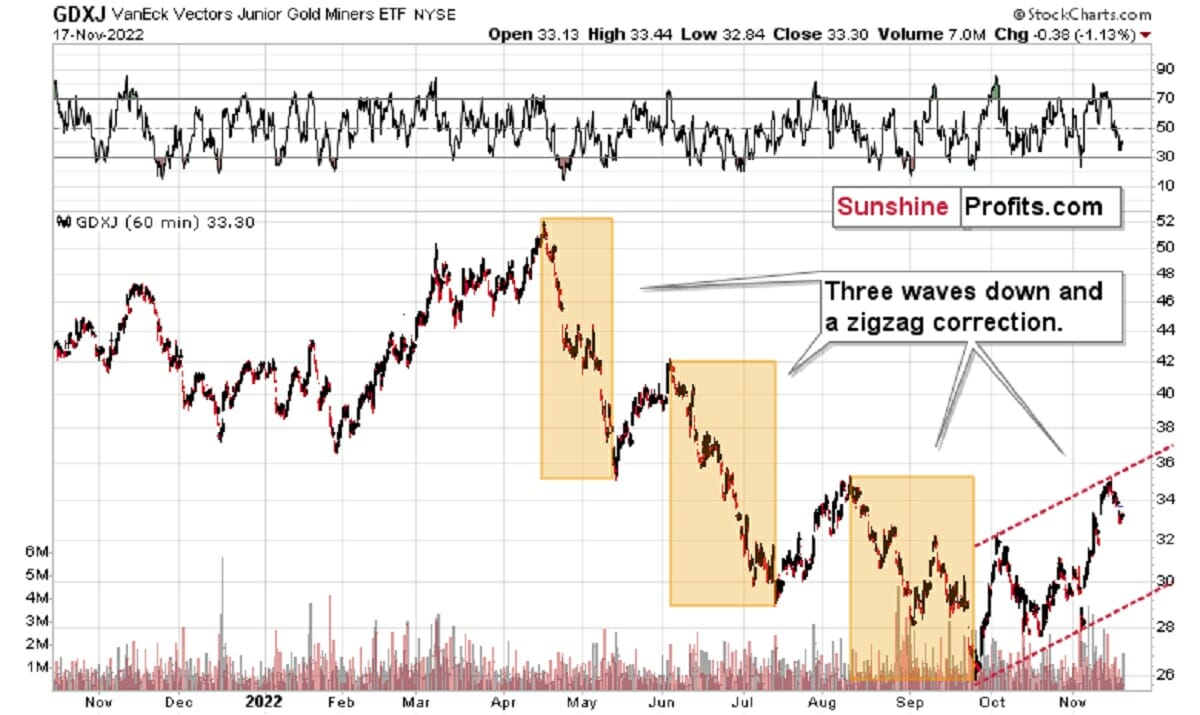
Of course, EWT is not the only tool that one could use, and I find other technical tools more useful, but still, this kind of pattern-following is uncanny.
The classic EWT pattern is three waves down (I marked those with orange rectangles) and then a correction consisting of two smaller waves.
That’s exactly what we have seen in recent months. The September–now pattern appears to be the above-mentioned correction. It didn’t only consist of two smaller waves higher – they were actually almost identical in terms of size and sharpness. This created a classic ABC correction (flag) pattern.
Now, since this pattern is complete, another huge 3-stage move lower can – and is likely – to unfold. This is very bearish for junior mining stocks (as well as for gold, silver, and probably other commodities), and the fact that juniors are already showing weakness relative to gold (on Wednesday, the latter was almost flat while miners declined) serves as a bearish confirmation.
As always, I can’t guarantee anything, but in my view, the profits that can be reaped on this upcoming slide in mining stocks can be enormous.
Thank you for reading our free analysis today. Please note that the above is just a small fraction of today’s all-encompassing Gold & Silver Trading Alert. The latter includes multiple premium details such as the targets for gold and mining stocks that could be reached in the next few weeks.
If you’d like to read those premium details, we have good news for you. As soon as you sign up for our free gold newsletter, you’ll get a free 7-day no-obligation trial access to our premium Gold & Silver Trading Alerts. It’s really free – sign up today.
Przemyslaw Radomski, CFA
Founder, Editor-in-chief
Sunshine Profits: Effective Investment through Diligence & Care
All essays, research and information found above represent analyses and opinions of Przemyslaw Radomski, CFA and Sunshine Profits’ associates only. As such, it may prove wrong and be subject to change without notice.
Opinions and analyses are based on data available to authors of respective essays at the time of writing. Although the information provided above is based on careful research and sources that are deemed to be accurate, Przemyslaw Radomski, CFA and his associates do not guarantee the accuracy or thoroughness of the data or information reported.
The opinions published above are neither an offer nor a recommendation to purchase or sell any securities. Mr. Radomski is not a Registered Securities Advisor. By reading Przemyslaw Radomski’s, CFA reports you fully agree that he will not be held responsible or liable for any decisions you make regarding any information provided in these reports.
Investing, trading and speculation in any financial markets may involve high risk of loss. Przemyslaw Radomski, CFA, Sunshine Profits’ employees and affiliates as well as members of their families may have a short or long position in any securities, including those mentioned in any of the reports or essays, and may make additional purchases and/or sales of those securities without notice.


