The Broad Market Index was down 0.53% last week and 61% of stocks out-performed the index. The third quarter financial statement update is underway now with 90 companies reporting last week. It is still too early to perform a macro analysis but interesting that those 90 names generated 19 buys and 4 sells.
Q3 2020 hedge fund letters, conferences and more
Most of the improvements are in industrial companies where sales growth is still negative but higher than last period. That improvement in sales growth is commonly the first sign of a cyclical recovery among industrials.
At the stock level – A quality GROWTH pattern requires:
- Higher sales growth
- Low & rising gross margin
- High & falling SG&A and interest costs
- Falling inventories and receivables
Cadence Design Systems, Inc. $112.050 BUY this rich company getting better
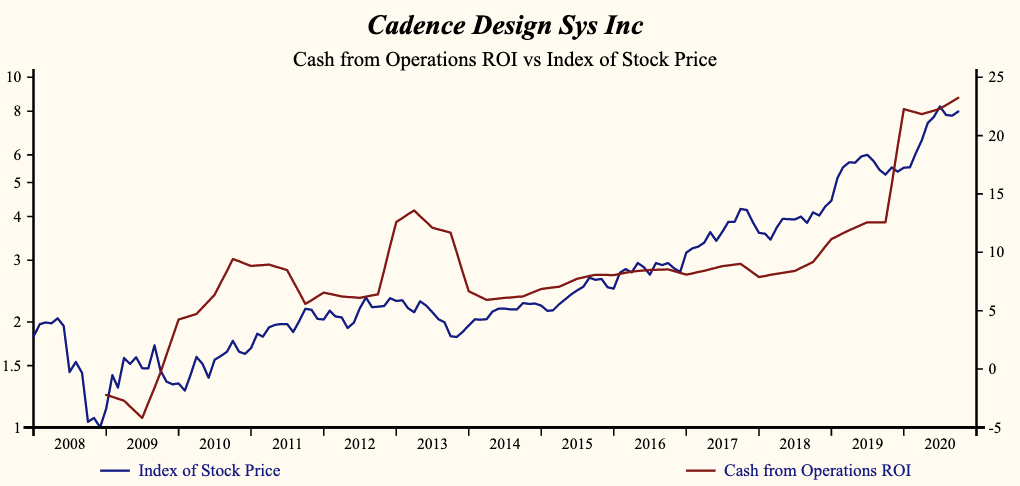
Cadence Design Systems Inc (NASDAQ:CDNS) has been a profitable company with persistently high cash return on total capital of 9.6% on average over the past 21 years. Over the long term the shares of Cadence Design Systems have advanced by 698% relative to the broad market index.
The shares have been highly correlated with trends in Growth Factors. The dominant factor in the Growth group is Cash-Operating Activities (ROI) which has been 92% correlated with the direction of the share price.
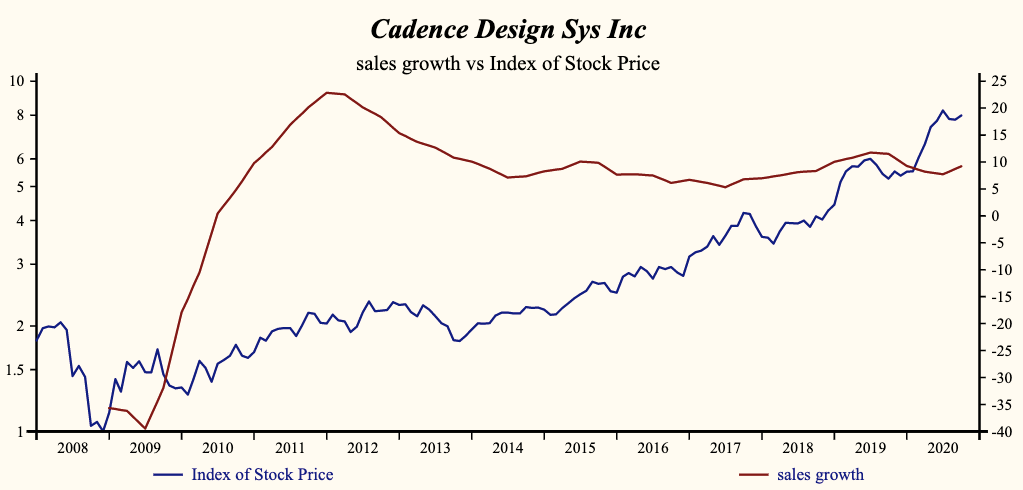
Currently, sales growth is 9.2% which is high in the record of the company and higher than last quarter. Receivable turnover has been steady since 2018 reflecting a strong quality of sales. The shares have been very highly correlated with the direction of sales growth.
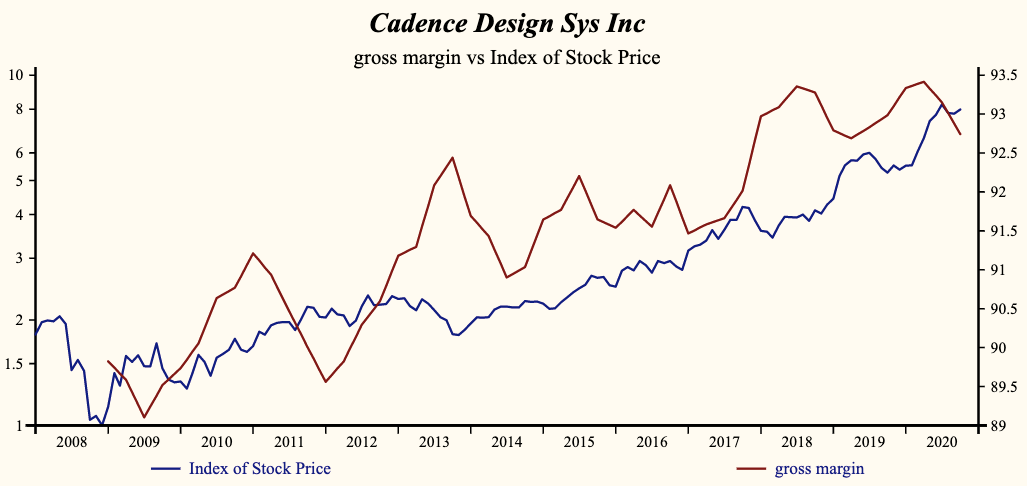
Cadence Design Systems is recording a high and falling gross profit margin but inventory turnover continues to decline. Sales, General & Administrative (SG&A) expenses are falling at a more rapid rate than the gross margin producing a rising profit margin. This is usually a poor-quality growth trend to the extent that lower costs can insulate the bottom line from top line weakness for only a short time. Conversely, other costs are steady with interest costs that are low in the record of the company and falling. Lower interest costs can not only free-up cash but are often associated with a better valuation.
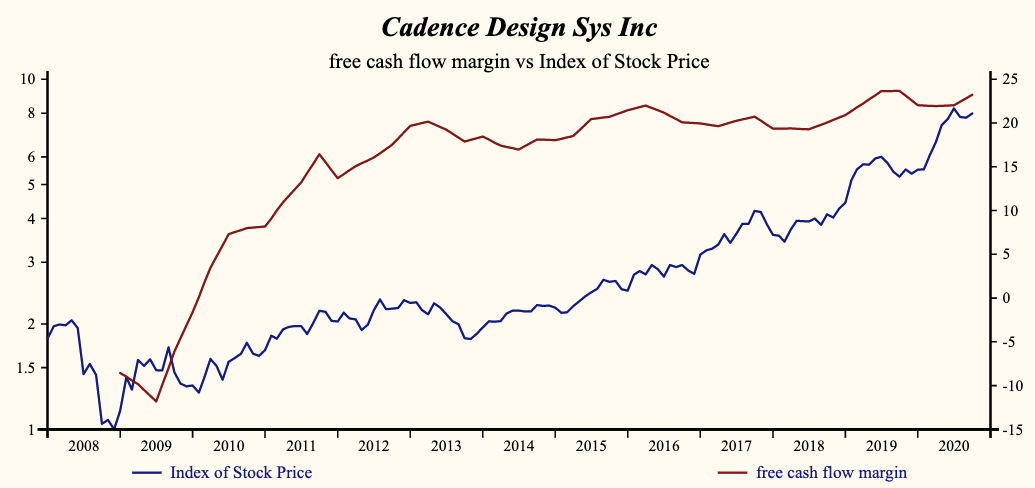
Free Cash Flow Growth
As a percentage of sales, free cash flow measures the relationship between cash flow growth and capital expenditures. Lower capital expenditures have helped increase free cash flow since early 2019. Despite a weaker gross margin, the lower costs are producing an acceleration in the EBITDA profit margin. It is the continuous reduction in costs since early 2018 that has been supporting cash flow and EBITDA growth and ultimately keeping free cash flow growth at all-time highs.
Up 326% since 2013
More recently, the shares of Cadence Design Systems, Inc. have advanced by 326% since the November, 2013 low. The shares are trading at upper-end of the volatility range in an 83-month rising relative share price trend.
Despite the extended share price, this provides a good opportunity to buy the shares of this evidently accelerating company.
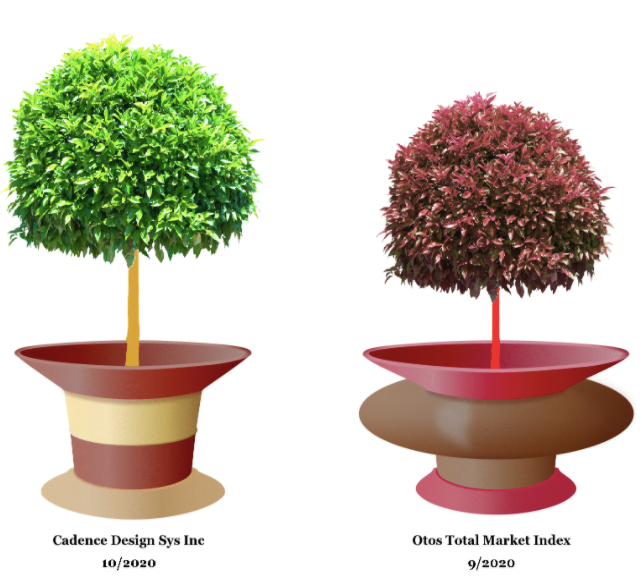
The more stable the pot appears, the better the attributes. Green and gold are good. Red is bad and the more intense the red the more urgent the call to action.