Excerpted with permission of the publisher, Cambridge University Press, from Boom and Bust: A Global History of Financial Bubbles by William Quinn and John D. Turner.
Q2 2020 hedge fund letters, conferences and more
Predicting Bubbles
The Bank had not kindled the fire, but, instead of attempting to stop the progress of the flames, it supplied fuel for maintaining and extending the conflagration. – Thomas Tooke
When we started writing this book in the summer of 2016, the monetary environment suggested that another bubble would develop soon. Interest rates were almost zero, and the historically low returns on traditional assets, especially government bonds, made them unappealing to investors. As banks recovered from the effects of the financial crisis, credit was becoming more widely available. The continuing development of the Internet meant that the marketability of financial assets was increasing. Although levels of speculation appeared to be relatively low, the bubble triangle suggested that a spark could change this very quickly.
A spark soon arrived in the form of blockchain technology: an encryption technique that allowed virtual assets known as cryptocurrencies to circulate without being managed by any central authority. The most widely known cryptocurrency was bitcoin. To its advocates, bitcoin was the money of the future: it could not be devalued through inflation by a central bank, you could spend it on anything without having to worry about government interference or taxes, and it cut out the middleman, namely commercial banks. A bitcoin did not represent anything of value – its worth lay entirely in the fact that it was, for some (mostly illicit) purposes, a superior medium of exchange.
In August 2016, one bitcoin was trading at $555; in the next 16 months its price rose by almost 3,400 per cent to a peak of $19,783.3 This was accompanied by a promotion boom, as a mix of cryptocurrency enthusiasts and opportunistic charlatans issued their own virtual currencies in the form of initial coin offerings, or ICOs. These coins had, on the face of it, no intrinsic value – to entitle their holders to future cash flows would have violated laws against issuing unregistered securities – but they nevertheless attracted $6.2 billion of money from investors in 2017 and a further $7.9 billion in 2018.
By December 2017, however, it had become clear that bitcoin was hardly being used as a currency at all. It had promised freedom from middlemen, but trading it without a third party was cumbersome unless the user was expert in cybersecurity. Its popularity exposed the inability of its systemto process large numbers of transactions, resulting in long delays in transferring bitcoins and substantial transaction costs. The impossibility of reversing mistakes made it impractical, and its volatility made it useless as a store of value or unit of account. And its much-vaunted decentralisationmeant that no one had the power to fix these considerable drawbacks. It was simply a speculative asset, and when investors began to cash out, bitcoin crashed. In the 7 weeks following its peak, it fell by 65 per cent, reaching $6,698 in February 2018. After a temporary recovery, it collapsed again. On 17 December 2018, exactly one year after its peak, one bitcoin was valued at $3,332 – a fall of 83 per cent.5 Other cryptocurrencies fared even worse: InvictusCapital’s CRYPTO20 index, which tracked the value of the 20 largest cryptocurrencies, fell by over 93 per cent. The bubble triangle presents a framework that applies just as well to the 2017 cryptocurrency bubble as it does to any of the financial bubbles over the past 300 years. But how good will it be at predicting future bubbles?
The three sides of the bubble triangle all need to be present for a bubble to happen. In terms of money and credit, bubbles are much more likely to happen when there are low yields on traditional assets, low interest rates and unconstrained credit provision. Indeed, deregulation of financial markets can ultimately result in a greater likelihood of bubbles occurring because it removes limits on the amount of fuel that can be created. Bubbles are also much more likely when marketability increases due to legal or regulatory changes, financial innovation or technological improvements. Speculators are always present in financial markets, but an increase in their number or an increase in the number of amateurs can increase the probability of a bubble because there is an increase in momentum trading. Bubbles start when investors and speculators react to new technology or political initiatives. Ultimately, the ability to predict bubbles chiefly comes down to being able to predict these sparks.
What do the various political sparks of major historical bubbles have in common? There appears to be no common pattern or grand socio-economic theory which explains why political sparks are created. Several of our bubbles have no politicians lining their own pockets. The political regimes in which historical bubbles occur range from absolutist monarchies to full franchise democracies. All we can say is that the incentives faced by the various governments in each episode resulted in the deliberate manufacture of bubbles or the introduction of policies which would necessarily create bubbles. This absence of common factors makes politically sparked bubbles difficult, but not impossible, for investors, citizens or the news media to predict.
Why is it that the same set of policies can produce a bubble in one instance but not in another? Our explanation is that the other elements of the bubble triangle are missing. It could be that financial markets are underdeveloped and so assets have limited marketability or there are a limited number of public companies. There could also be legal or cultural restrictions on speculation. Alternatively, the banking system, financial institutions and the capital markets might be so underdeveloped or heavily constrained that there is not enough money and credit to fuel a bubble.
Technological sparks are also difficult to predict because one must foresee what the effect of the technology will be, how people will react to it and whether it will catch on. In addition, one must understand the narrative surrounding the new technology and whether this makes it compelling to investors. Not all major technologies are associated with stock market bubbles. The development of steam technology, for example, occurred in an environment where the law was hostile to the company form and the stock market was underdeveloped, which severely hampered marketability. Steam technology was thus developed by small partnerships and private entrepreneurs.
Unlike steam, the new fourth industrial revolution technologies – biotech, nanotechnology and artificial intelligence – have been developed by companies, not individual entrepreneurs. However, unlike during the dot-com and other technology bubbles, the funding for these companies comes from venture capitalists (VCs) and institutional investors rather than stock markets. Notably, press commentators have referred to the ‘tech unicorn bubble’, a unicorn being a VC-backed company with a valuation greater than $1 billion. One study found that the average unicorn was overvalued by about 50 per cent above its fair value, and some were overvalued by more than 100 per cent.7 Although private investors may have substantially overpaid for the unicorns, by our definition – an upward movement of prices that then collapses – this would not be described as a bubble.
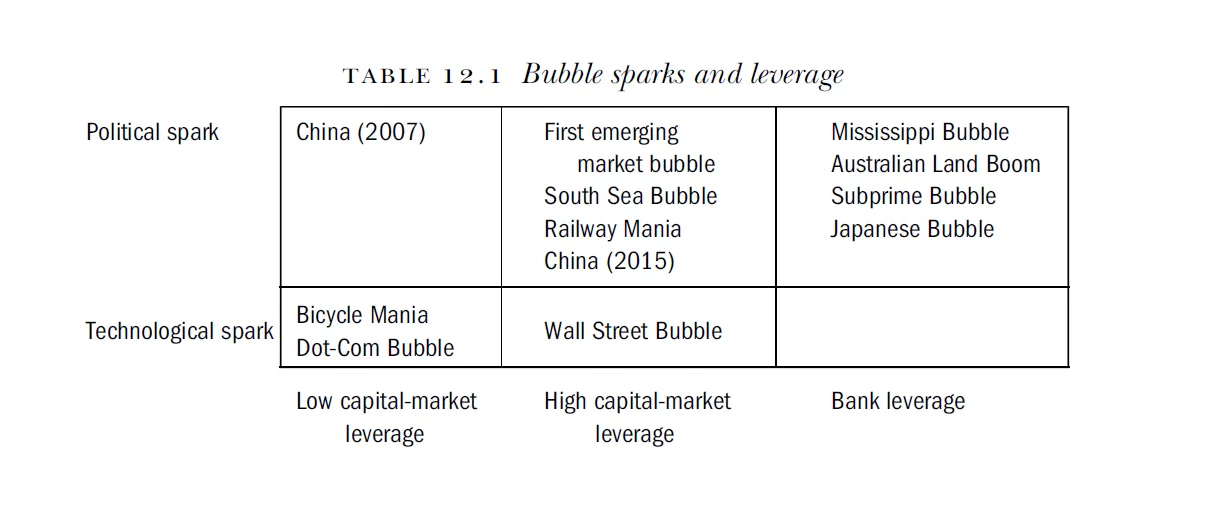
The bubble triangle can also help predict whether bubbles will be useful or destructive. Table 12.1 considers bubbles along two dimensions – the spark and leverage.8 Four of our historical bubbles are in the top right box, having a political spark and a bubble fuelled by bank leverage. Far from being useful, each of these bubbles had a devastating and prolonged effect on the economy and wider society. This implies that the combination of a political spark and bank leverage creates bubbles that cause great economic harm. The two bubbles in the bottom left box had few negative effects on the economy or wider society. Indeed, both were instrumental in generating investment in a new transformative technology which benefited and even liberated society.
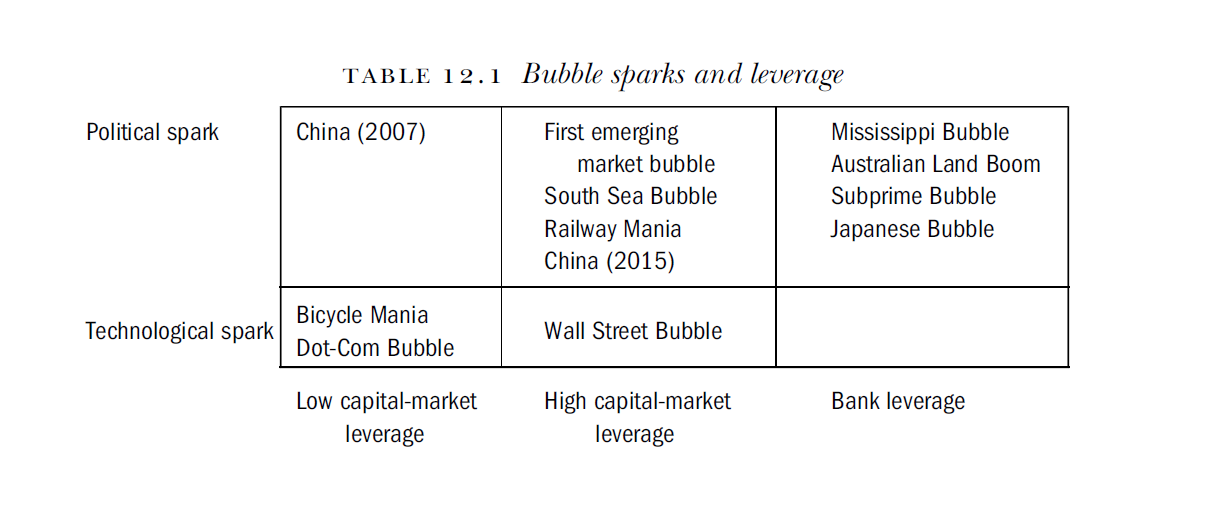
In the episodes in the middle two boxes, the extent of the economic damage depended on how exposed the financial system was to the capital-market leverage generated during the bubble. For those which threatened the financial system, the wider social benefit may have been bought at too high a price for society to afford. The South Sea Bubble, however, may be history’s only useful political bubble, putting Britain on a much firmer fiscal and military footing without any repercussions for the banking system.
If the bubble triangle is good at predicting bubbles, then it needs to be able to explain why bubbles have recently been occurring more frequently. More than a century separated the first and second financial bubbles, and after the Wall Street Crash there were no major bubbles for over 50 years. However, since 1990 a major bubble has occurred, on average, once every 6 years. These patterns can be explained by fluctuations in the degree to which credit and marketability were regulated. After the bubbles of 1720, marketability was regulated to the point where forming a company with tradeable shares was virtually impossible. This effectively removed the marketability side of the bubble triangle. The liberalisation of incorporation law, the development of stock markets and the growing middle classes joining the ranks of speculators over the next century increased the likelihood of bubbles, by ensuring that all three sides of the triangle were present. Similarly, after the Wall Street Crash, the regulation of financial markets, the stringent regulation of banks and the deglobalisation of capital both restricted marketability and limited the potential fuel for bubbles. However, the globalisation of capital and deregulation of banking since the 1970s has led to an unprecedented extension of credit and increase in debt. In addition, the deregulation of financial markets has made trading much cheaper and easier, greatly increasing the marketability of financial assets. The global economy has essentially become a giant tinderbox, susceptible to any spark that may come its way.
The question also arises as to whether more recent changes in financial markets will make bubbles more or less likely in the future. Two of the major changes in financial markets over the past two decades are the rise of algorithmic and high-frequency trading and asset management. Algorithmic trading is where buy and sell trades are automatically executed by computers based on pre-programmed instructions, and highfrequency trading is a type of algorithmic trading that can execute a large volume of trades in mere fractions of a second. Algorithmic and highfrequency trading are obvious increases in marketability, suggesting that they may make bubbles more likely. Recent experience has shown that such trading has the potential to move stock markets a great deal in a very short space of time: on 6 May 2010, the Dow Jones Industrial Average dropped 10 per cent in a matter of minutes, recovering these losses almost immediately. Algorithmic and high-frequency trading played a major role in this ‘flash crash’ and one can see how it has the potential to exacerbate price movements during bubbles.
Some economists believe that bubbles will become less likely in the future, because the rise of the asset management industry means that amateurish individuals with many behavioural flaws are being replaced by sophisticated investors.9 But recent history suggests otherwise. The Japanese Bubble was largely driven by institutional investors, and they also played a large role during the Dot-Com Bubble. During the housing bubble, it was chiefly institutions that invested in subprime mortgage-backed securities. Indeed, the rise of passive asset management, whereby funds track stock indexes, means that sectors or assets that are rising in price because of a bubble will attract even more funds than they ordinarily would. In other words, the rise of passive asset management has the potential to pour even more fuel on bubble fires in the future.


